1996 Pacific hurricane season

Last updated

1996 Pacific hurricane season
1996 Pacific hurricane season summary.jpg
Season summary map
Seasonal boundaries
First system formedMay 13, 1996
Last system dissipatedNovember 11, 1996
Strongest storm
Name Douglas
  Maximum winds130 mph (215 km/h)
(1-minute sustained)
  Lowest pressure946 mbar (hPa; 27.94 inHg)
Seasonal statistics
Total depressions15
Total storms9
Hurricanes5
Major hurricanes
(Cat. 3+)
2
Total fatalities46 direct, 2 indirect
Total damage$813,000 (1996 USD)
Related articles
Pacific hurricane seasons
1994, 1995, 1996, 1997, 1998

The 1996 Pacific hurricane season had below normal tropical cyclone activity, producing 9 tropical storms, of which 5 became hurricanes, with 2 of those intensifying into major hurricanes. With an Accumulated cyclone energy (ACE) index of 53.9, the season ranks among the least intense Pacific hurricane seasons on record. It officially began May 15, 1996, in the eastern north Pacific and on June 1, 1996, in the central north Pacific. It ended on November 30, 1996. These dates conventionally delimit the period of each year when most tropical cyclones form in the northeastern Pacific Ocean. [1] The season slightly exceeded these bounds when tropical storm One-E formed on May 13.

Contents

Much of the season's activity was clustered near the coast of Southwest Mexico, with four hurricanes and one tropical storm making landfall along it. The most impactful were: Hurricane Alma, which was responsible for 20 deaths, and Hurricane Fausto, which left behind damage amounting to around $800,000 (1996 USD). Hurricane Douglas was the strongest storm of the season, reaching Category 4 intensity on the Saffir-Simpson Hurricane Scale. Douglas developed in the Caribbean Sea, within the Atlantic basin, as Hurricane Cesar, before crossing into the Pacific as a tropical storm.

Seasonal summary

Hurricane Hernan (1996)Hurricane Fausto (1996)Hurricane Dolly (1996)Hurricane Cesar–DouglasTropical Storm Cristina (1996)Hurricane Boris (1996)Hurricane Alma (1996)Saffir–Simpson hurricane wind scale1996 Pacific hurricane season
Least intense Pacific hurricane seasons [2]
RankSeason ACE value
1 1977 22.3
2 2010 51.2
3 2007 51.6
4 1996 53.9
5 2003 56.6
6 1979 57.4
7 2004 71.1
8 1981 72.8
9 2013 74.8
10 2020 77.3

The season officially began on May 15 in Eastern Pacific and on June 1 in Central Pacific; both ended on November 30. [3] This season was below average in activity. In the eastern north Pacific, eleven tropical cyclones formed. Of these, four became hurricanes, one of which were major hurricanes because they reached Category 3 or higher on the Saffir-Simpson Hurricane Scale. The remainder were tropical storms. [4] In addition, one Atlantic hurricane, Cesar, crossed into the Pacific as a tropical storm, at which time it was renamed Douglas. [5] None of the systems in the eastern north Pacific crossed 140°W into the central Pacific. The last time that happened was in the 1979 season. [6]

In the central Pacific, one tropical depression formed. In addition, a depression crossed the dateline from the western Pacific before dissipating in this basin. Neither of these systems reached tropical storm strength. [7] In addition, data from the Joint Typhoon Warning Center, on September 1 Tropical Depression Rick crossed the International Dateline, entering into CPHC's area of responsibility; [8] however, this storm was not included into CPHC database. The storm eventually became extratropical on September 3 over open waters.

In terms of the number of storms, the season was below average. Despite this, there were a large number of landfalls. Of note is the fact that three tropical cyclones approached close to, or made landfall on, Mexico during a ten-day span from June 23 to July 3. [9] In all, a record-setting four hurricanes (Alma, Boris, Fausto, and Hernan) struck the coastline. [10]

The Accumulated Cyclone Energy (ACE) index for the 1996 Pacific hurricane season (Eastern Pacific and Central Pacific combined) as calculated by Colorado State University using data from the National Hurricane Center was 53.9 units, [nb 1] [11] making this season a below-normal season. It is one of the lowest totals ever recorded, with only the 1977, 2010 and 2007 seasons having a lower ACE.

Systems

Unnamed Tropical Storm (One-E)

Tropical storm (SSHWS)
Unnamed TS 14 may 1996 1451Z.jpg   1-E 1996 track.png
DurationMay 13 – May 16
Peak intensity50 mph (85 km/h) (1-min);
1000  mbar  (hPa)

The season had an early start on May 13 when a tropical wave in the open ocean organized into Tropical Depression One-E. The depression moved west-northwest and strengthened into a tropical storm on May 14. On that day, the tropical storm reached its peak intensity, with maximum sustained winds at 50 mph (80 km/h) and a minimum central pressure of 1,000 hPa (29.53 inHg). [12] Wind shear steadily weakened the cyclone until it dissipated early on May 17. This system was the only tropical storm to form in May during the period from 1992 to 1999. [13]

This storm was not assigned a name because it was determined to be a tropical storm after the season was over. [12] The storm was initially forecast to become a tropical storm, but information available at the time did not warrant the upgrade. [14] Subsequently, wind reports relayed from the US Coast Guard to the National Hurricane Center suggested that this cyclone was a tropical storm. [12]

This tropical cyclone impacted two ships. The first — called the True Blue — was near the fringes of the storm and escaped. The other — the trimaran Solar Wind — provided wind observations until communications with the vessel were lost after 0600 UTC on May 14. Despite a search by the US Coast Guard, the ship and its two-person crew were never found. [12]

Tropical Depression Two-E

Tropical depression (SSHWS)
TD 2E 15 may 1996 1427Z.jpg   2-E 1996 track.png
DurationMay 15 – May 19
Peak intensity35 mph (55 km/h) (1-min);
1006  mbar  (hPa)

On May 15 an area of disturbed weather in the Intertropical Convergence Zone developed into a tropical depression. The disturbance was not readily traceable back to a tropical wave from the Atlantic. On its first day of its existence, Tropical Depression Two-E was a well-organized system with maximum sustained winds of 35 mph (56 km/h) and a minimum central pressure of 1,006 mbar (29.7 inHg). [15] As it slowly moved west, Two-E experienced a few intermittent bursts of convection. However, the depression gradually became less organized during the remainder of its life. On May 18, the cyclone's organization deteriorated markedly until it dissipated the next morning.

Tropical Depression Two-E never threatened land. Consequently, there were no reports of deaths or damage. [15]

Hurricane Alma

Category 2 hurricane (SSHWS)
Alma 1996-06-23 1800Z.png   Alma 1996 track.png
DurationJune 20 – June 27
Peak intensity105 mph (165 km/h) (1-min);
969  mbar  (hPa)

On June 20, the southern part of the same tropical wave that spawned Tropical Storm Arthur in the Atlantic overcame shear to strengthen into Tropical Depression Three-E. It reached tropical storm intensity that same day. When the shear relaxed, Alma strengthened into a hurricane. Weak steering currents sent Alma towards the Mexican coast. It made landfall near Lázaro Cárdenas, Michoacán, on June 23 and almost immediately went back out to sea. Alma slowly paralleled the coast as the topography disrupted the cyclone's circulation. Alma weakened to tropical storm intensity on June 24 and to tropical depression intensity on June 26. It dissipated the next day. Alma's maximum winds were 105 mph (165 km/h) and Alma's minimum pressure was 969 mbar (28.6 inHg). [16]

Hurricane Alma was the first of three consecutive storms to come close to, or make landfall on, the Pacific coast of Mexico during a ten-day span. At least three, and possibly twenty, people were killed. Three were killed when a house near Lázaro Cárdenas collapsed. There were unconfirmed reports that 17 people were killed by floods in the state of Puebla caused by Alma's rains. Trees were downed and power was knocked out to many places. Roads were flooded and covered with debris throughout the affected area. [16]

Hurricane Boris

Category 1 hurricane (SSHWS)
Boris 1996-06-29 2015Z.png   Boris 1996 track.png
DurationJune 27 – July 1
Peak intensity90 mph (150 km/h) (1-min);
979  mbar  (hPa)

On June 27, a tropical wave developed convection and became Tropical Depression Four. It moved north and slowly intensified. The rate of intensification increased and the depression became a tropical storm on June 28. Boris reached hurricane intensity on June 28 and peaked with winds of 90 mph (150 km/h) and a central pressure of 979 mbar (28.9 inHg). [17] Boris then made landfall on June 29 about midway between Lázaro Cárdenas and Acapulco. Boris then moved offshore after turning to the southwest and dissipated on July 1 while south of Puerto Vallarta. [17]

Hurricane Boris was, in general, a well-forecast storm. Due to the short time when the system was at or above tropical storm intensity, long-range forecasts were not verified. The average errors were 116 mi (187 km) at one and a half days in the future. [17] Boris caused at least five deaths. One person was killed in Tecpan. Nearby, three other people drowned and five fishers were missing. In Acapulco, a child was killed when a roof collapsed. [17] Rain was heavy throughout the impacted region, with the highest totals in Guerrero. [17] The highest total was 14.98 in (380 mm) at Paso de San Antonio, to the east of the point of landfall. [18]

Tropical Storm Cristina

Tropical storm (SSHWS)
Cristina 1996-07-02 1800Z.png   Cristina 1996 track.png
DurationJuly 1 – July 3
Peak intensity70 mph (110 km/h) (1-min);
991  mbar  (hPa)

On July 1, a tropical wave organized into Tropical Depression Five-E. [9] The location of the depression was the easternmost since the depression that eventually became Hurricane Paul in the 1982 season. [19] Five-E strengthened into Tropical Storm Cristina on July 2 as it continued its west-northwest track. Cristina was almost a hurricane at the time of its landfall near Puerto Ángel on July 3. It peak strength, which occurred at landfall, was 70 mph (110 km/h) and 991 mbar (29.3 inHg). Cristina dissipated over the mountains of Mexico on July 3. [9]

As a whole, both Cristina's intensity and track were well-forecast. However, the tropical cyclone's short life made verification of a small number of forecasts limited. [9] When Cristina was approaching, the Mexican government issued a tropical storm warning for the coast between Tapachula and Punta Maldonado on July 2. [9]

Tropical Storm Cristina killed one person, a fisherman, who was aboard a boat caught at sea. Another person from that boat was missing, and a third individual was rescued. Eleven other fishing boats, with a total of twenty-two people aboard, were missing. Their fate is unknown. [9] The National Hurricane Center received no reports of damage due to Tropical Storm Cristina; however, there was flooding due to storm surge and damage from wind. It also produced rain. [9]

Tropical Depression Six-E

Tropical depression (SSHWS)
TD 6E 05 july 1996 1415Z.jpg   6-E 1996 track.png
DurationJuly 4 – July 6
Peak intensity35 mph (55 km/h) (1-min);
1003  mbar  (hPa)

On July 4, a persistent area of thunderstorms organized into a tropical depression. Weak steering currents slowly moved it northwest. [20] Easterly wind shear inhibited the development of the system. [21] Despite the wind shear, Six-E was forecast to strengthen into a tropical storm, [22] but it instead weakened to a swirl of clouds and advisories were ended on July 5. [23] Tropical Depression Six-E dissipated on July 6. At its peak strength, Six-E had winds of 35 mph (56 km/h) and a central pressure of 1,003 mbar (29.6 inHg). [24]

This cyclone never came ashore. Consequently, no reports of damage or deaths were received by the National Hurricane Center. [24]

Hurricane Douglas

Category 4 hurricane (SSHWS)
Douglas 1996-08-01 1745Z.png   Cesar-Douglas 1996 track.png
DurationJuly 29 (Entered basin) – August 6
Peak intensity130 mph (215 km/h) (1-min);
946  mbar  (hPa)

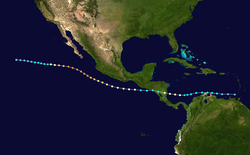
Hurricane Douglas was a continuation of Atlantic Hurricane Cesar, which crossed Central America. Continuing Cesar's nearly due-west heading, it was still a tropical storm when it entered the Pacific on July 29, and quickly regained hurricane status. [5]

Douglas strengthened over the next two days as it turned west-northwest, paralleling the coast of Mexico. It reached its peak intensity on August 1, with winds of 130 mph (215 km/h) and a central pressure of 946 mbar (27.9 inHg), making it the strongest hurricane of the season at a Category 4 strength. [5] It slow weakening began on August 2 as it entered cooler waters, and it officially dissipated on August 6, though like many Pacific hurricanes, a remnant circulation could be tracked westward for several days afterward. [5]

Compared with the long-term average, Hurricane Douglas was a well-forecast storm. [5] The cyclone passed close enough to Mexico to necessitate a tropical storm warning starting on July 29 for the coast from Salina Cruz to Acapulco, with a watch along a further section of coast. The watches and warnings were discontinued on July 30. [5]

Hurricane Douglas brought up to 6 in (150 mm) of rain on the south coast of Mexico and resulted in a 4-ft (1.2-m) storm surge. [25] No deaths or damages were attributed to the Douglas portion of Hurricane Cesar-Douglas. [5]

Tropical Depression Seventeen-W

Tropical depression (SSHWS)
TD 17W 13 aug 1996 0118Z.jpg   17-W 1996 track.png
DurationAugust 14 (entered basin) – August 15 (exited basin)
Peak intensity35 mph (55 km/h) (1-min);
1000  mbar  (hPa)

A tropical depression, which formed on August 13, from a cutoff area of low pressure area, crossed the dateline on August 14. It continued to head east, passing close to Midway Island. It dissipated on August 14, although the remnants of the system hung around the area for a few more days. At its strongest in the central north Pacific, Tropical Depression Seventeen-W had winds of 35 mph (56 km/h) and a pressure of 1,000 mbar (30 inHg). [7] [26]

Seventeen-W brought light winds, with gusts reaching gale-force, to Midway Island. It also brought about 2.5 in (63.5 mm) of rain. After the cyclone dissipated, showers and gusty winds continued to occur on Midway and Kure for a few more days. [7]

Tropical Depression Dolly

Tropical depression (SSHWS)
Dolly 1996-08-20 1800Z.png   Dolly 1996 track.png
DurationAugust 24 (Entered basin) – August 25
Peak intensity25 mph (35 km/h) (1-min);
1005  mbar  (hPa)

After making landfall along the Bay of Campeche coast north of Tuxpan, Veracruz, Hurricane Dolly managed to maintain its tropical characteristics while crossing the Mexican Plateau, and entered the eastern Pacific as a tropical depression late on August 24. Though the system entered the eastern Pacific intact, the National Hurricane Center did not re-classify it as an eastern Pacific tropical depression, nor were any coastal advisories issued. No re-intensification occurred after the system entered the eastern Pacific, and it dissipated early the following day, just west of San Juanito in the Islas Marías. [27]

Tropical Storm Elida

Tropical storm (SSHWS)
Elida 1996-09-03 2130Z.png   Elida 1996 track.png
DurationAugust 30 – September 6
Peak intensity65 mph (100 km/h) (1-min);
994  mbar  (hPa)

A tropical wave organized into Tropical Depression Eight-E on August 30. The cyclone paralleled the coast of Mexico and also gradually decelerated. Despite some wind shear, Eight-E strengthened into a tropical storm on September 2 and was named Elida. On September 3 and 4, Elida came close to the southern tip of the Baja California Peninsula at its peak intensity of 994 mbar (29.4 inHg) and winds of 65 mph (100 km/h). The cyclone then drifted into cooler waters, was devoid of deep convection on September 5, and dissipated the next day. [28]

The storm was forecast slightly better than the long-term averages for the eastern North Pacific. [28] Elida posed enough of a threat to the Baja California Peninsula to require a tropical storm warning for the Baja California Peninsula south of Cabo San Lázaro on September 3. The warning was lifted on September 5 after the threat ended. [28] Moderate to heavy rains fell in association with the tropical cyclone across southwest Mexico and the Baja California Peninsula, with the maxima falling at San Marcos/Compostela in southwest mainland Mexico, which measured 6.60 in (168 mm), and a maximum for Baja California of 3.88 in (99 mm) at La Poza Honda/Comondu. [29] While passing offshore, the tropical storm killed six people and affected 1,200 others, [30] but Elida caused no known damage. [28]

Hurricane Fausto

Category 3 hurricane (SSHWS)
Fausto 1996-09-12 2045Z.png   Fausto 1996 track.png
DurationSeptember 10 – September 14
Peak intensity120 mph (195 km/h) (1-min);
955  mbar  (hPa)

The precursor disturbance to Fausto was first noticed over Venezuela as early as August 31, and may have been related to the tropical wave that spawned Hurricane Fran. [31] By September 4 the wave had crossed Central America into the Pacific; it steadily organized until it was upgraded to Tropical Storm Fausto on September 10. [31]

Fausto intensified rapidly after it reached hurricane intensity on the September 12, peaking with sustained winds of 105 knots (194 km/h) and a minimum central pressure of 955 mb. [31] The hurricane weakened as an approaching trough increased shear over the storm; this same trough also turned the storm north on the September 13, where it made landfall as a minimal hurricane on Baja California that day. [31] On September 14, the storm turned northeastward across the Gulf of California, and dissipated inland over the Sierra Madre range after its second landfall as a hurricane. [31] Its extratropical remnants flared up briefly over northern Mexico and the U.S. state of Texas, but otherwise soon lost their identity.

Heavy rainfall was accompanied with the passage of this cyclone, with a storm total of 18.50 inches (470 mm) reported at San Vicente de la Sierra. [32] Damage in Mexico was relatively minor, with only a single casualty caused by a downed power line. [31] Damage totaled to around $800,000 (1996 USD). [33]

Tropical Depression One-C

Tropical depression (SSHWS)
TD 1C 17 sept 1996 2354Z.jpg   1-C 1996 track.png
DurationSeptember 15 – September 20
Peak intensity35 mph (55 km/h) (1-min);

A tropical disturbance organized into a tropical depression on September 15. It headed west until September 17. That day, it turned to the west for two days before heading back west-northwest on September 19. It soon began to weaken and dissipated the next day. At its most intense, Tropical Depression One-C had winds of 35 mph (55 km/h) and unknown pressure. [6]

The tropical cyclone caused no known impact and never came near land. [6]

Tropical Storm Genevieve

Tropical storm (SSHWS)
Genevieve 29 sept 1996 2143Z.jpg   Genevieve 1996 track.png
DurationSeptember 27 – October 9
Peak intensity50 mph (85 km/h) (1-min);
999  mbar  (hPa)

In the Gulf of Tehuantepec, an area of disturbed weather containing convection formed on September 23. It moved westward without incident until September 27, when it developed stronger convection and became Tropical Depression Ten-E. Immediately thereafter, it strengthened into a tropical storm and was named Genevieve while it continued its westward track. [34]

Genevieve slowly got better organized, and reached its peak intensity of 999 mbar (29.5 inHg) and 50 mph (85 km/h) on September 29. [34] The tropical storm then turned to the west-southwest as steering currents collapsed. The cyclone began a time of erratic motion, which included two loops. The erratic motion also exposed Genevieve to wind shear, and the tropical storm weakened to a tropical depression on October 1. On October 6, the shear temporarily weakened, and Tropical Depression Genevieve restrengthened into a tropical storm. The cyclone's wandering continued, and it entrained dry air. This dry air weakened the system to a depression for a second time on October 8, and Genevieve dissipated the next day. Brief flare-ups of convection could still be seen for a few days thereafter. [34]

Tropical Storm Genevieve was a rather poorly forecast storm. Most tropical cyclone prediction models indicated a northwesterly track that never happened, and also over-intensified the system. [34] In addition, advisories on Tropical Depression Genevieve were discontinued on October 3, and only resumed three days later. Later analysis determined that Genevieve had been a tropical depression for this whole time. [34]

Tropical Storm Genevieve never came near land, and consequently no watches or warnings were required for any location. The tropical cyclone had no impact on any land. [34]

Hurricane Hernan

Category 1 hurricane (SSHWS)
Hernan 1996-10-02 1800Z.png   Hernan 1996 track.png
DurationSeptember 30 – October 4
Peak intensity85 mph (140 km/h) (1-min);
980  mbar  (hPa)

On September 30, a tropical wave organized into Tropical Depression Eleven-E. Gradual strengthening ensued, and the depression strengthened into a tropical storm twelve hours later and was named Hernan. [35] Hernan's initial track was to the west, but the system gradually started to recurve. Its center of circulation reformed, and Hernan briefly turned to the northwest again. By October 2, and Hernan was close to the coast. It strengthened into a hurricane that day. Late on October 2 and early on October 3 Hernan closely paralleled the coast. Interaction with land weakened the cyclone, and when Hernan made landfall on October 3 near Barra de Navidad, Jalisco, it was only a minimal hurricane. Land weakened the cyclone, and by the time it emerged into the ocean north of Puerto Vallarta, it was so disorganized that it dissipated on October 5. At its strongest, Hurricane Hernan had winds of 85 mph (140 km/h) and a central pressure of 980 mbar (29 inHg). [35]

The National Hurricane Center forecasts on the hurricane were generally forecast slightly worse than the "average" system. Errors by tropical cyclone prediction models were attributed mainly to Hernan's recurvature. In terms of intensity, this system was correctly predicted to become a hurricane although advisories underforecast its eventual intensity. [35]

For the coast from Acapulco to Manzanillo, a tropical storm warning was issued on October 1. A hurricane watch was issued from Zihuatanejo to Manzanillo on October 2. It was upgraded to a warning later that day. Also on October 2, the coast from Manzanillo to San Blas was placed under a tropical storm warning. Meanwhile, the hurricane warning was extended to Cabo Corrientes. On October 3, the hurricane warning was extended to San Blas and the tropical storm warning was extended to Mazatlán. [35]

Because it made landfall in a sparsely populated area, Hernan killed no one. Around 1,000 homes were damaged or destroyed and 100 people were injured. Flooding occurred in Melaque, Jalisco. Flooding also caused washed-out roads along Federal Highways 200 and 80. In many areas, telephone service was interrupted and power outages occurred. Along the coasts of Colima and Jalisco, waves caused by Hernan reached 13 ft (3.9 m) in height. [35]

Tropical Depression Twelve-E

Tropical depression (SSHWS)
TD 12E 07 nov 1996 2119Z.jpg   12-E 1996 track.png
DurationNovember 7 – November 11
Peak intensity35 mph (55 km/h) (1-min);
1003  mbar  (hPa)

A system acquired enough convection and became organized enough to be considered a tropical depression on November 7. [36] Although the environment was initially favourable and the system was almost upgraded into a tropical storm as was forecast, [37] wind shear kept the cyclone weak. Its convection was eventually destroyed and advisories were ended on November 10. [38] Twelve-E dissipated on November 11 and no deaths or damages were reported. [39]

Storm names

The following list of names was used for named storms that formed in the North Pacific Ocean east of 140°W in 1996. [40] This is the same list used for the 1990 season, [41] except for Winnie, which had been interchanged with Wallis. No names were retired following the season, and so it was used again for the 2002 season. [42] [43]

  • Iselle (unused)
  • Julio (unused)
  • Kenna (unused)
  • Lowell (unused)
  • Marie (unused)
  • Norbert (unused)
  • Odile (unused)
  • Polo (unused)
  • Rachel (unused)
  • Simon (unused)
  • Trudy (unused)
  • Vance (unused)
  • Winnie (unused)
  • Xavier (unused)
  • Yolanda (unused)
  • Zeke (unused)

For storms that form in the North Pacific from 140°W to the International Date Line, the names come from a series of four rotating lists. Names are used one after the other without regard to year, and when the bottom of one list is reached, the next named storm receives the name at the top of the next list. [40] [42] No named storms formed in or crossed into the area in 1996. [7]

Season effects

This is a table of all of the storms that formed in the 1996 Pacific hurricane season. It includes their name, duration (within the basin), peak classification and intensities, areas affected, damage, and death totals. Deaths in parentheses are additional and indirect (an example of an indirect death would be a traffic accident), but were still related to that storm. Damage and deaths include totals while the storm was extratropical, a wave, or a low, and all of the damage figures are in 1996 USD.

Saffir–Simpson scale
TDTSC1C2C3C4C5
1996 Pacific tropical cyclone season statistics
Storm
name
Dates activeStorm category
at peak intensity
Max 1-min
wind
mph (km/h)
Min.
press.
(mbar)
Areas affectedDamage
(USD)
DeathsRef(s)
UnnamedMay 13–16Tropical storm50 (85)1000NoneNoneNone
Two-EMay 15–19Tropical depression35 (55)1006NoneNoneNone
Alma June 20–27Category 2 hurricane105 (165)969Southwestern Mexico, Revillagigedo Islands Unknown20
Boris June 27 – July 1Category 1 hurricane90 (150)979Southwestern Mexico, Western MexicoNone10
Cristina July 1–3Tropical storm70 (110)991 Central America, Southwestern MexicoUnknown13
Six-EJuly 4–6Tropical depression35 (55)1003NoneNoneNone
Douglas July 29 – August 6Category 4 hurricane130 (215)946None (after crossover)NoneNone
Seventeen-WAugust 14–15Tropical depression35 (55)1000NoneNoneNone
Dolly August 24–25Tropical depression25 (35)1005None (after crossover)NoneNone
ElidaAugust 30 – September 6Tropical storm65 (100)994 Revillagigedo Islands, Baja California Peninsula NoneNone
Fausto September 10–14Category 3 hurricane120 (195)955 Baja California Peninsula, Revillagigedo Islands, Northwest Mexico$800,0000 (1)
One-CSeptember 15–20Tropical depression35 (55)1007 Hawaiian Islands NoneNone
GenevieveSeptember 27 – October 9Tropical storm50 (85)999NoneNoneNone
Hernan September 30 – October 4Category 1 hurricane85 (140)980Southwestern Mexico, Western Mexico, Texas Unknown1 (1)
Twelve-ENovember 7–11Tropical depression35 (55)1003NoneNoneNone
Season aggregates
15 systemsMay 13 – November 11 130 (215)946>$800,00044 (2) 

See also

Notes

  1. The total represents the sum of the squares of the maximum sustained wind speed (knots) for every (sub)tropical storm's intensity of over 33 knots (38 mph, 61 km/h), divided by 10,000 while they are above that threshold; therefore, tropical depressions are not included.

    Related Research Articles

    <span class="mw-page-title-main">1973 Atlantic hurricane season</span> Hurricane season in the Atlantic Ocean

    The 1973 Atlantic hurricane season was a below average tropical cyclone season overall. Of the 24 tropical or subtropical cyclones which developed, only 8 became named storms, and of those, only 4 became hurricanes, with 1 reaching major hurricane status on the newly implemented Saffir–Simpson hurricane wind scale. This continued the pattern of storm activity from the previous season, as hostile El Niño–Southern Oscillation (ENSO) conditions again hindered tropical cyclogenesis and intensification in the tropical Atlantic Ocean and Caribbean Sea.

    <span class="mw-page-title-main">1975 Atlantic hurricane season</span> Hurricane season in the Atlantic Ocean

    The 1975 Atlantic hurricane season was a near average hurricane season with nine named storms forming, of which six became hurricanes. Three of those six became major hurricanes, which are Category 3 or higher systems on the Saffir–Simpson scale. The season officially began on June 1 and lasted until November 30. These dates conventionally delimit the period of each year when most tropical cyclones form in the Atlantic Ocean.

    <span class="mw-page-title-main">1983 Atlantic hurricane season</span> Hurricane season in the Atlantic Ocean

    The 1983 Atlantic hurricane season was the least active Atlantic hurricane season since 1930. The season officially began on June 1, 1983, and lasted until November 30, 1983. These dates conventionally delimit the period of each year when most storms form in the Atlantic basin. The season had very little activity, with only seven tropical depressions, four of which reached tropical storm strength or higher. This led to the lowest accumulated cyclone energy count since 1977.

    <span class="mw-page-title-main">1939 Atlantic hurricane season</span> Hurricane season in the Atlantic Ocean

    The 1939 Atlantic hurricane season was the least active since 1930. The season had below normal activity, with only six tropical storms, of which three became hurricanes and one became a major hurricane, equivalent to Category 3 status or higher on the modern-day Saffir–Simpson scale. The first tropical cyclone formed on June 12, and the last dissipated on November 6. These dates are within the period of each year when most tropical cyclones form in the Atlantic basin.

    <span class="mw-page-title-main">1925 Atlantic hurricane season</span> Hurricane season in the Atlantic Ocean

    The 1925 Atlantic hurricane season was a below-average Atlantic hurricane season during which four tropical cyclones formed. Only one of them was a hurricane. The first storm developed on August 18, and the last dissipated on December 1. The season began at a late date, more than two months after the season began. The official start of the season is generally considered to be June 1 with the end being October 31; however, the final storm of the season formed nearly a month after the official end. Due to increased activity over the following decades, the official end of the hurricane season was shifted to November 30.

    <span class="mw-page-title-main">2002 Pacific hurricane season</span> Hurricane season in the Pacific Ocean

    The 2002 Pacific hurricane season was a near–average season which produced fifteen named storms. Eight hurricanes formed, including a record-equaling three Category 5 hurricanes, a record it shares with the 1994 and 2018 seasons. It was also a near-average season in terms of accumulated cyclone energy (ACE), having an ACE of 125. The season officially began on May 15, 2002 in the East Pacific Ocean, and on June 1, 2002 in the Central Pacific; both ended on November 30. These dates conventionally delimit the period of each year when most tropical cyclone formation occurs in these regions of the Pacific. The first system of the 2002 season, Hurricane Alma, formed on May 24, and the last, Tropical Depression Sixteen-E, dissipated on November 16.

    <span class="mw-page-title-main">1911 Atlantic hurricane season</span> Hurricane season in the Atlantic Ocean

    The 1911 Atlantic hurricane season was a relatively inactive hurricane season, with only six known tropical cyclones forming in the Atlantic during the summer and fall. There were three suspected tropical depressions, including one that began the season in February and one that ended the season when it dissipated in December. Three storms intensified into hurricanes, two of which attained Category 2 status on the modern-day Saffir–Simpson Hurricane Scale. Storm data is largely based on the Atlantic hurricane database, which underwent a thorough revision for the period between 1911 and 1914 in 2005.

    <span class="mw-page-title-main">1909 Atlantic hurricane season</span> Hurricane season in the Atlantic Ocean

    The 1909 Atlantic hurricane season was an average Atlantic hurricane season. The season produced thirteen tropical cyclones, twelve of which became tropical storms; six became hurricanes, and four of those strengthened into major hurricanes. The season's first storm developed on June 15 while the last storm transitioned into an extratropical cyclone on November 14. The most notable storm during the season formed in late August, while east of the Lesser Antilles. The hurricane devastated the Lesser Antilles, the Greater Antilles, and Mexico, leaving around 4,000 fatalities and more than $50 million (1909 USD) in damage.

    <span class="mw-page-title-main">1997 Pacific hurricane season</span> Hurricane season in the Pacific Ocean

    The 1997 Pacific hurricane season was a very active hurricane season. With hundreds of deaths and hundreds of millions of dollars in damage, this was one of the deadliest and costliest Pacific hurricane seasons on record. This was due to the exceptionally strong 1997–98 El Niño event. The season officially started on May 15, in the eastern Pacific, and on June 1, in the central Pacific, and lasted until November 30. These dates conventionally delimit the period of each year when almost all tropical cyclones form in the northeastern Pacific Ocean.

    <span class="mw-page-title-main">1990 Pacific hurricane season</span> Hurricane season in the Pacific Ocean

    The 1990 Pacific hurricane season was a very active season which observed 21 named storms within the basin. The season also produced the fourth highest ACE index value on record. The season was officially started on May 15 in the eastern Pacific, and on June 1 in the central Pacific, and lasted until November 30. These dates conventionally delimit the period of each year when most tropical cyclones form in the northeastern Pacific Ocean. However, the formation of tropical cyclones is possible at any time of the year, as illustrated in 1990 by the formation of the season's first named storm, Hurricane Alma, on May 12. At the time, this was the earliest formation of a tropical storm on record in the eastern Pacific

    <span class="mw-page-title-main">1974 Pacific hurricane season</span> Hurricane season in the Pacific Ocean

    The 1974 Pacific hurricane season featured one of the most active periods of tropical cyclones on record with five storms existing simultaneously. The season officially started May 15 in the eastern Pacific, and June 1 in the central Pacific, and lasted until November 30. These dates conventionally delimit the period of each year when most tropical cyclones form in the northeast Pacific Ocean.

    <span class="mw-page-title-main">1975 Pacific hurricane season</span> Hurricane season in the Pacific Ocean

    The 1975 Pacific hurricane season officially started May 15, 1975, in the eastern Pacific, and June 1, 1975, in the central Pacific, and lasted until November 30, 1975. These dates conventionally delimit the period of each year when most tropical cyclones form in the northeast Pacific Ocean.

    <span class="mw-page-title-main">2008 Pacific hurricane season</span> Hurricane season in the Pacific Ocean

    The 2008 Pacific hurricane season was a near-average Pacific hurricane season which featured seventeen named storms, though most were rather weak and short-lived. Only seven storms became hurricanes, of which two intensified into major hurricanes. This season was also the first since 1996 to have no cyclones cross into the central Pacific. The season officially began on May 15 in the eastern Pacific and on June 1 in the central Pacific. It ended in both regions on November 30. These dates, adopted by convention, historically describe the period in each year when most tropical cyclone formation occurs in these regions of the Pacific. This season, the first system, Tropical Storm Alma, formed on May 29, and the last, Tropical Storm Polo, dissipated on November 5.

    <span class="mw-page-title-main">Hurricane Emilia (1994)</span> Category 5 Pacific hurricane in 1994

    Hurricane Emilia was, at the time, the strongest tropical cyclone on record in the Central Pacific Ocean, and the second of such to be classified as a Category 5 hurricane – the highest rating on the Saffir–Simpson hurricane wind scale. However, hurricanes Gilma later that year, Ioke in 2006, and Walaka in 2018 later reached lower barometric pressures in the Central Pacific. In addition, Emilia was the first Category 5 Pacific hurricane since Hurricane Ava in 1973. The fifth named storm and the first of three Category 5 hurricanes of the 1994 hurricane season, Emilia developed from an area of low pressure southeast of Hawaii on July 16. Tracking westward, the initial tropical depression intensified into a tropical storm several hours after tropical cyclogenesis. Subsequently, Emilia entered the Central Pacific Ocean and moved into the area of responsibility of the Central Pacific Hurricane Center (CPHC).

    <span class="mw-page-title-main">Tropical Storm Kiko (2007)</span> Pacific tropical cyclone

    Tropical Storm Kiko was a strong tropical storm that capsized a boat off the western coast of Mexico, killing at least 15 people. The 15th and final tropical cyclone of the 2007 Pacific hurricane season, Kiko developed out of a tropical wave that formed off the coast of Africa on September 26 and traversed the Atlantic. The wave crossed over Central America and entered the Pacific Ocean on October 8, where it spawned Tropical Depression 15-E on October 15. The depression drifted to the south over the next day before briefly being declared Tropical Storm Kiko. It subsequently weakened into a tropical depression, but later reattained tropical storm intensity. By October 18, Kiko was forecast to make landfall along the western Mexican coastline as a moderate tropical storm. However, the cyclone turned to the west and reached its peak intensity of 70 mph (110 km/h) on October 20. The tropical storm slowly weakened to a remnant low-pressure area by October 24 and completely dissipated on October 27 without making landfall.

    <span class="mw-page-title-main">Hurricane Boris (1996)</span> Category 1 Pacific hurricane in 1996

    Hurricane Boris was the second of three storms to impact the Pacific coast of Mexico in June and July 1996. The fourth tropical cyclone and second hurricane of the 1996 Pacific hurricane season, Boris formed out of a tropical wave roughly 250 mi (400 km) south of the Gulf of Tehuantepec on June 27. The storm gradually intensified, becoming a tropical storm the following day and then hurricane on June 29. As the storm neared landfall, an eye developed and Boris reached its peak intensity with winds of 90 mph (140 km/h). Shortly after, the hurricane made landfall along the south coast of Mexico, between Lázaro Cárdenas and Acapulco, at this intensity. Boris quickly weakened following its landfall, becoming a tropical depression roughly 18 hours later. The remnants of the system persisted until July 1, at which time it dissipated just offshore the Mexican coastline. Boris caused heavy flooding in southern Mexico that resulted in ten fatalities; however, a damage estimate is unknown.

    <span class="mw-page-title-main">Hurricane Hernan (1996)</span> Category 1 Pacific hurricane in 1996

    Hurricane Hernan was fourth and final tropical cyclone to strike Mexico at hurricane intensity during the 1996 Pacific hurricane season. The thirteenth tropical cyclone, eighth named storm, and fifth hurricane of the season, Hernan developed as a tropical depression from a tropical wave to the south of Mexico on September 30. The depression quickly strengthened, and became Tropical Storm Hernan later that day. Hernan curved north-northwestward the following day, before eventually turning north-northeastward. Still offshore of the Mexican coast on October 2, Hernan intensified into a hurricane. Six hours later, Hernan attained its peak as an 85 mph (140 km/h) Category 1 hurricane on the Saffir-Simpson Hurricane Wind Scale (SSHWS). After weakening somewhat, on 1000 UTC October 3, Hurricane Hernan made landfall near Barra de Navidad, Jalisco, with winds of 75 mph (120 km/h). Only two hours after landfall, Hernan weakened to a tropical storm. By October 4, Tropical Storm Hernan had weakened into a tropical depression, and dissipated over Nayarit on the following day.

    <span class="mw-page-title-main">1978–79 Australian region cyclone season</span>

    The 1978–79 Australian region cyclone season was the only season in which a reconnaissance aircraft flew into a tropical cyclone. Operationally, Australia's Bureau of Meteorology (BOM) tracked eleven tropical cyclones, while two additional systems were later added to the United States's Joint Typhoon Warning Center (JTWC) best track. Prior to 1985, the Australian region basin was defined as in the southern hemisphere between 80°E and 160°E, with the modern day season boundaries ranging from 1 November to 30 April of the following year. The first storm, an unnamed system, developed on 19 November 1978. The final cyclone, Kevin, dissipated by 12 May 1979. Tropical cyclones in this area were monitored by three Tropical Cyclone Warning Centres (TCWCs): the BOM in Perth, Darwin, and Brisbane.

    <span class="mw-page-title-main">2020 Atlantic hurricane season</span> Hurricane season in the Atlantic Ocean

    The 2020 Atlantic hurricane season was the most active Atlantic hurricane season on record, in terms of number of systems. It featured a total of 31 tropical or subtropical cyclones, with all but one cyclone becoming a named storm. Of the 30 named storms, 14 developed into hurricanes, and a record-tying seven further intensified into major hurricanes. It was the second and final season to use the Greek letter storm naming system, the first being 2005, the previous record. Of the 30 named storms, 11 of them made landfall in the contiguous United States, breaking the record of nine set in 1916. During the season, 27 tropical storms established a new record for earliest formation date by storm number. This season also featured a record ten tropical cyclones that underwent rapid intensification, tying it with 1995, as well as tying the record for most Category 4 hurricanes in a singular season in the Atlantic Basin. This unprecedented activity was fueled by a La Niña that developed in the summer months of 2020, continuing a stretch of above-average seasonal activity that began in 2016. Despite the record-high activity, this was the first season since 2015 in which no Category 5 hurricanes formed.

    <span class="mw-page-title-main">Meteorological history of Hurricane Patricia</span>

    Hurricane Patricia was the most intense tropical cyclone ever recorded in the Western Hemisphere and the second-most intense worldwide in terms of barometric pressure. It also featured the highest one-minute maximum sustained winds ever recorded in a tropical cyclone. Originating from a sprawling disturbance near the Gulf of Tehuantepec in mid-October 2015, Patricia was first classified a tropical depression on October 20. Initial development was slow, with only modest strengthening within the first day of its classification. The system later became a tropical storm and was named Patricia, the twenty-fourth named storm of the annual hurricane season. Exceptionally favorable environmental conditions fueled explosive intensification on October 22. A well-defined eye developed within an intense central dense overcast and Patricia grew from a tropical storm to a Category 5 hurricane in just 24 hours—a near-record pace. The magnitude of intensification was poorly forecast and both forecast models and meteorologists suffered from record-high prediction errors.

    References

    1. Dorst Neal. "When is hurricane season?". Atlantic Oceanographic and Meteorological Laboratory. Archived from the original on 6 December 2010. Retrieved November 25, 2010.
    2. "Basin Archives: Northeast Pacific Ocean Historical Tropical Cyclone Statistics". Fort Collins, Colorado: Colorado State University. Retrieved July 8, 2022.
    3. Neal Dorst (June 2, 2016). "TCFAQ G1) When is hurricane season?". Atlantic Oceanographic and Meteorological Laboratory. Archived from the original on 2009-05-06. Retrieved July 24, 2018.
    4. National Hurricane Center (1996). "The 1996 East Pacific Hurricane Season" . Retrieved 2007-02-23.
    5. 1 2 3 4 5 6 7 Lixion Avila (1996-10-24). "Hurricane Douglas". National Hurricane Center . Retrieved 2007-02-23.
    6. 1 2 3 Central Pacific Hurricane Center. "Previous Tropical Systems of the Central Pacific". Archived from the original on 23 February 2007. Retrieved 2007-02-23.
    7. 1 2 3 4 The 1996 Central Pacific Tropical Cyclone Season (PDF) (Report). Central Pacific Hurricane Center . Retrieved 2019-06-09.
    8. "bwp221996" (TXT). Joint Typhoon Warning Center. 1996. Retrieved November 29, 2015.
    9. 1 2 3 4 5 6 7 Max Mayfield (1996-08-11). "Tropical Storm Cristina". National Hurricane Center . Retrieved 2007-02-08.
    10. Blake, Eric S; Gibney, Ethan J; Brown, Daniel P; Mainelli, Michelle; Franklin, James L; Kimberlain, Todd B; Hammer, Gregory R (2009). Tropical Cyclones of the Eastern North Pacific Basin, 1949-2006 (PDF). Archived from the original on July 28, 2013. Retrieved June 14, 2013.
    11. "Basin Archives: Northeast Pacific Ocean Historical Tropical Cyclone Statistics". Fort Collins, Colorado: Colorado State University. Retrieved July 8, 2022.
    12. 1 2 3 4 Rappaport, Edward N; National Hurricane Center (November 7, 1996). Unnamed Tropical Storm, (formerly Tropical Depression One-E): May 13 - 16 1996 (PDF) (Tropical Cyclone Report). United States National Oceanic and Atmospheric Administration's National Weather Service. Archived from the original on October 5, 2013. Retrieved August 5, 2013.
    13. Gary Padgett. "Monthly Global Tropical Cyclone Summary May 2006". Archived from the original on 29 March 2007. Retrieved 2007-02-17.
    14. Edward Rappaport (1996-05-13). "Tropical Depression One-E Discuission Number 1". National Hurricane Center . Retrieved 2007-02-17.
    15. 1 2 Richard Pasch (1996-06-05). "Brief Information about Tropical Depression Two-E" . Retrieved 2006-02-23.
    16. 1 2 Lixion Avila (1996-07-24). "Hurricane Alma". National Hurricane Center . Retrieved 2007-02-17.
    17. 1 2 3 4 5 Miles Lawrence (1996-08-15). "Hurricane Boris". National Hurricane Center. Archived from the original on 20 August 2007. Retrieved 2007-08-18.
    18. David Roth (2007). "Hurricane Boris — June 26-July 1, 1996". Hydrometeorological Prediction Center. Retrieved 2007-02-15.
    19. National Hurricane Center; Hurricane Research Division; Central Pacific Hurricane Center (April 4, 2023). "The Northeast and North Central Pacific hurricane database 1949–2022". United States National Oceanic and Atmospheric Administration's National Weather Service. A guide on how to read the database is available here. PD-icon.svg This article incorporates text from this source, which is in the public domain.
    20. Max Mayfield (1996-07-04). "Tropical Depression Six-E Discussion Number 1". National Hurricane Center . Retrieved 2007-03-02.
    21. Max Mayfield (1996-07-05). "Tropical Depression Six-E Discussion Number 2". National Hurricane Center . Retrieved 2007-03-02.
    22. Jerry Jarrell (1996-07-05). "Tropical Depression Six-E Discussion Number 3". National Hurricane Center . Retrieved 2007-03-02.
    23. Lixion Avila (1996-07-05). "Tropical Depression Six-E Discussion Number 5". National Hurricane Center . Retrieved 2007-03-02.
    24. 1 2 Richard Pasch. "Tropical Depression Six-E Preliminary Report". National Hurricane Center . Retrieved 2007-03-02.
    25. "Hurricane Douglas leaves at least 35 dead as it crosses from Caribbean to Pacific". ReliefWeb. Associated Press. 1996-07-30. Archived from the original on 2007-09-27. Retrieved 2007-02-23.
    26. Joint Typhoon Warning Center. "Tropical Depression Seventeen-W ATCR" (PDF). Archived from the original (PDF) on 2011-06-07. Retrieved 2007-10-05.
    27. Edward N. Rappaport (October 3, 1996). Preliminary Report: Hurricane Dolly (PDF). National Hurricane Center (Report). Miami, Florida: National Oceanic and Atmospheric Administration . Retrieved June 25, 2016.
    28. 1 2 3 4 Edward Rappaport (1996-07-11). "Tropical Storm Elida Preliminary Report". National Hurricane Center . Retrieved 2007-02-23.
    29. David M. Roth (2009-05-10). "Tropical Storm Elida — August 30-September 7, 1996". Hydrometeorological Prediction Center. Archived from the original on 19 May 2011. Retrieved 2011-06-01.
    30. "Hurricane Marty". Centre for Research on the Epidemiology of Disasters. Archived from the original on 2010-09-23. Retrieved 2011-07-10.
    31. 1 2 3 4 5 6 Miles Lawrence (1996-10-12). "Hurricane Fausto". National Hurricane Center . Retrieved 2007-01-25.
    32. "Hurricane Fausto". Hydrometeorological Prediction Center . Retrieved 2007-01-26.
    33. "CICESE — La Paz: de proyecto a realidad en expansión". Departamento de Comunicación para el Centro de Investigación Científica y de Educación Superior de Ensenada. Archived from the original on 2011-07-22. Retrieved 2007-02-23.
    34. 1 2 3 4 5 6 Max Mayfield (1996-11-14). "Tropical Storm Genevieve". National Hurricane Center . Retrieved 2007-02-25.
    35. 1 2 3 4 5 Richard J. Pasch (1997-01-17). "Hurricane Hernan". National Hurricane Center. Archived from the original on 2007-06-19. Retrieved 2007-03-01.
    36. Richard Pasch (1996-11-07). "Tropical Depression Twelve-E Special Discussion Number 1". National Hurricane Center . Retrieved 2007-03-02.
    37. Max Mayfield (1996-11-07). "Tropical Depression Twelve-E Discussion Number 3". National Hurricane Center . Retrieved 2007-03-02.
    38. Miles Lawrence (1996-11-10). "Tropical Depression Twelve-E Discussion Number 14". National Hurricane Center . Retrieved 2007-03-02.
    39. Edward Rappaport (1996-11-13). "Tropical Depression 12-E". National Hurricane Center . Retrieved 2007-03-02.
    40. 1 2 National Hurricane Operations Plan (PDF) (Report). Washington, D.C.: NOAA Office of the Federal Coordinator for Meteorological Services and Supporting Research. May 1996. pp. 3-8–9. Retrieved February 1, 2024.
    41. National Hurricane Operations Plan (PDF) (Report). Washington, D.C.: NOAA Office of the Federal Coordinator for Meteorological Services and Supporting Research. May 1990. p. 3-7. Retrieved February 1, 2024.
    42. 1 2 "Tropical Cyclone Names". Miami, Florida: National Hurricane Center. July 23, 2002. Archived from the original on October 1, 2002. Retrieved February 1, 2024.
    43. Padgett, Gary (February 2002). "Monthly Global Tropical Cyclone Summary". Archived from the original on September 27, 2007. Retrieved March 4, 2024.