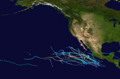
The 1990 Pacific hurricane season was a very active season which observed 21 named storms within the basin. The season also produced the fourth highest ACE index value on record. The season was officially started on May 15 in the eastern Pacific, and on June 1 in the central Pacific, and lasted until November 30. These dates conventionally delimit the period of each year when most tropical cyclones form in the northeastern Pacific Ocean. However, the formation of tropical cyclones is possible at any time of the year, as illustrated in 1990 by the formation of the season's first named storm, Hurricane Alma, on May12. At the time, this was the earliest formation of a tropical storm on record in the eastern Pacific.
Overall, the impact of this season was minimal. Tropical Storm Rachel made two landfalls in Mexico and brought rain to the United States. Hurricane Boris brought light showers to California.[1]
The 1990 eastern North Pacific hurricane season was active in terms of number of storms that attained at least tropical storm intensity and of Accumulated Cyclone Energy (ACE). All of the tropical cyclones of this year developed from westward-moving African tropical waves. The season established several tropical storm records for this basin and was marked by several strong hurricanes. There were 21named tropical cyclones, seven below the record established by the 1992 Pacific hurricane season two years later, but four more than the long-term average. Sixteen of those named storms, twice the average and four more than the previous record, reached hurricane intensity. Only Cristina, Douglas, Aka, Rachel, and Simon did not reach hurricane strength. Six of those hurricanes reached Category3 intensity or higher on the Saffir-Simpson Hurricane Scale. Hurricanes Hernan and Trudy were among the strongest ever observed in this area. Alma became the earliest named storm and hurricane in the satellite era in the eastern Pacific Ocean east of the 140th meridian west at the time; a record subsequently eclipsed by Adrian in 2017.[3][4] The eastern Pacific produced four tropical depressions that did not reach tropical storm status.[5]
With the exception of Marie and Polo, these systems developed between 5° and 15°N, east of the longitude of Baja California Peninsula in the climatologically favored area for tropical cyclogenesis in the basin. After their development, most of the tropical cyclones moved on a west to northwest track and dissipated over cool waters without affecting land. Rachel was the only system to make landfall. In addition, one tropical storm formed in the Central Pacific and eventually crossed the International Dateline before dissipating.[1]
The Accumulated Cyclone Energy (ACE) index for the 1990 Pacific hurricane season (Eastern Pacific and Central Pacific combined) as calculated by Colorado State University using data from the National Hurricane Center was 249.5units, the fourth highest ACE on record for a Pacific hurricane season.[nb 1][6]
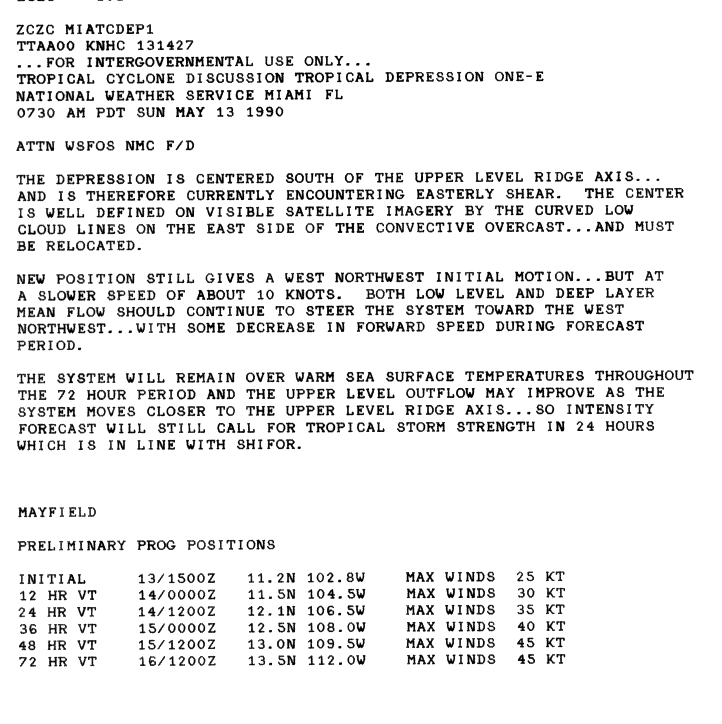
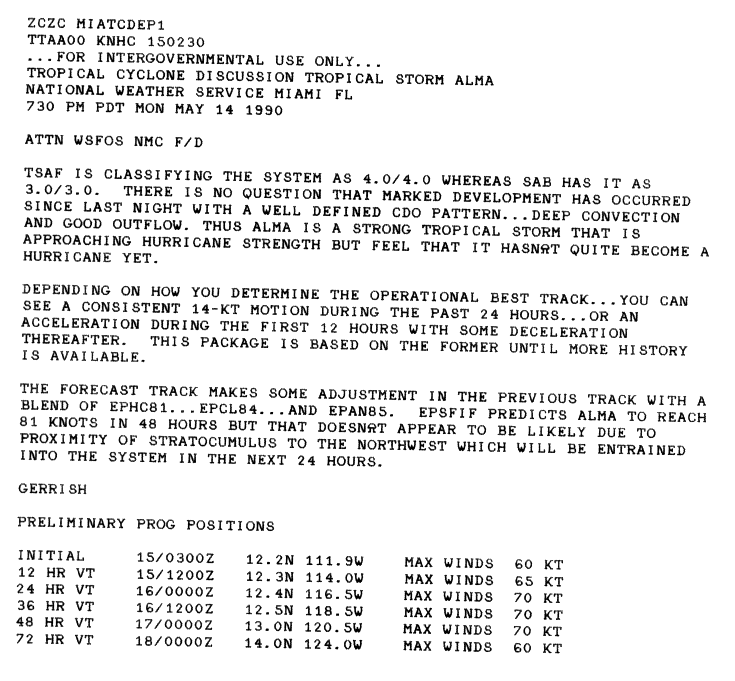
A tropical wave emerged from Africa on April 29. It then moved across the Atlantic, crossed northern South America, and entered the Pacific Ocean on May 9. Convection started to increase with the wave just to the south of Panama. The wave moved westward and continued to become better organized over the next few days. On May 12, the wave had become organized enough and was designated Tropical Depression One-E.[3]
Tropical Depression One-E moved slowly to the northwest while strengthening slowly due to easterly vertical wind shear. The depression was upgraded to Tropical Storm Alma on May 14. The storm quickly strengthened once the vertical wind shear relaxed and was near hurricane force by the morning of May 15. Hurricane Alma reached its peak intensity early on May 16 with maximum sustained winds of 85mph (137km/h). The hurricane entered an area of southwesterly wind shear caused by an upper-level ridge of high pressure. The increasing vertical wind shear and cooler water caused Alma to weaken to a tropical storm. On May 17, the storm continued to weaken and became a depression. The next day, the system dissipated as a tropical cyclone well west of mainland Mexico.[3][7][8]
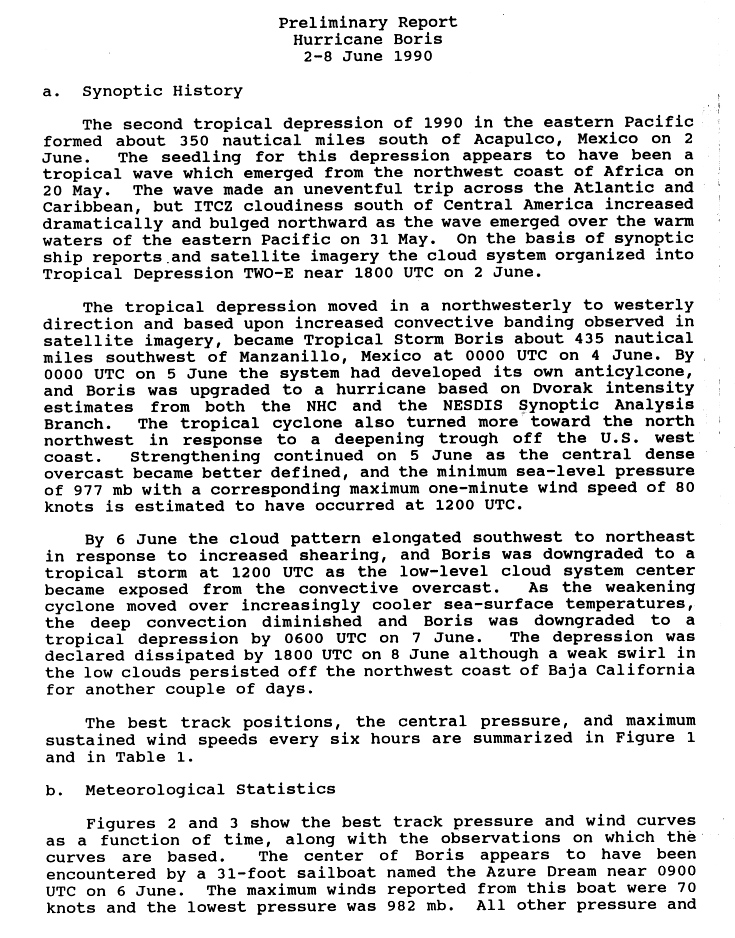
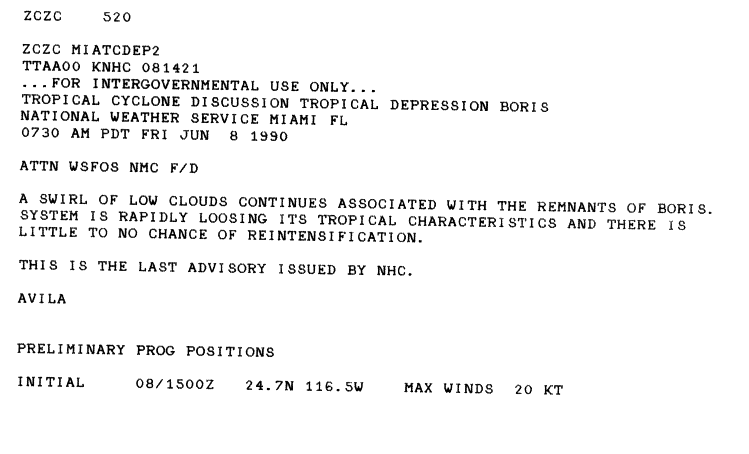
A tropical wave came off the northwest coast of Africa on May 20. The wave did not significantly develop as it moved west across the Atlantic Ocean and Caribbean Sea. Once it crossed Central America into the eastern Pacific Ocean, cloudiness increased considerably with the system on May 31.[9] It became well-enough organized to be upgraded to Tropical Depression Two-E on June 2. After becoming a depression, the system moved to the west-northwestward. Upper-level easterly vertical wind shear limited the amount of the initial strengthening. However, an increase in convective banding led to its upgrade to Tropical Storm Boris on June 4, 500mi (800km) southwest of Manzanillo. Further strengthening occurred due to an anticyclone aloft fostered additional development, and by June 5, Boris became a hurricane. The hurricane began to move to the north-northwest in response to a trough off of the West Coast of the United States. Strengthening continued, and the storm reached its peak strength with winds of 90mph (140km/h) and a minimum central pressure of 977mb (28.9inHg). The hurricane's cloud pattern became elongated along a southwest–northeast axis on June 6 due to an increased amount of vertical wind shear. Boris was downgraded to a tropical storm later in the day on June 6. The deep convection of the tropical storm decreased, as Boris moved over cooler waters. It was downgraded to a tropical depression on June 7 due to these factors. The depression dissipated as a tropical cyclone on June 8 as the system quickly lost its tropical characteristics. A small circulation remained in the cloud field offshore the northwest coast of Baja California for a few more days.[9][10]
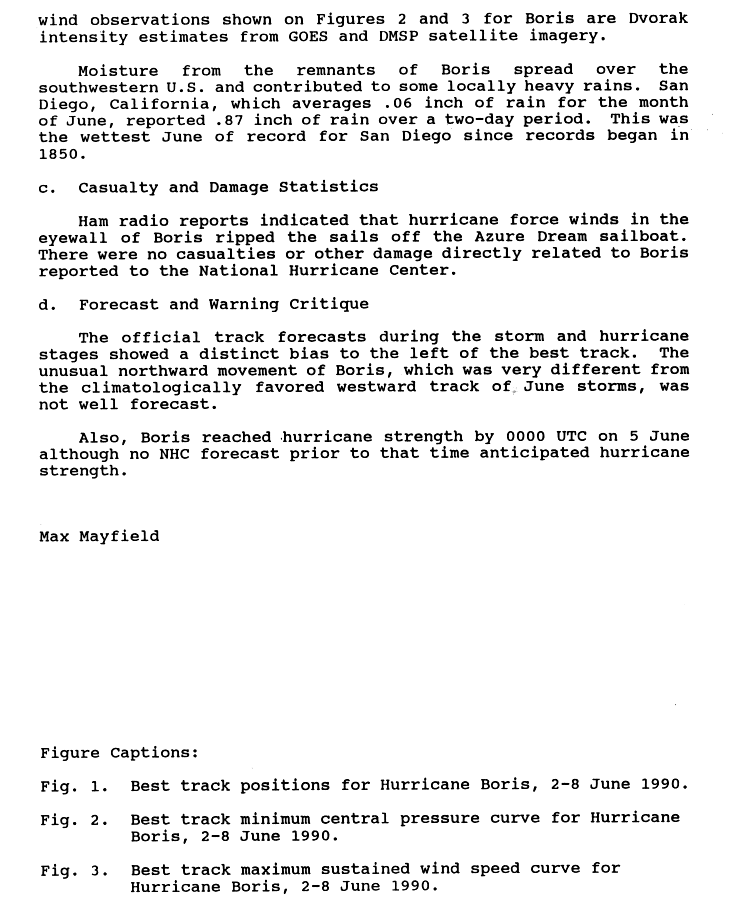
The winds in the eyewall of Boris ripped off the sails of the Azure Dream sailboat. Outer rainbands from the storm produced moderate rain in several Mexican states. In Mexico, rainfall peaked at 8.83in (224mm) near San Lucas, Michoacán. The remnants of Boris also brought sporadic rainfall over the western United States, with precipitation being reported in Arizona, California, Colorado, Nevada and Wyoming. The remnants of Boris were responsible for causing the wettest June in San Diego since records began in 1850; however, not even 1in (25mm) of rain fell at that location. Rainfall from the remnant system in the United States peaked at 3.28in (83mm) over the Santa Rita Mountains.[11][12] No other direct damages or casualties were reported from Boris.[9][11][13]
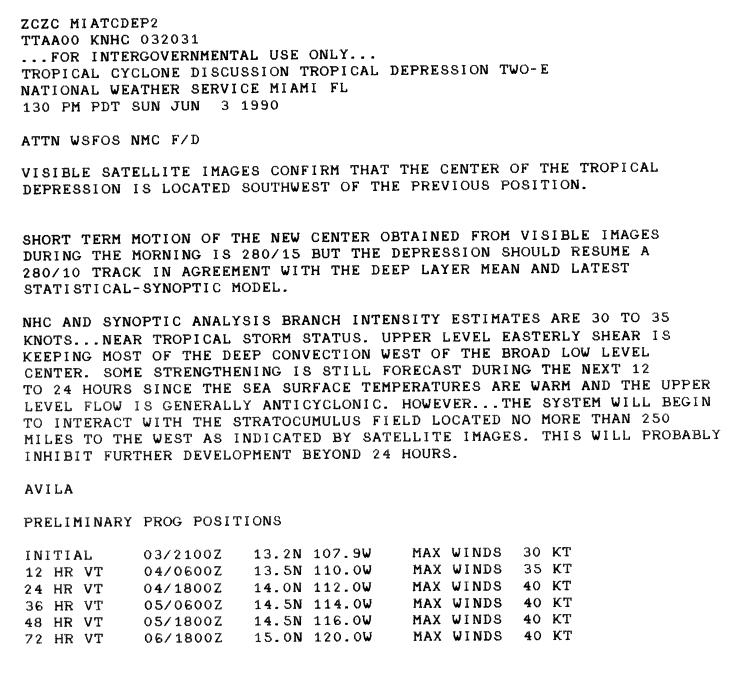
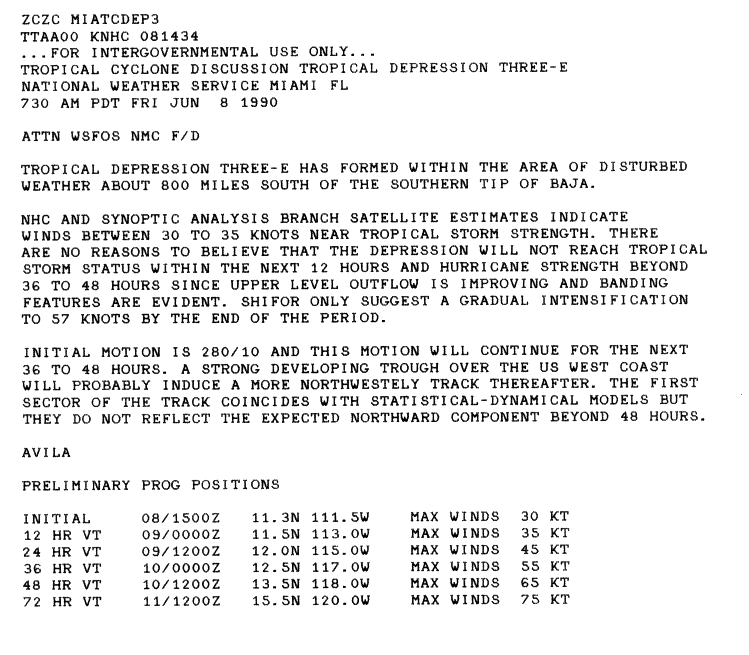
A tropical wave emerged into the Atlantic Ocean off the coast of Africa on May 28. The wave moved across Central America into the northeastern Pacific Ocean, where convection organized with the system on June 6. The system became well-enough organized to be upgraded to Tropical Depression Three-E on June 8, while 920mi (1,480km) south of the southern tip of Baja California. The depression continued to strengthen, and was upgraded to Tropical Storm Cristina on June 9.[14][15]
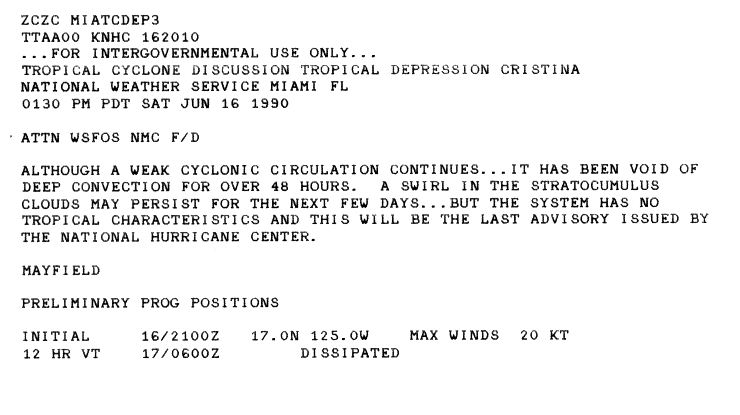
Cristina initially had well-established upper-level outflow. It failed to reach hurricane status, peaking with maximum sustained winds of 65mph (105km/h) due to movement of its associated upper-level anticyclone to the north over Mexico which caused Cristina to be exposed to easterly vertical wind shear. Cristina moved generally northwestward, which eventually placed the storm in cooler waters, and caused the deep convection of the system to dissipate. On June 14, Cristina diminished to a tropical depression. Cristina moved west-northwestward with the low-level flow. The depression dissipated as a tropical cyclone on June 16, after a lack of deep convection for 48hours.[14][16]
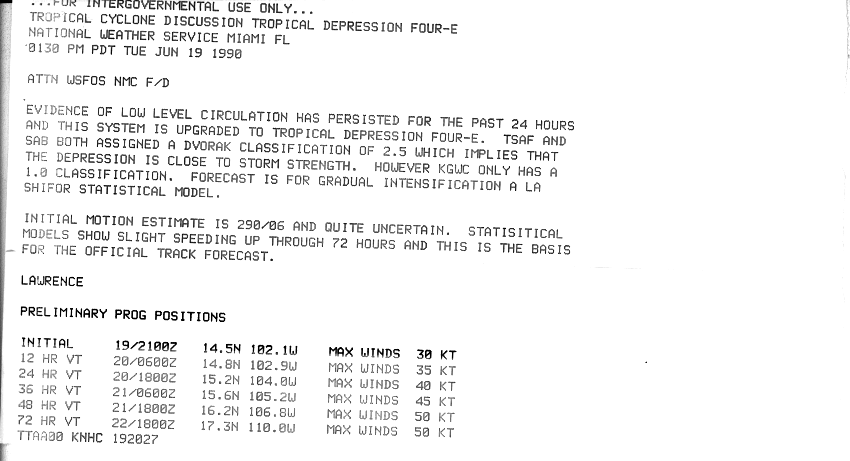
A tropical wave moved off the northwest coast of Africa on June 5. It continued westward across the tropical North Atlantic and Caribbean Sea without significant development.[17] The wave entered the northeastern Pacific Ocean on June 16, where it generated an area of increased cloudiness. Organization of thunderstorm activity increased late on June 18 and early on June 19. Tropical Depression Four-E formed on June 19, when it was 230mi (370km) south of Acapulco after evidence of low-level circulation for the past 24hours.[18] The depression moved in a west-northwest direction, due to a subtropical ridge north of the depression. Satellite analysis indicated that the depression had reached tropical storm force strength, and it was upgraded to Tropical Storm Douglas on June 19, while 230mi (370km) southwest of Acapulco. Douglas reached peak strength of 65mph (105km/h) on June 21[17]
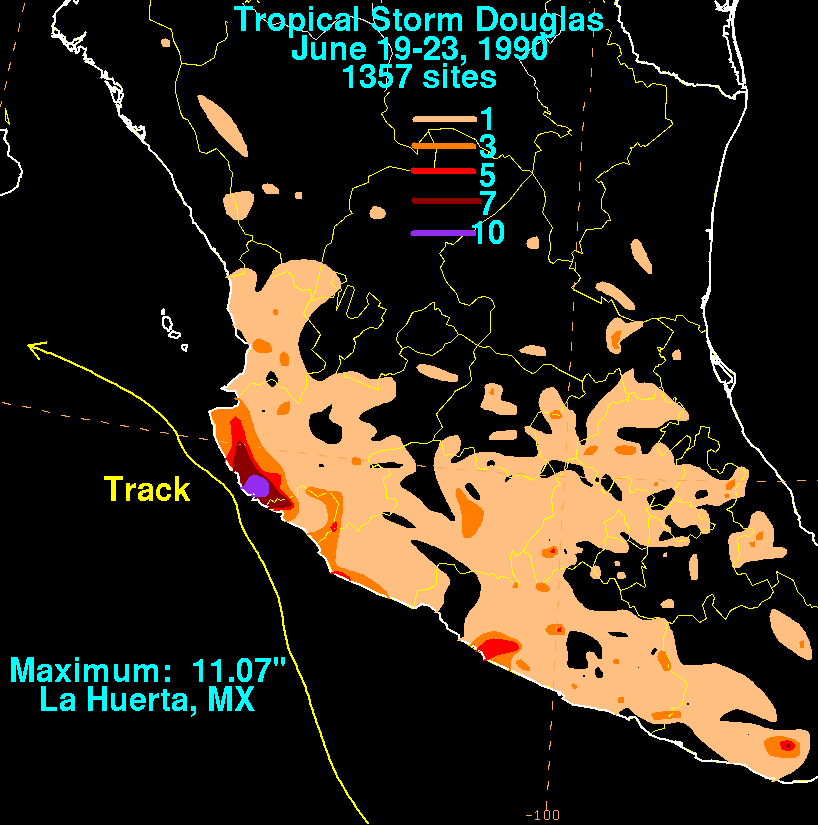
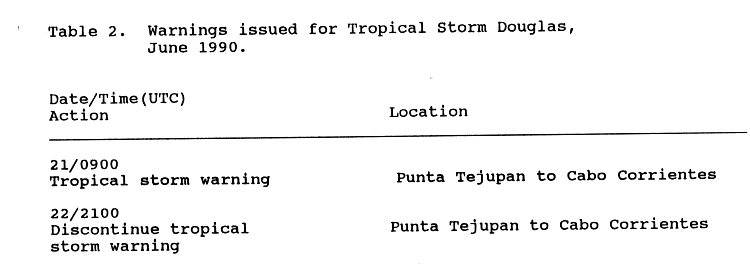
A tropical storm warning was issued on June 21, from Punta Tejupan to Cabo Corrientes before being discontinued on June 22. Tropical Storm Douglas brushed the western coast of Mexico. The center of circulation approached within 17mi (27km) of the coast of Mexico on June 22. Douglas then began to weaken because of interaction with the mountainous terrain of Mexico. The system continued to weaken despite warm water temperatures and favorable upper-level conditions. Douglas dissipated early on June 24, while 138mi (222km) south-southeast off the southern tip of Baja California Sur. The highest rainfall report from Mexico from Douglas totaled 11.07in (281mm) at La Huerta.[19] No deaths or damage were reported.[17][20]
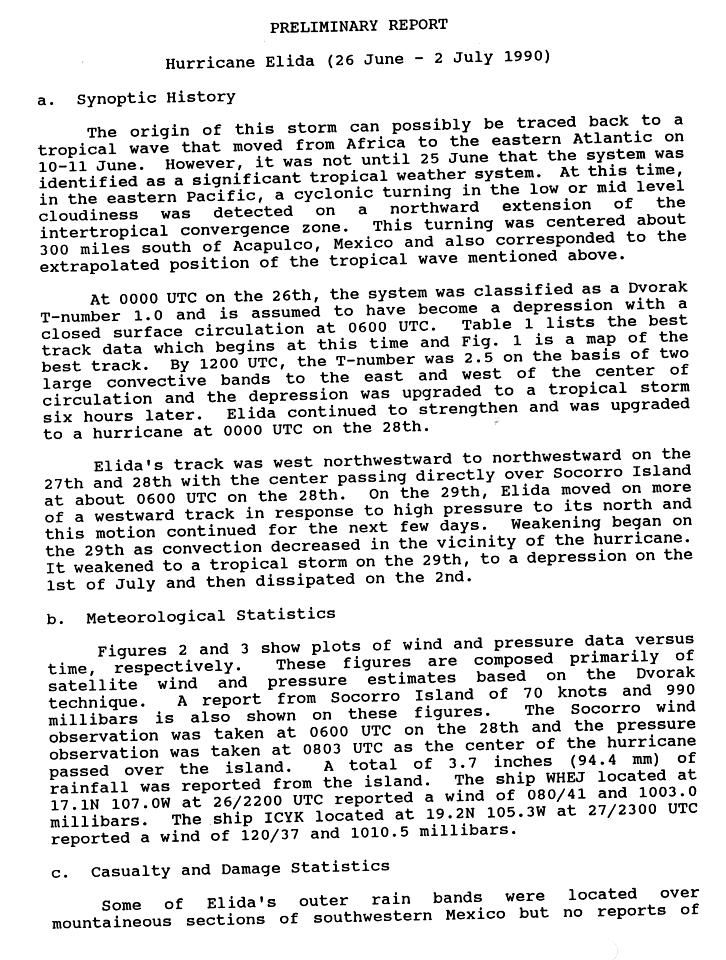
A tropical wave came off the coast of Africa into the eastern Atlantic Ocean on June 10 and 11. The system moved across the Atlantic and entered into the northeastern Pacific Ocean.[21] The wave became a significant tropical system, with cyclonic turning in the lower and middle layers of the system's cloudiness on June 25. The center of circulation was located 345mi (555km) south of Acapulco, Mexico. The system exhibited sufficient organization to be considered Tropical Depression Five-E on June 26. The depression quickly strengthened and became Tropical Storm Elida later that day. The track of Elida was west-northwestward to northwestward from June 27 through June 28. Some rainbands moved over the mountainous region of southwestern Mexico, but no flooding, damage, or casualties were reported as a result. Elida continued strengthening and it was upgraded to a hurricane early on June 28 passing directly over Socorro Island later in the day, right as Elida reached peak strength of 80mph (130km/h), dropping 3.7in (94mm) of rain on the island. Some windows broke also as a result, and minor structural damage was reported as a result on the island.[21][22]
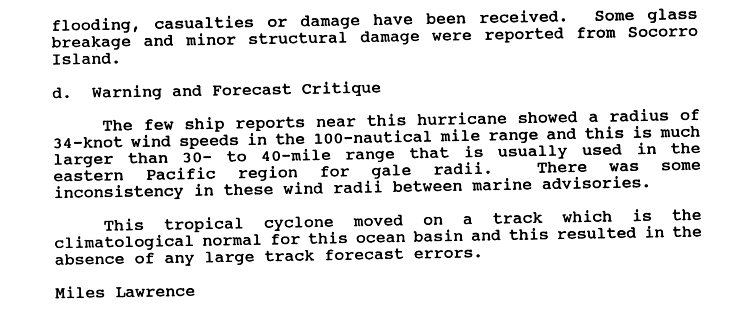
A high-pressure area to the north forced Elida to move more westward on June 29. Convection began to decrease in the hurricane as it moved into cooler waters, and it weakened to a tropical storm later in the day. It then weakened to a tropical depression on July 1, and dissipated on July 2.[21][23]
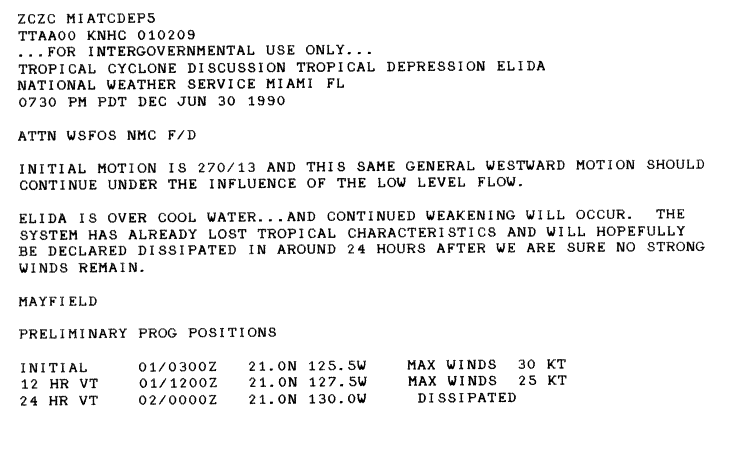
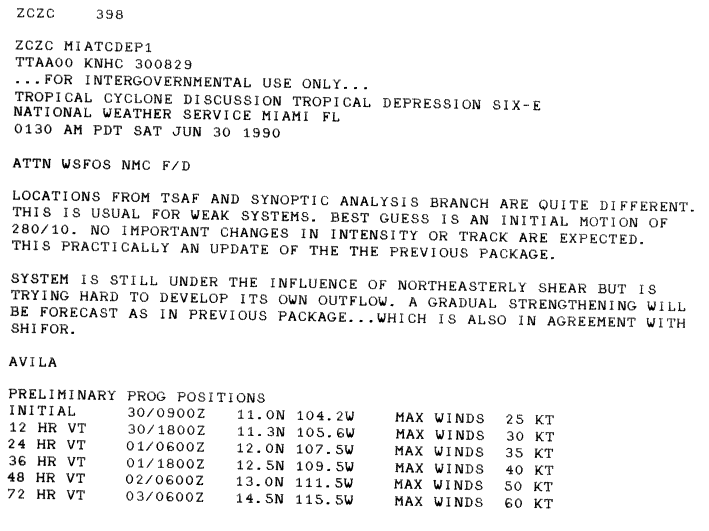
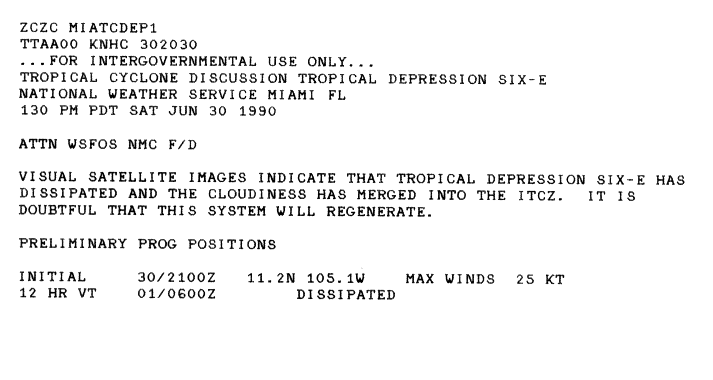
An area of disturbed weather south of Acapulco organized into Tropical Depression Six-E on June 29 and the system began to move northwest. Originally the system was expected to reach tropical storm strength and near hurricane intensity by late on July 2 or early on July 3,[24] however persistent vertical wind shear over the system impeded its development.[25] After convection began to merge into the Intertropical Convergence Zone (ITCZ), the National Hurricane Center discontinued advisories on Tropical Depression Six-E, stating that the depression dissipated, and regeneration seemed unlikely.[26]
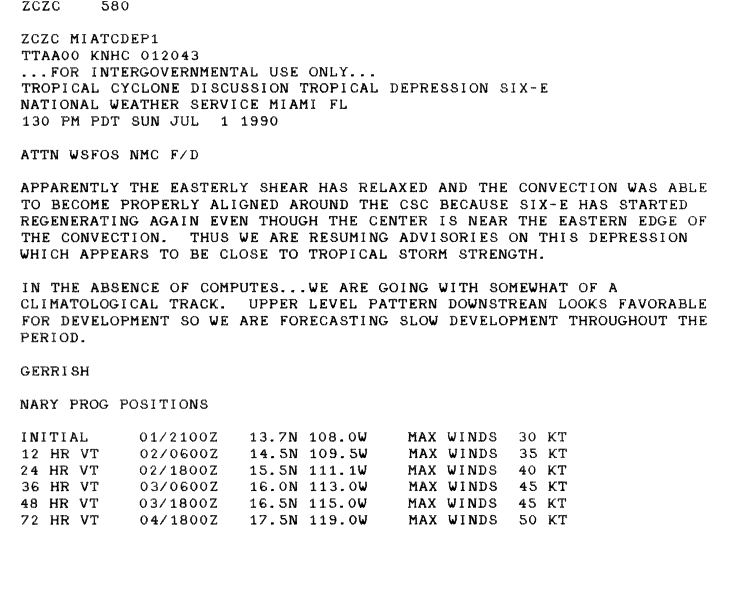
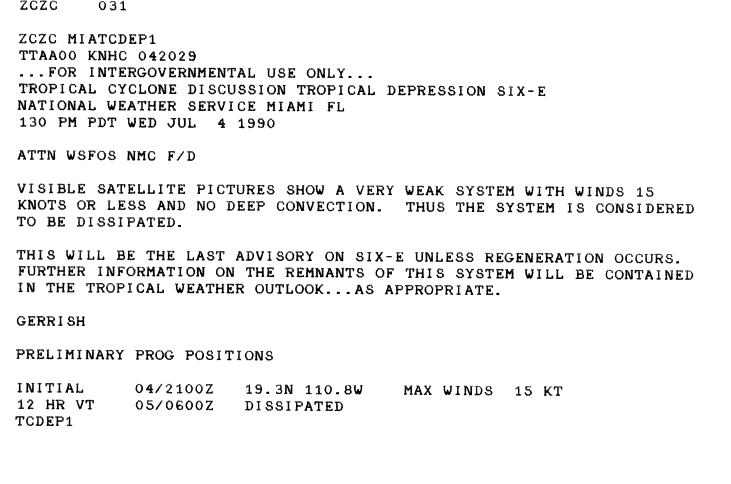
However, wind shear began to decrease, and convection associated with the remnants of Tropical Depression Six-E quickly began to increase. Although the low-level circulation was near the edge of the deep convection, the National Hurricane Center resumed advisories on Tropical Depression Six-E by July 1. Intensification into a tropical storm was again predicted,[27] but Tropical Depression Six-E remained poorly defined, and eventually dissipated on July 4.[28]
A tropical wave came off the northwest coast of Africa on June 19. The wave crossed the Atlantic Ocean and Caribbean Sea, into the warm waters of the northeastern Pacific Ocean, on July 2. An area of disturbed weather moved northwards towards the Gulf of Tehuantepec and became Tropical Depression Seven-E early on July 6. The depression moved northwest, and because of increased organization of deep convection, was designated Tropical Storm Fausto on July 7, 265mi (426km) south of Manzanillo, Mexico. A weakly defined eye formed on July 8, and the storm was upgraded to Hurricane Fausto, 310mi (500km) south of Cabo San Lucas.[29]
Fausto peaked in strength with winds of 85mph (137km/h) and a central pressure of 979mb (28.9inHg) on July 9. Fausto passed 40mi (64km) north of Socorro Island causing a northwest wind of 40mph (64km/h), and 4.3in (110mm) of rain at that location. The hurricane fluctuated in intensity on July 10,[29][30] before weakening into a tropical storm later that day, 403mi (649km) west of Cabo San Lucas. The weakening Fausto moved over continuing cooler waters, and was downgraded to a tropical depression on July 11, 690mi (1,110km) west of Cabo San Lucas. The depression dissipated as a tropical cyclone on July 13, and its low level circulation of clouds persisted for a few days.[29]
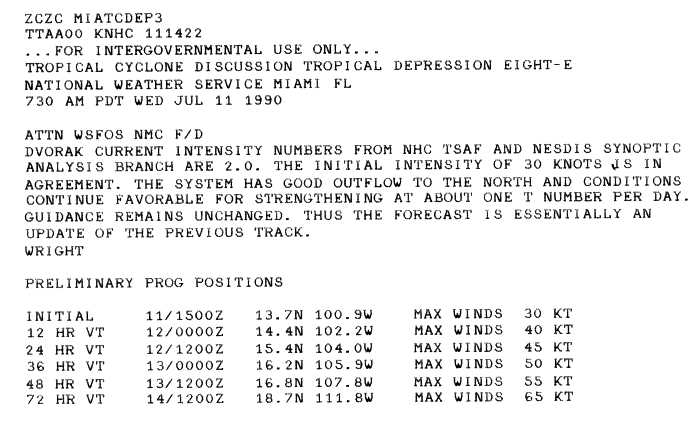
A tropical wave moved off the coast of Africa on June 25 and moved across the Atlantic Ocean and central Caribbean Sea with little development. Within the western Caribbean Sea, convection developed with the wave on July 7. The system became better organized as it moved into the northeastern Pacific Ocean. The system was upgraded to Tropical Depression Eight-E on July 11. The depression moved west-northwest, with a good outflow to the north, and gradually strengthened into Tropical Storm Genevieve later that day. Genevieve continued to strengthen, reaching hurricane strength on July 13.[31] The storm approached within 23mi (37km) of Socorro Island where a sustained wind of 44mph (71km/h) and gust of 50mph (80km/h) were reported, before the weather equipment on the island failed.[32]
The hurricane began to turn west because of the strengthening and growing ridge to its north. Increasing outflow aloft began to form, and the hurricane reached its peak strength of 105mph (169km/h) with a well-defined eye at its center of circulation.[31][33] Genevieve turned northwest on July 16 into an area with strong vertical wind shear and low water temperatures. The hurricane quickly weakened into a tropical storm on July 17 and then into a tropical depression on July 18. Genevieve dissipated as a tropical cyclone later in the day, reduced to a circulation in the stratocumulus cloud field.[31]
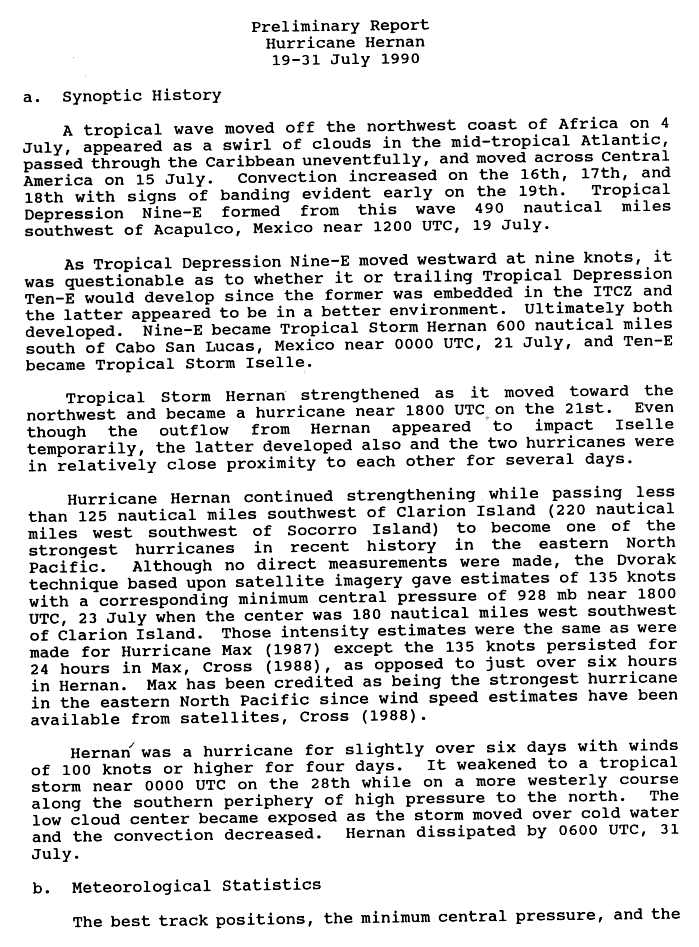
A tropical wave that moved off the northwest coast of Africa on July 4 passed through the Atlantic Ocean and Caribbean Sea without significant development.[34] The wave moved across Central America into the northeastern Pacific Ocean on July 15. Thunderstorm activity increased in the system between July 16 and 18 before rainbands became present within the tropical disturbance on July 19. Tropical Depression Nine-E formed later that day while 565mi (909km) southwest of Acapulco, Mexico.[5]
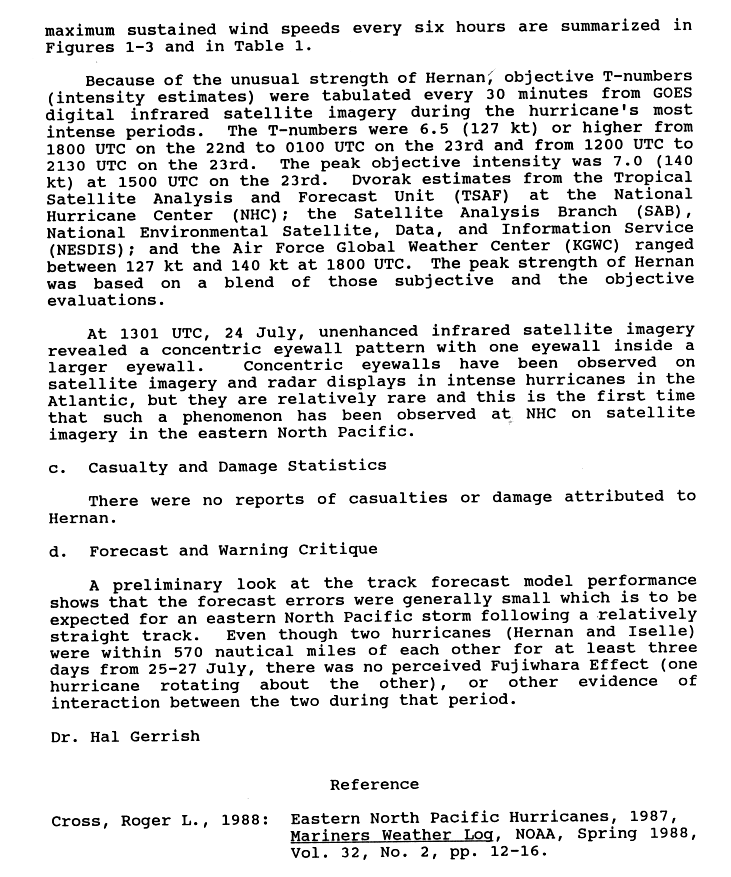
Tropical Depression Nine-E strengthened into Tropical Storm Hernan on July 21 while 684mi (1,101km) south of Cabo San Lucas. The tropical storm continued to strengthen and as it moved to the northwest, and became a hurricane late on July 21. Hernan continued to strengthen and as it passed 145mi (233km) southwest of Clarion Island. On July 23, Hernan reached its peak strength of 155mph (249km/h) and minimum pressure of 928mb (27.4inHg) as the center of circulation was 207mi (333km) south-southwest of Clarion Island. On July 24, concentric eyewalls (one eyewall located inside another) formed around the center of Hernan, which was the first time this pattern had been observed with an eastern Pacific hurricane.[34][35]
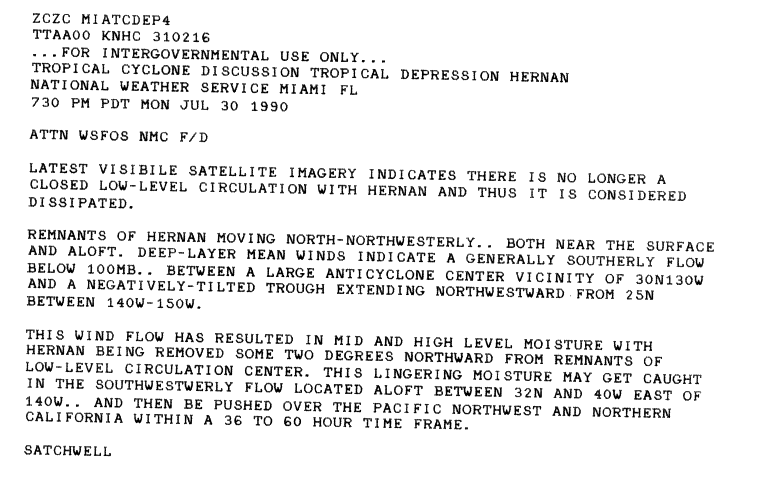
Hernan kept Category4 hurricane intensity a few more days and hurricane strength for six days overall. The hurricane weakened into a tropical storm on July 28 as it moved over cooler waters. Hernan turned more to the west as its low level center became separated from its thunderstorm activity and was steering by a surface high-pressure system to its north. Hernan moved over cooler waters, dissipating as a tropical cyclone early on July 31.[34][36]
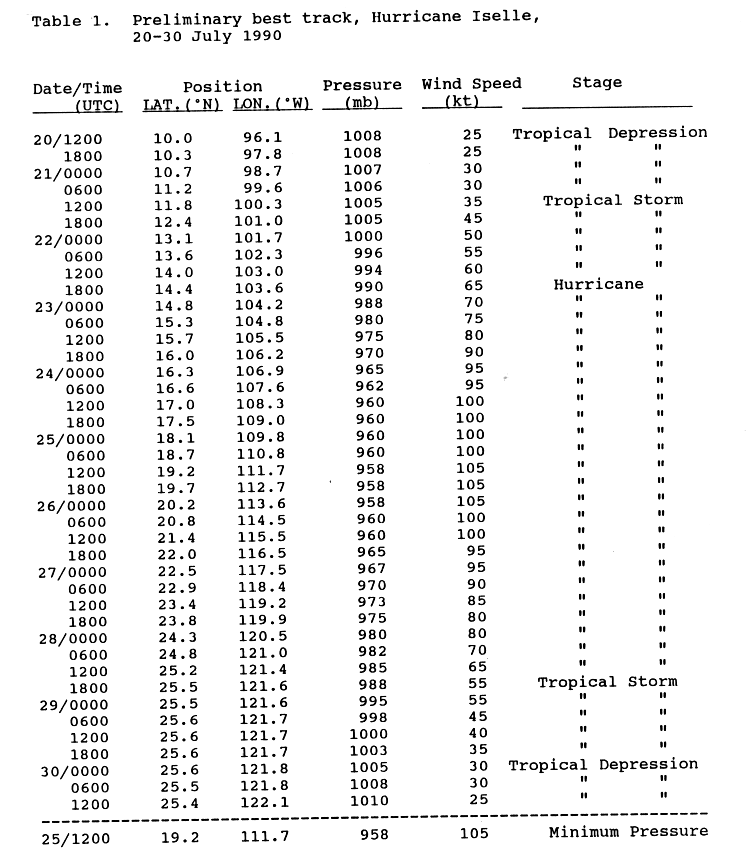
A tropical wave moved off the coast of Africa on July7. The wave moved west, but it was not until it moved across the Caribbean Sea that the wave's convection organized.[37] The system entered into the northeastern Pacific Ocean with concentrated convection and a surface center of circulation while southeast of Acapulco. Moving west-northwest, Tropical Depression Ten-E formed on July 20 393mi (632km) south of Puerto Ángel, Mexico. Early on the following day, the depression strengthened into Tropical Storm Iselle. The storm continued strengthening while in the proximity of Hurricane Hernan, becoming a hurricane on July22.[5]
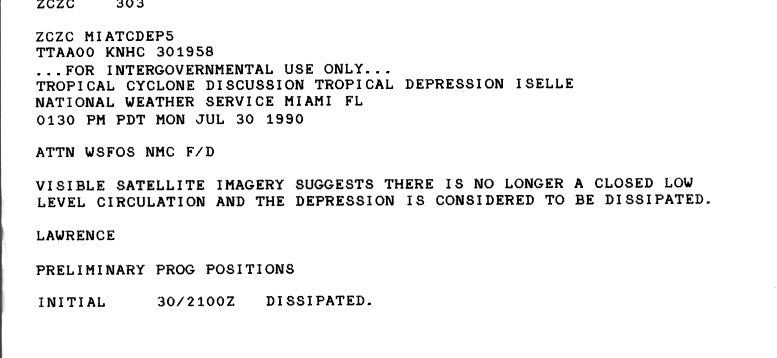
The hurricane continued to move west-northwest through its duration, and reached its peak strength of 120mph (190km/h) on July25. Iselle crossed Socorro Island, which recorded a 70mph (110km/h) sustained wind and heavy rain on July25.[37][38][39] The hurricane weakened on following days after it moved over cooler waters, downgraded to a tropical storm on July28 and subsequently into a tropical depression on July30. The depression dissipated later that day, after losing its low-level circulation 588mi (946km) southwest of San Diego.[37][39][40]
On July 24 a tropical disturbance behind Hurricane Hernan strengthened into a tropical depression. Due to the close proximity of Hernan to its west, the development of the depression was hindered due to vertical wind shear from the outflow of Hernan. This wind shear dissipated the depression on July 26, and its remnants were absorbed by the nearby cyclone. No damages or casualties were caused by the depression as it was well out to sea.[41]
Tropical Storm Aka was the only tropical storm to form in the Central North Pacific during 1990. An area of disturbed weather began to organize on August 6. By August 7, the system became well-enough organized to become designated Tropical depression One-C. The depression intensified into a tropical storm while moving west, to the south of the Hawaiian Islands. On August 10, Tropical Storm Aka peaked with maximum sustained winds of 60mph (97km/h). The storm continued to move west and approached Johnston Island, though the island's weather did not deteriorate. The tropical storm crossed the International Date Line on August 13.[42] Aka weakened back into a depression and dissipated two days later on August 15.[5]
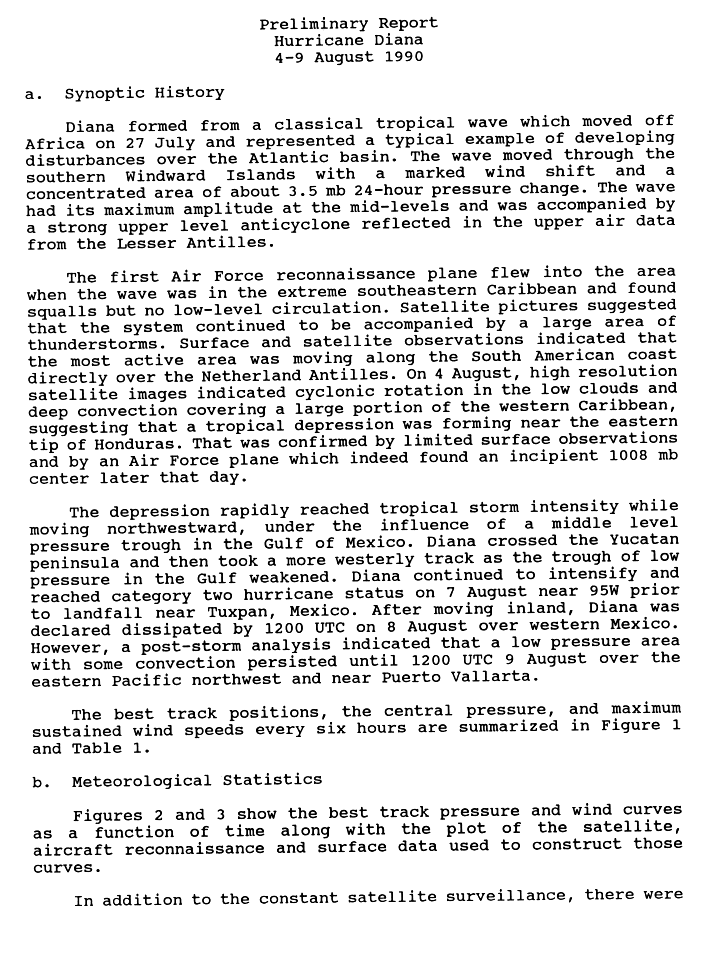
Atlantic basin Hurricane Diana made landfall on August7 at Category2 strength in Tamiahua, Tamaulipas, along the Gulf of Mexico coast. The system quickly deteriorated inland while traversing the high terrain of Mexico. Some convection remained as it emerged into the eastern Pacific Ocean late on August8.[43] Though Diana crossed between basins, the National Hurricane Center did not re-classify it as an eastern Pacific system. No re-intensification occurred, and by the following day it lost all tropical characteristics. The remnant disturbance turned northward around the eastern periphery of an upper-low and tracked through the Gulf of California. Convection flared up before it moved into northwest Mexico, bringing rainfall amounts of over 10in (250mm) to local areas of Sonora. Later, after moving into Arizona, the disturbance dissipated by early on August14.[44]
Tropical Depression Two-C was the second and last tropical cyclone to develop within the north-central Pacific Ocean in 1990. The depression developed from a tropical disturbance well southeast of Hawaii, which became much better organized on the night of August 10. The tropical depression moved in a west northwest direction for the next 18hours and then changed to a west-southwest track on August 11. As it turned more to the southwest, the depression weakened until it dissipated on August 13 about 600mi (970km) south-southeast of Hilo, Hawaii.[42]
A persistent area of thunderstorm activity southwest of Puerto Vallarta became better organized and strengthened into Tropical Depression Twelve-E on August 16. Moving northwest, the system developed slowly as it was embedded within the Intertropical Convergence Zone. Easterly shear kept the system from reaching tropical storm strength and caused its ultimate dissipation on August 19. No damages or fatalities were caused by this depression.[45]
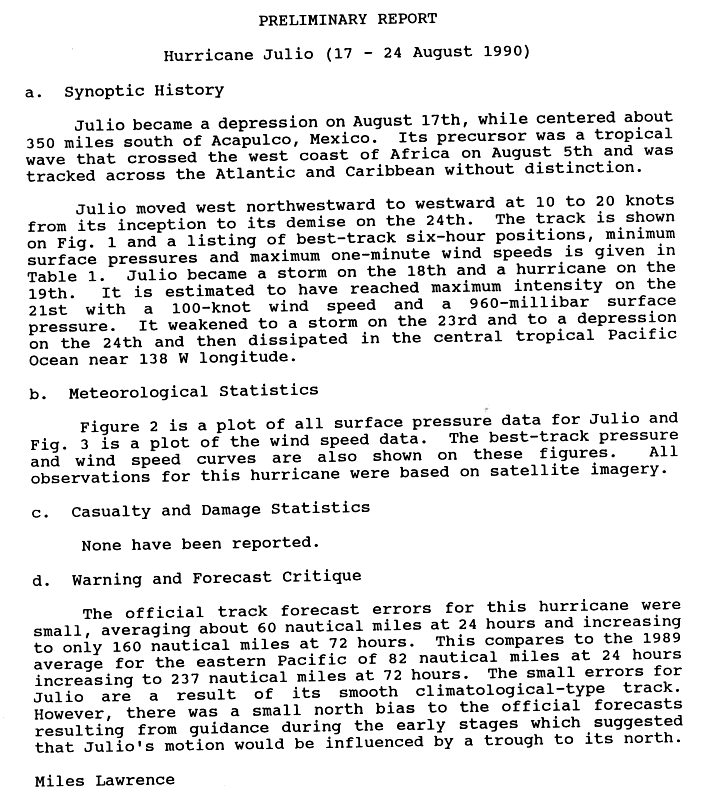
A tropical wave moved off the western coast of Africa on August 5, moving across the Atlantic Ocean and Caribbean Sea without significant development. The system entered the northeastern Pacific Ocean, and became well-enough organized to be upgraded to Tropical Depression Thirteen-E on August 17 while centered 404mi (650km) south of Acapulco, Mexico. The depression moved on a west-northwestward track and strengthened, becoming Tropical Storm Julio on August 18. Strengthening continued and Julio reached hurricane strength on August 19. The cyclone peaked with maximum sustained winds of 115mph (185km/h) on August 21. The storm turned westward and began weakening. Julio regained tropical storm status on August 23 and tropical depression status on August 24 before dissipating as a tropical cyclone later that day. No damage was reported from Julio.[46]
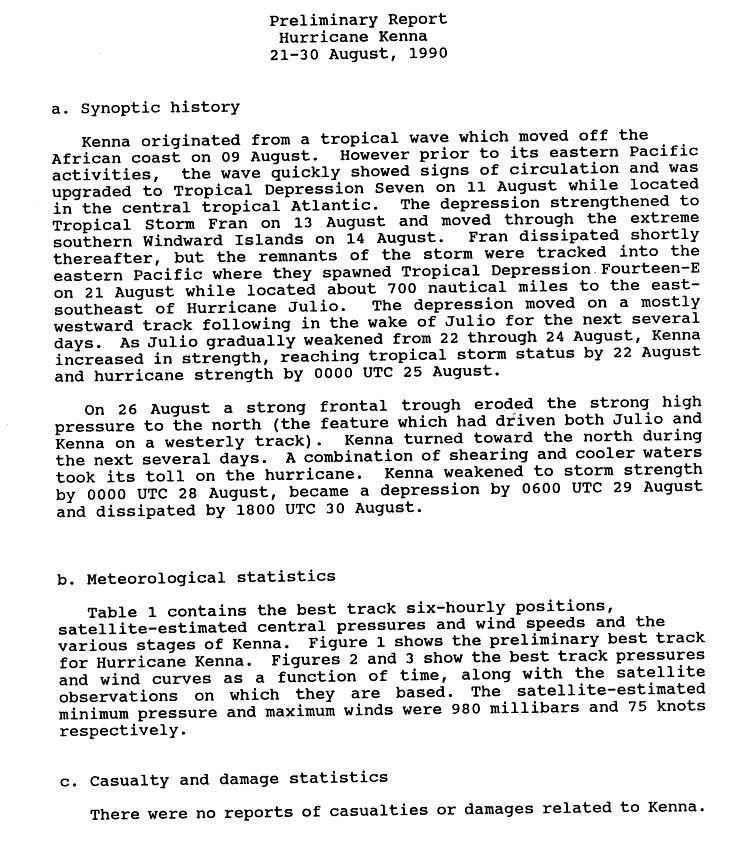
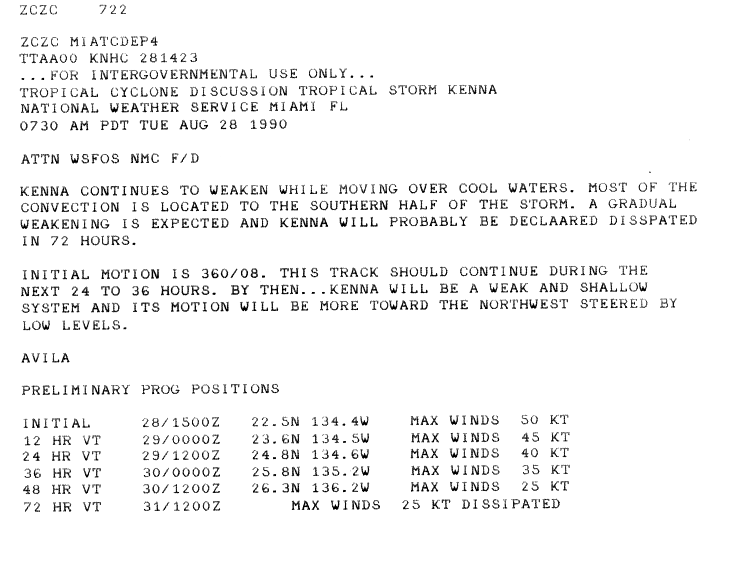
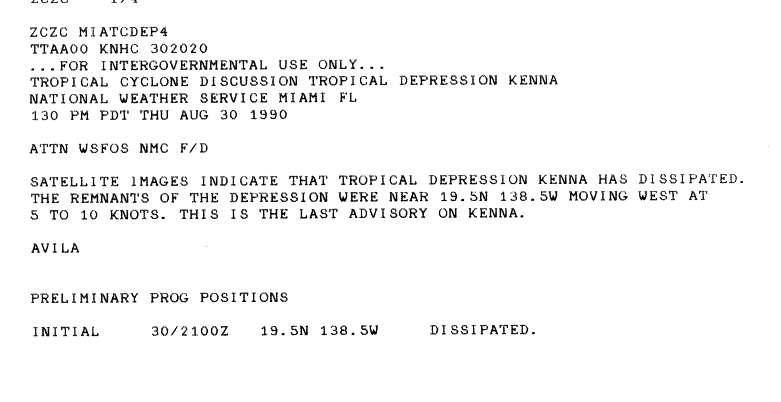
A tropical wave moved off the coast of Africa on August 9, and spawned Tropical Storm Fran four days later, before it moved through the southern Windward Islands on August 14. While Fran dissipated shortly after that, the tropical wave progressed into the northeastern Pacific Ocean.[47] The wave spawned Tropical Depression Fourteen-E 808mi (1,300km) east-southeast of Hurricane Julio. The depression moved westward for the next several days. As Julio weakened, the depression began to increase in strength. It became Tropical Storm Kenna on August 22 and continued to strengthen into a hurricane on August 25, peaking with winds of 85mph (137km/h) the next day. On August 26, a strong frontal trough weakened the high pressure system to the storm's north, causing a turn to the north during the next few days. The hurricane weakened in response to cooler water and increasing vertical wind shear, which removed convection from its center. Kenna weakened back to tropical storm strength on August 28,[48] then into a tropical depression on August 29. The system dissipated as a tropical cyclone on August 30.[47][49]
A tropical wave moved off the northwestern coast of Africa into the Atlantic Ocean on August 11. After moving across the Atlantic and Caribbean Sea without development, the system moved through the Intertropical Convergence Zone of the northeastern Pacific Ocean.[50] The cloudiness moved northward toward the Gulf of Tehuantepec on August 22. The thunderstorm activity organized sufficiently for the system to be upgraded to Tropical Depression Fifteen-E on August 23 while 298mi (480km) southeast of Acapulco, Mexico. The depression moved west-northwestward and strengthened into a tropical storm 217mi (349km) south-southwest of Puerto Vallarta on August 25. The storm began to turn more westward due to a strengthening high pressure system to its north and was upgraded to a hurricane on August 27 while 286mi (460km) southwest of Cabo San Lucas. As the high to the north continued to strengthen, the hurricane turned west-southwest.[50]
Thunderstorm activity with the hurricane began to weaken and Lowell was downgraded back to tropical storm status on August 28. The tropical storm then turned to a north-northwestward with the storm passing over cooler waters. On August 31, the storm was downgraded to a tropical depression, with only minimal amounts of deep convection remaining within its circulation. Lowell dissipated as a tropical cyclone on September 1, though a low-level circulation of clouds could be seen on satellite imagery for the next few days. No damage or casualties was reported as a result of Lowell.[50][51]
A tropical wave moved off the northwestern coast of Africa on August 16. The wave moved west through the Atlantic Ocean and Caribbean Sea without significant development.[52] The wave moved across Central America and into the northeastern Pacific Ocean, on August 29. Isolated convection with the system increased while south of the Gulf of Tehuantepec as the system moved northwest parallel to the southwest coast of Mexico. Once convective activity increased, the system was upgraded to Tropical Depression Sixteen-E on September 7 while centered 659mi (1,061km) southwest of Clarion Island.[52]
A weaker than normal high pressure system controlled the movement of the depression, and the system moved slowly to the west through its duration. The depression strengthened into Tropical Storm Marie on September 8, and into a hurricane on September 9, while 522mi (840km) south-southwest of Clarion Island. Marie reached its peak intensity of 140mph (230km/h) on September 11.[52] The hurricane crossed into the central North Pacific on September 14 as a hurricane with maximum sustained winds of 110mph (180km/h). The hurricane weakened thereafter and on September 17 Marie regained tropical storm status. The system weakened into a tropical depression on September 19 and dissipated as a tropical cyclone on September 21 near the Hawaiian coast. No casualties or damages were caused by Marie.[42]
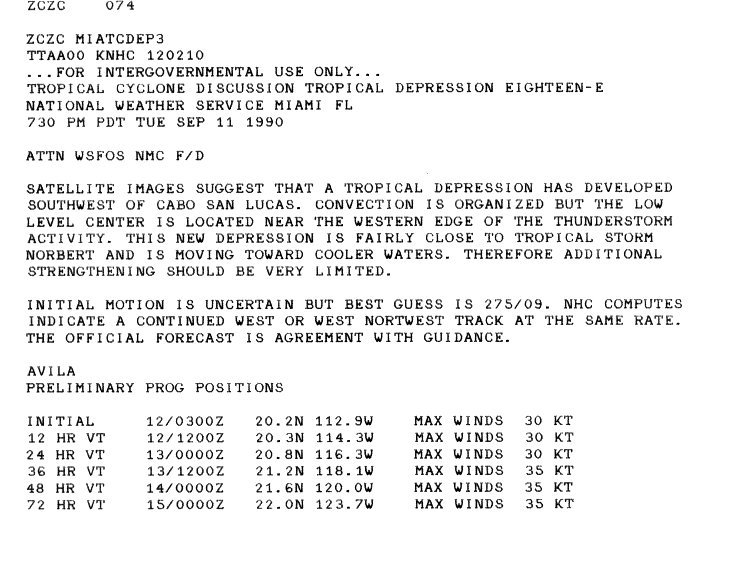
A tropical wave moved off the coast of Africa and across the Atlantic Ocean and Caribbean Sea without significant development. The wave entered the northeastern Pacific Ocean and began to show signs of organized thunderstorm development. Tropical Depression Seventeen-E formed on September 10 while centered 758mi (1,220km) south-southwest of Cabo San Lucas, Mexico. The depression became better organized and strengthened into Tropical Storm Norbert later in the day.[53]
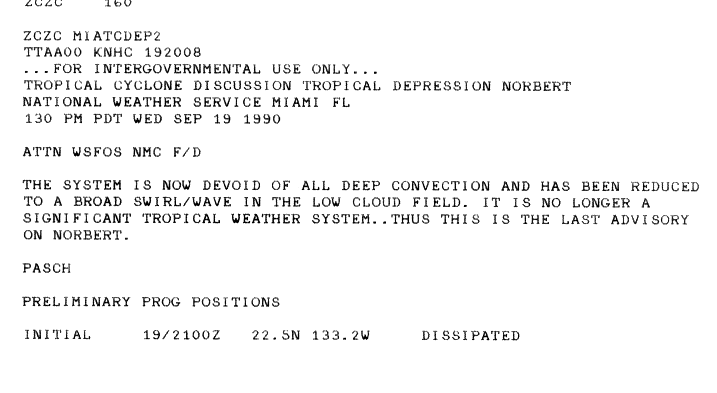
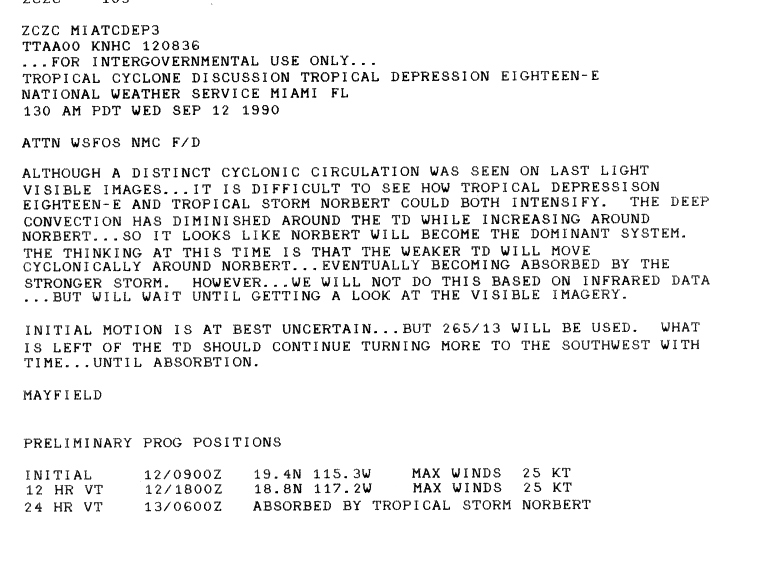
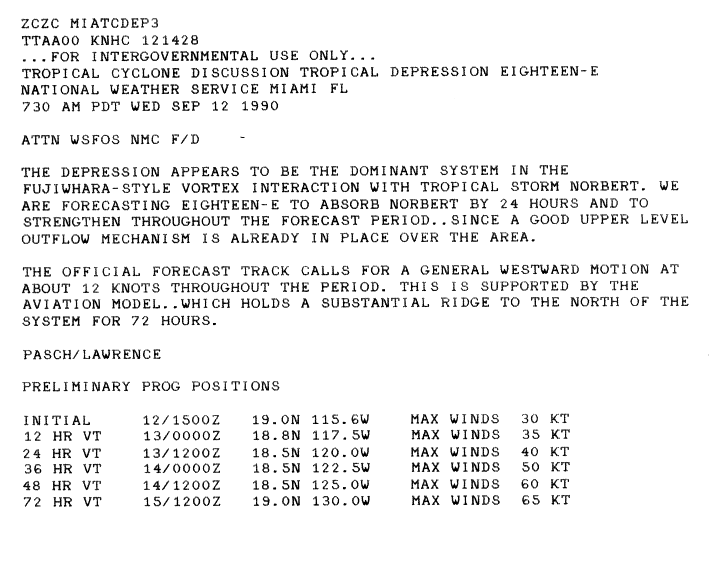
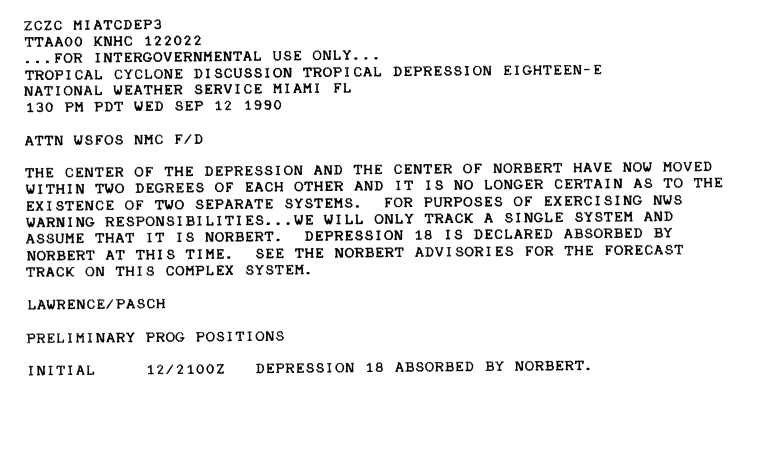
On September 12, Norbert absorbed Tropical Depression Eighteen-E which was in close proximity. Norbert strengthened as it moved north-northwestward. The tropical storm was upgraded to a hurricane on September 14, and formed an eye on September 15. The storm reached its peak strength of 80mph (130km/h) sustained winds that day. Turning north of due west,[53] Norbert then weakened as it moved over cooler waters. It was downgraded to a tropical storm later on September 15, and then to a tropical depression on September 18. Norbert dissipated as a tropical cyclone on September 19 after losing all its deep convection.[53][54]
On September 12, satellite images indicated that the eighteenth tropical depression of the season formed southwest of Cabo San Lucas. Located in close proximity to Tropical Storm Norbert, the depression would soon enter a region of colder sea surface temperatures, and the National Hurricane Center noted that only very little intensification was possible.[55] As predicted, Norbert hindered further intensification of Tropical Depression Eighteen-E. The National Hurricane Center noted six hours later that the depression would likely be absorbed into Norbert.[56] The National Hurricane Center later believed that Tropical Depression Eighteen-E was "dominating" the interaction between the two systems, and was forecast to absorb Norbert.[57] Unlike the latter prediction, Norbert absorbed Tropical Depression Eighteen-E later that day.[58]
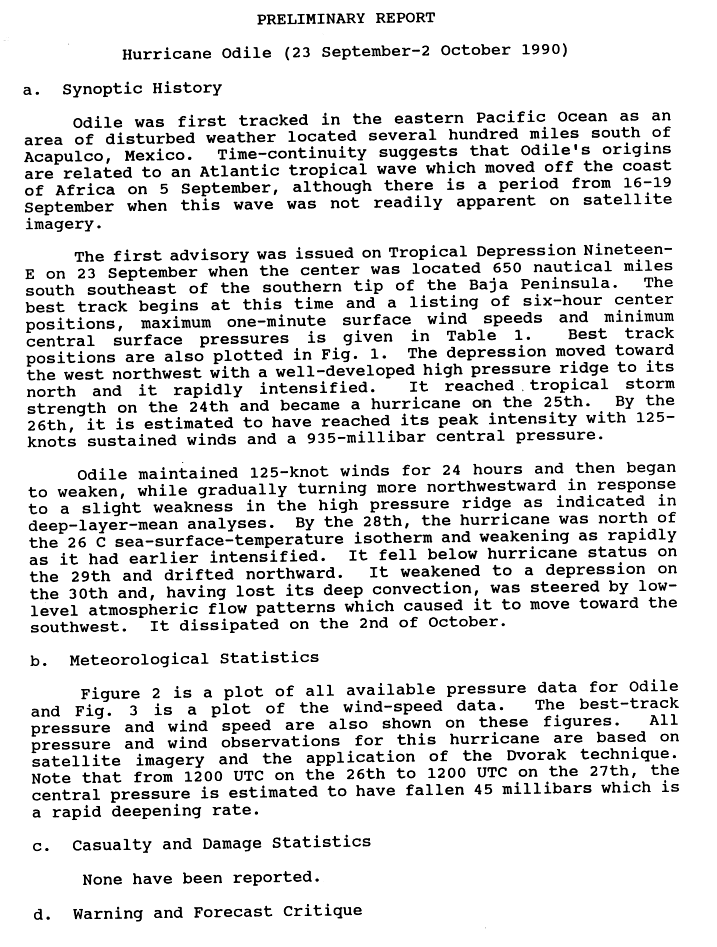
A tropical wave move off the coast of Africa on September 5, and crossed the Atlantic waters, the Caribbean Sea and eventually into the Pacific Ocean as a weak system. An area of convection entered into the northeastern Pacific Ocean a few hundred miles south of Acapulco, Mexico. On September 23, Tropical Depression Nineteen-E formed from this convection, while 746mi (1,201km) south-southeast from the southern tip of Baja California. The depression moved on a west-northwestward track, rounding the southwest side of a strong high pressure system. The depression continued to strengthen and was upgraded to Tropical Storm Odile on September 24 and into a hurricane on September 25. Its intensity peaked with maximum sustained winds of 145mph (233km/h) on September 26.[59]
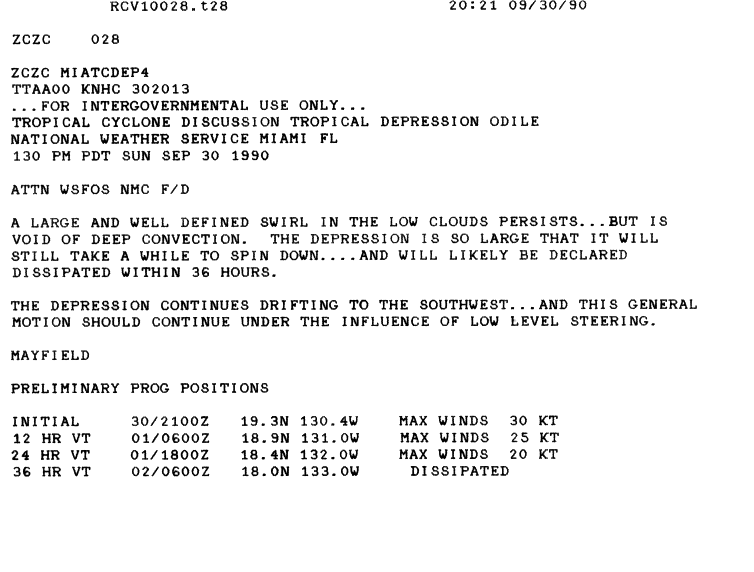
The hurricane began to turn more northwestward in response to a high-pressure system weakening to its north. Odile began to weaken as it moved over cooler waters on September 28. The cyclone regained tropical storm status on September 29 while it slowly progressed northward. The system weakened into a tropical depression status on September 30. Once it lost its deep convection, Odile was steered southwestward by the low-level flow, before it dissipated as a tropical cyclone on October 2. Its remaining low-level circulation of clouds continued on a southwestward course thereafter.[59][60]
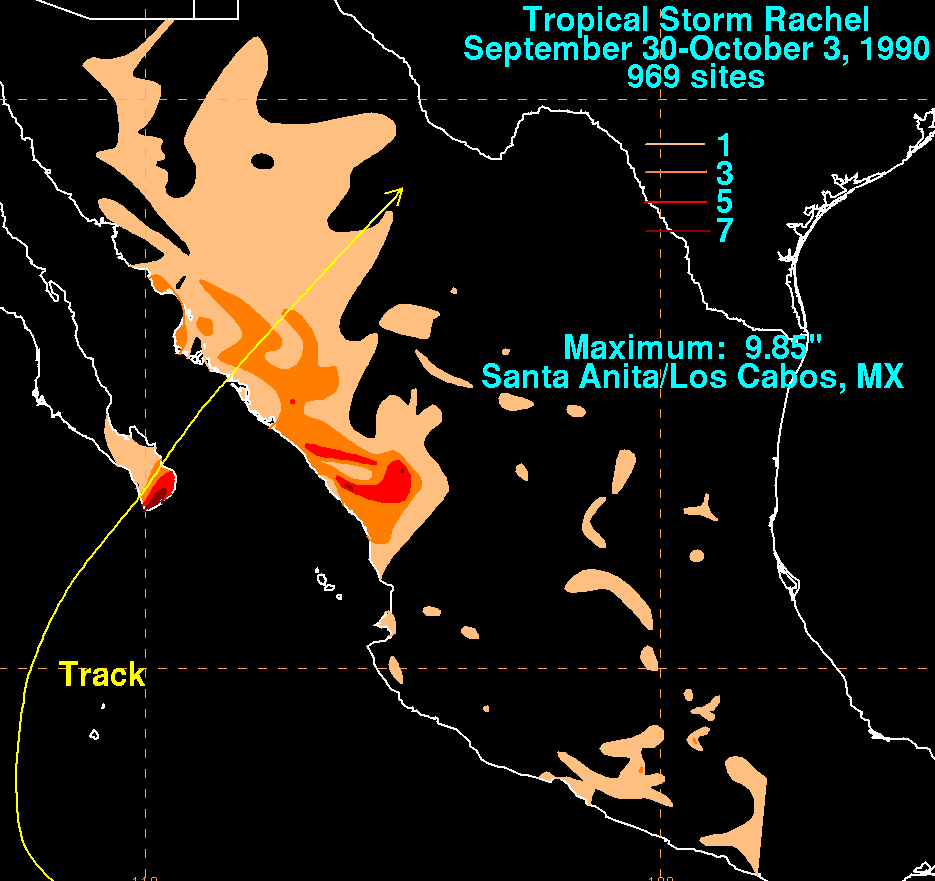
In mid-September, a weak tropical wave moved off the coast of Northwest Africa. It moved westward and entered the eastern Pacific Ocean early on September 23. Cloudiness became concentrated with the system south of the Gulf of Tehuantepec. On September 27, the organized thunderstorm area was upgraded to Tropical Depression Twenty One-E while 230mi (370km) south of Acapulco. The depression developed slowly, and became a tropical storm on September 30. As Rachel briefly moved northward, before re-curving and accelerating towards the Mexican coast. The storm passed over the southern portion of Baja California Sur on October 2. Rachel made its final landfall midway between Los Mochis and Culiacán, and became the only system to make landfall from the eastern north Pacific Ocean in 1990.[61][62] Rachel decayed rapidly over land, and the final public advisory on Rachel was issued early on October 3.[63] its remnants continued accelerating over Texas until they lost their identity.
The highest rainfall total from the system in Mexico totaled 9.85in (250mm) at Santa Anita near the tip of Baja California.[64] Across northern Mexico, thousands were homeless, and 18 people died.[65] In Texas, Rachel's remnants caused heavy rain. Flooding occurred in the Big Bend area.[61][62][63][66]
Polo originated from a tropical wave that moved off the African coast on September 2 which spawned Hurricane Isidore in the Atlantic basin. On September 14, the system increased in convection as it was moving to the west and approaching Central America. The southern extent of the wave crossed into the Pacific Ocean on September 18.[67]
The wave continued westward and related thunderstorm activity increased during the following week. The convective system organized into Tropical Depression Twenty-E on September 28 nearly midway between Mexico and Hawaii. Initially, the depression drifted toward the northwest due to a large upper-level trough located to its west. Polo strengthened rapidly into a hurricane early on September 30, with its winds peaking at 75mph (121km/h). Since the storm was very small, vertical wind shear caused significant weakening thereafter.[67] On October 1, Polo crossed into the Central Pacific basin at tropical storm strength. The storm continued to weaken, becoming a tropical depression and then dissipating southwest of Hawaii later in the day.[42] There were no casualties or damages caused by Polo.
A weakly defined tropical wave moved off the northwest coast of Africa on September 20, and crossed the northern portion of the tropical Atlantic and northern South America without significant organization. The wave moved into the northeastern Pacific waters, off the coast of Colombia on September 30. As the wave passed over southern Central America, rainbands and cloudiness increased with the system between October 1 and October 3, before the system merged with the ITCZ from October 4 to October 6. Signs of convective organization reappeared on October 8, and by October 9, the system was upgraded to Tropical Depression Twenty Two-E 578mi (930km) south of Cabo San Lucas, Mexico.[68]
The depression continued to develop and was upgraded to Tropical Storm Simon on October 10 while 604mi (972km) south-southwest of Cabo San Lucas. Due to a high-pressure system to the north-northwest, Simon continued on a west-northwestward path. The tropical storm continued to strengthen to its peak intensity of 70mph (110km/h) by late on October 11. Simon passed over cooler waters and weakened back into a tropical depression on October 13. The depression moved on a westward course, and the low-level circulation was displaced from its deep convection during the following day. Simon then dissipated as a tropical cyclone early on October 15 across the open waters of the northeast Pacific.[68]
The tropical wave that would become future Hurricane Trudy became identifiable on satellite imagery as early as September 30, emerging near the African coast off Cape Verde. However, the wave did not show any signs of development until October 16, when the wave developed into a tropical depression several hundred kilometers south of Acapulco. The tropical depression intensified significantly. The ship Maple Ace reported gale-force winds about 140km (85mi) from the center at 1800 UTC on October 18. In less than 36 hours, at 1200 UTC on October 20, Trudy became a powerful hurricane with Category 4 equivalent maximum winds of 155mph (250km/h) and a minimum pressure of 925mbar (27.3inHg) according to satellite estimates. Trudy was at least as intense as Hurricane Max three years earlier and Hurricane Hernan earlier in the year. Estimates state that Trudy may have been the strongest eastern Pacific hurricane since wind estimates have been available from satellite images.[1]
An upper-level trough forced Trudy to move northwards, increasing the risk of hurricane conditions to Baja California Sur residents. The same trough caused an unfavorable environment that caused Trudy to weaken considerably. At that time, dynamically based numeral models predicted Trudy to move northwards over Baja California and make landfall there.[1] Authorities closed five ports on the Baja California peninsula and the Pacific Ocean port of Mazatlán on October 22 as Hurricane Trudy was approaching the Mexican coast with gusts of up to 115mph (185km/h).[69] However, the trough progressed eastwards and was replaced by a ridge, sparing a landfall,[1] but still causing locally heavy rainfall and high waves. Socorro Island reported hurricane-force winds for more than 7 hours.[69][70] Moving away from land, Trudy then started to re-intensify, developing an unusually large eye of nearly 90km (55mi) in diameter. However, another deep trough approached Trudy and pulled the hurricane northwards, shearing it at the same time. Trudy dissipated on November 1 at 1800 UTC. Its remnant moisture spread over parts of Mexico and the United States.[1]
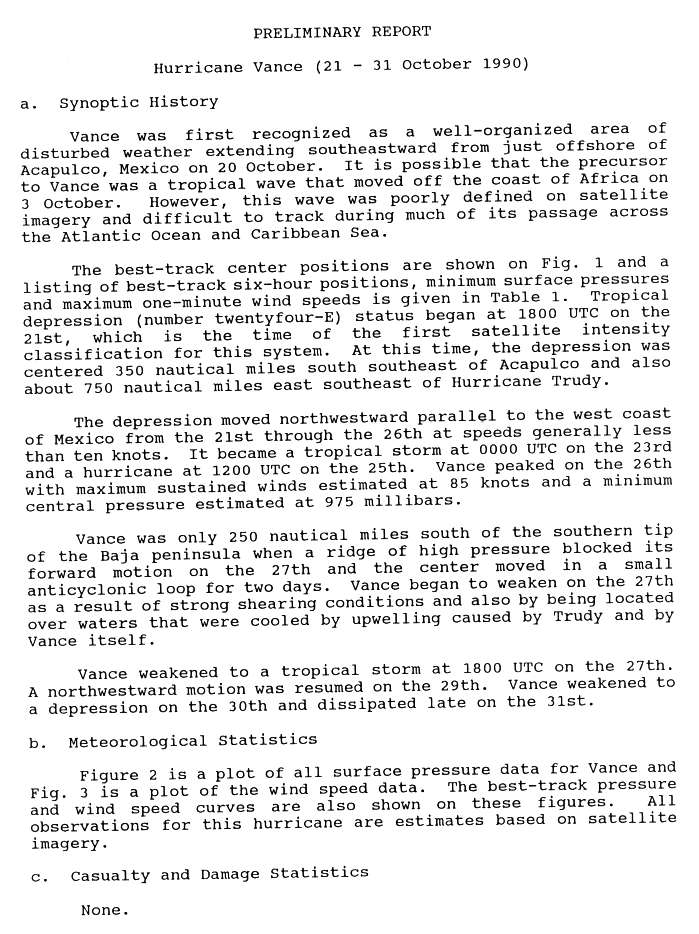
An area of disturbed weather, possibly related to a tropical wave, organized into Tropical Depression Twenty Four-E on October 21. It strengthened into Tropical Storm Vance early on October 23 and then into a hurricane two days later. Vance moved parallel to the west coast of Mexico and approached the southern tip of the Baja California Peninsula. Before it could strike land, a high-pressure area blocked Vance's path and forced the storm to transcribe a small clockwise loop over a two-day period. During the loop, Vance encountered wind shear and cool waters stirred up by Trudy as well as earlier in its duration. Vance weakened to a tropical storm on October 27 and a depression on October 30. The cyclone dissipated late on October 31.[71]
The following list of names was used for named storms that formed in the North Pacific Ocean east of 140°W in 1990.[72] This is essentially the same list used for the 1984 season, though the rotating lists went only to the "W" name at the time.[73] It would be used next, with one modification, for the 1996 season, as Wallis was interchanged with Winnie.[74] No names were retired from the list following the 1990 season.[75]
Additionally, Diana entered the eastern Pacific basin during the season from the Atlantic basin. Its crossover between basins as an intact tropical cyclone was detected in a post-storm analysis of the system. Thus the National Hurricane Center did not re-classify it as an eastern Pacific system.[43][44]
For storms that form in the North Pacific from 140°W to the International Date Line, the names come from a series of four rotating lists. Names are used one after the other without regard to year, and when the bottom of one list is reached, the next named storm receives the name at the top of the next list.[72][76] One named storm, listed below, formed in the central North Pacific in 1990. Named storms in the table above that crossed into the area during the year are noted (*).[42]
Aka
Season effects
This is a table of all of the tropical cyclones that formed in the 1990 Pacific hurricane season. It includes their name, duration (within the basin), peak classification and intensities, areas affected, damage, and death totals. Deaths in parentheses are additional and indirect (an example of an indirect death would be a traffic accident), but were still related to that storm. Damage and deaths include totals while the storm was extratropical, a wave, or a low, and all of the damage figures are in 1990 USD.
↑ The total represents the sum of the squares of the maximum sustained wind speed (knots) for every (sub)tropical storm's intensity of over 33 knots (38mph; 61km/h), divided by 10,000 while they are above that threshold; therefore, tropical depressions are not included.
1 2 National Hurricane Operations Plan(PDF) (Report). Washington, D.C.: NOAA Office of the Federal Coordinator for Meteorological Services and Supporting Research. May 1990. pp.3-6–7. Retrieved January 15, 2024.
↑ National Hurricane Operations Plan(PDF) (Report). Washington, D.C.: NOAA Office of the Federal Coordinator for Meteorological Services and Supporting Research. May 1984. p.3-10. Retrieved January 15, 2024.
↑ National Hurricane Operations Plan(PDF) (Report). Washington, D.C.: NOAA Office of the Federal Coordinator for Meteorological Services and Supporting Research. May 1996. pp.3-8–9. Retrieved January 15, 2024.
This page is based on this Wikipedia article Text is available under the CC BY-SA 4.0 license; additional terms may apply. Images, videos and audio are available under their respective licenses.


