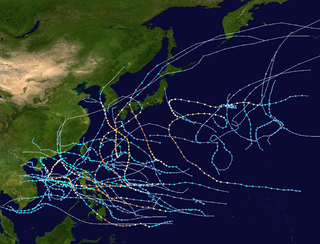
The 1997 Pacific hurricane season was a very active hurricane season. With hundreds of deaths and hundreds of millions of dollars in damage, this was one of the deadliest and costliest Pacific hurricane seasons on record. This was due to the exceptionally strong 1997–98 El Niño event. The season officially started on May 15, in the eastern Pacific, and on June 1, in the central Pacific, and lasted until November 30. These dates conventionally delimit the period of each year when almost all tropical cyclones form in the northeastern Pacific Ocean.
Several storms impacted land. The first was Tropical Storm Andres which killed four people and left another two missing. In August, Tropical Storm Ignacio took an unusual path through the basin, resulting in its extratropical remnants causing minimal damage throughout the Pacific Northwest and California. Linda became the most intense east Pacific hurricane in recorded history, a record it maintained until it was surpassed by Hurricane Patricia in 2015. Although it never made landfall, it produced large surf in Southern California and as a result, five people had to be rescued. Hurricane Nora caused flooding and damage in the Southwestern United States, while Olaf made two landfalls and caused eighteen deaths and several other people were reported missing. Hurricane Pauline killed several hundred people and caused record damage in southeastern Mexico. In addition, Super Typhoons Oliwa and Paka originated in the region before crossing the International Date Line and causing significant damage in the western Pacific. There were also two Category 5 hurricanes: Linda and Guillermo.
Activity in the season was above average. The season produced 17 named storms, which was a little above normal. The average number of named storms per year is 15. The 1997 season also had 9 hurricanes, compared to the average of 8. There were also 7 major hurricanes compared to the average of 4.[1]
The 1997 Pacific hurricane season officially started on May 15, 1997, in the Eastern Pacific, and on June 1, 1997, in the Central Pacific, and lasted until November 30, 1997. These dates conventionally delimit the period of each year when most tropical cyclones form in the northeastern Pacific Ocean.[2] The first storm, Andres, formed on June 1. The last storm, Paka, crossed the International Date Line into the Northwestern Pacific Basin on December 6.[3]
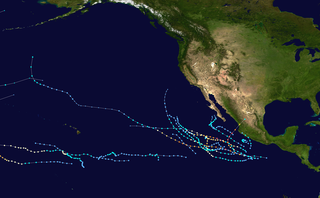
The 1997 Pacific hurricane season was fairly active, due to the strong El Niño that was occurring at the time. El Niño causes wind shear to be reduced and water temperatures to increase, resulting in conditions more conductive for tropical cyclones in the East Pacific. There were 24 tropical cyclones in total, including five unnamed tropical depressions. Of the 19 remaining tropical cyclones that became tropical storms, ten reached hurricane status (excluding Tropical Storms Oliwa and Paka, which attained typhoon status after crossing into the Western Pacific basin). Also, seven of the ten hurricanes reached Category3 intensity or higher on the Saffir–Simpson hurricane scale, becoming major hurricanes.[3]
Activity in the Central Pacific was also above average. Two tropical storms formed, as did three tropical depressions. Four tropical cyclones also moved in from the Eastern Pacific. Overall, nine tropical cyclones entered or formed in the Central Pacific in 1997, the fourth-highest number since accurate records began in 1961.[4]
The National Hurricane Center uses accumulated cyclone energy (ACE) to rank hurricane seasons as above-normal, near-normal, and below-normal.[5] The total ACE of this season is 160*104kt2 in the east Pacific proper, which qualifies this season as above-normal.[6]
Andres originated from a disturbance that slowly organized and formed into Tropical Depression One-E on June 1. The next day, it reached tropical storm status as a second circulation formed north-northwest of the initial circulation. However, the former circulation became dominant, and Andres intensified slightly. After a brief period of a normal track to the northwest, Andres was picked up by westerly winds and became the first named storm to threaten Central America. Initially forecast to cross the isthmus and enter the Caribbean Sea, Andres instead turned to the southeast and paralleled the coast. This was the first time since record-keeping began that any East Pacific storm had taken such a path. Andres then turned back to the northeast. It weakened to a depression and made landfall near San Salvador on June 7 and dissipated shortly thereafter.[7]
Among the casualties were two fishers who were reported missing. Andres caused power outages, flooding rivers, several car crashes, and damage to roughly ten homes.[7] The highest rainfall report from Mexico was 11.42in (290mm) at Mazatan.[8] Damage was noted in parts of Nicaragua.[7] Andres also killed four people in Usulután, El Salvador due to heavy flooding.[9]
Tropical Depression Two-E formed from a broad area of low pressure on June 9. Six hours later the depression strengthened into Tropical Storm Blanca. This system developed a good outflow, and reached its peak intensity with winds of 45mph (75km/h). However, its circulation was not well-defined and a weakening trend began, and Blanca was downgraded to a depression on June 12. It lost its closed circulation shortly thereafter and was thus declared dissipated.[10]
Blanca briefly threatened land on June 10 as warnings and watches were established by the Mexican Servicio Meteorológico Nacional. Shortly thereafter, a ridge of high pressure turned Blanca away from the coast.[10] As Blanca moved just south of the Mexican coast, it dropped a total of 5.77 inches (147mm) of rainfall at Fincha Chayabe/Maragaritas.[11] There were no major damage or casualties as Blanca's impact was generally minimal.[10]
Tropical Depression Three-E formed June 21. Moving rapidly westward, it never strengthened and the winds of the depression soon decreased. It dissipated early on June 24.[12] The depression never impacted land.
On June 22, showers increased associated with a tropical wave several hundred miles away from land. Three days later, deep convection became more concentrated, and the system became a tropical depression. It intensified into Tropical Storm Carlos as banding features increased and the outflow became better defined. As it moved west, convection diminished as Carlos moved into cooler water. Shortly thereafter, increased wind shear took its toll on Carlos as the low-level center became exposed from the deep convection. Carlos weakened into a depression early on June 27, and dissipated June 28. However, a swirl of clouds remained for a couple of days. Except for Socorro Island, which the system passed close to, Carlos never threatened land. No indications of casualties or damage were reported.[13]
On the afternoon of June 29, Tropical Depression Five-E formed. It erratically moved westward. On July 1, the depression weakened slightly, but quickly reintensified. It dissipated on July 4, without even threatening land.[14]
During July 1, an upper-level low to the south of Baja California cut off the north-easterly vertical windshear that the depression had been encountering, which caused deep convection to redevelop near the systems center and the NHC to resume issuing advisories.[15][16]
In early July, shower activity increased in association with an area of disturbed weather. With surface pressures lower than normal for a tropical disturbance, deep convection increased further and Tropical Depression Six-E formed late on July 5 and reaching tropical storm status the following day and was named Dolores. Despite moderate wind shear, very cold cloud tops formed as the winds increased to 60mph (95km/h), a moderate tropical storm. Moving westward, Dolores strengthened into the first hurricane of the season on July 7 as a ragged eye formed.[17]
Dolores continued to intensify and it reached a peak windspeed of 90mph (150km/h), a strong Category 1 hurricane, two days later. Meanwhile, Dolores became the first hurricane in over two years to cross longitude 125°W. Shortly thereafter, the hurricane started losing strength as it moved over cooler waters. The eye dissipated from satellite imagery while the associated thunderstorm activity became sheared. Dolores weakened back into a tropical storm on July 10 and a tropical depression the next day. The cyclone then crossed into the Central Pacific Hurricane Center's area of responsibility (west of longitude 140°W) while producing minimal shower activity. It dissipated on July 12. The hurricane was not a threat to any land.[17]
The first major hurricane of the season originated from a broad area of low pressure on July 8 near the Gulf of Tehuantepec. The thunderstorms gradually became more concentrated and a tropical depression formed on July 12. It strengthened into a tropical storm twelve hours later, and then began to rapidly intensify as convection increased further near the center. It became a hurricane on July 13. Enrique continued to steadily intensify and became a Category 2 hurricane on July 14. The next day, Enrique reached its peak intensity of 115mph (185km/h) and peak pressure 960mbar (hPa) on July 14. Shortly thereafter, the hurricane outflow became asymmetrical and it began to weaken over cool waters. It weakened fairly quickly and was downgraded into a Category 2 hurricane on July 15. It then lost hurricane intensity later that day. On July 16 the winds had decreased further to 50mph (80km/h). Enrique weakened into a depression the next day, and degenerated into a swirl of clouds shortly thereafter. The system never threatened land.[18]
A large area of disturbed weather formed on July 13. It then organized into a depression south of Manzanillo, Colima, on July 14. Intensification was delayed by wind shear due to its proximity to Enrique for about two days. However, it became a tropical storm late July 15 as it moved west-northwestward. Continuing to intensify, an eye formed. Based on this, Felicia was upgraded into a hurricane on July 17. Its development was again halted by increased wind shear, and as such it leveled off in intensity. After the shear decreased, Felicia began to intensify and the hurricane's winds reached 215km/h (130mph) and its pressure fell to 948mbar (hPa), making it a moderate low-end Category 4 hurricane. Shear increased for the third time, and then moved into cooler waters. It began to weaken as it moved west-northwest. On July 20, it lost major hurricane intensity. Shortly before being downgraded to a tropical storm, it crossed 140°W. A strong wind shear took toll on Felicia and it was downgraded into a tropical depression July 22. No damage or deaths were reported in wake of the hurricane.[19]
Tropical Depression One-C formed on July 26 from a disturbance that had been showing signs of organization for the past three days. It moved west to southwest through an unfavorable environment. On the morning of July 27, it dissipated due to strong wind shear caused by an upper-level trough. The system never impacted land, thus no damage was reported.[4]
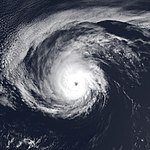
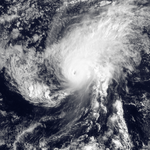
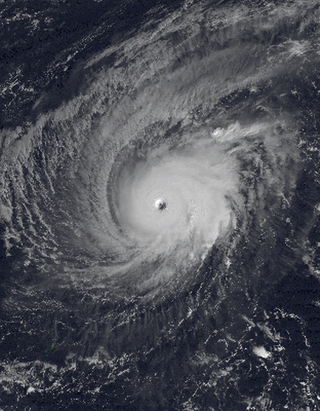
A tropical wave emerged into the Pacific Ocean on July 27. It organized into a depression July 30 and was named Tropical Storm Guillermo the next day. It quickly intensified, reaching hurricane status on August 1. Guillermo became a major hurricane on August 2. It reached Category4 intensity on August 3. Continuing to rapidly intensify, Guillermo attained Category5 strength August 4. The tropical cyclone peak intensity was 919mbar (hPa) and 160mph (260km/h).[20]
Guillermo then weakened slowly, becoming a tropical storm August 8. It crossed 140°W and entered the Central Pacific. It weakened to a depression late August 10, but restrengthened back into a storm 24hours later when it encountered a small area of warmer water. It weakened to a depression for the second and final time August 15 and became an extratropical cyclone early the next day. The storm's remnants recurved over the far northern Pacific. They were tracked to a point 500 nautical miles (930km) west of Vancouver Island. The remnants persisted for a few more days and drifted south before being absorbed by a mid-latitude cyclone August 24 off the coast of California.[20]
A tropical wave that had showed signs of development emerged into the East Pacific and organized into Tropical Depression Ten-E on August 10. Despite some wind shear, the depression managed to become a tropical storm late on August 11. Hilda reached its peak intensity as a moderate 50mph (85km/h) tropical storm the next day. After maintaining its peak intensity for 24 hours, it gradually weakened due to increasing wind shear On August 14, shear weakened Hilda to a depression and the cyclone dissipated early the next morning. Hilda was no threat to land and caused no known damage or deaths.[21]
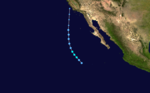
Tropical Storm Ignacio formed first as a depression in an area of disturbed weather on August 17. Twelvehours later, it organized into a tropical storm. Its location of tropical cyclone formation was further north and west of where most East Pacific tropical cyclones develop.[22] Steering currents pulled Ignacio north, where it encountered wind shear and cooler waters. Ignacio never intensified beyond 40mph (65km/h) and then was downgraded into a depression on August 18. It last transitioned into an extratropical cyclone 24 hours later. It was then absorbed by a cyclone associated with the remnants of Hurricane Guillermo.[22]
Ignacio's remnants moved north, bringing gusty winds to California coastal waters before dissipating.[23] Severe flooding was recorded along Highway 97 with a debris flow estimated at 0.5mi (0.80km) and 7ft (2.1m) deep.[24] They caused rainfall as far north as the U.S. state of Washington.[25] Thunderstorms caused power outages in central California.[22]
During the third week of August, a tropical disturbance formed far from land. Although the system was located over warmer than average sea surface temperatures, the upper-level environment was initially unfavorable. However the environment gradually became more conducive for tropical cyclone formation and Tropical Depression Twelve-E formed August 25 from an area of disturbed weather in a rather easterly location. It became a tropical storm the next day and a hurricane on August 27. Intensification was rapid, with winds increasing from 75mph (121km/h) to 115mph (185km/h) in just 6hours. Continuing to rapidly intensify, it reached its peak intensity as a low-end category 4 hurricane.[26] After maintaining peak intensity for 30 hours, it moved north-northwest and encountered increasing wind shear which reduced its winds from 115mph (185km/h) to 35mph (56km/h) in just 24 hours. Jimena completely dissipated on August 30, not long after entering the Central Pacific Basin. Hurricane Jimena was of no threat to land.[26]
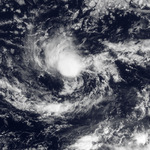
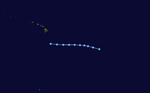
Tropical storm Oliwa began as a tropical disturbance that had meandered south of Johnston Atoll. It organized into Tropical Depression Two-C on September 2. Later that day, it was upgraded to Tropical Storm Oliwa (Hawaiian for Oliver) as it slowly moved towards the west.[4] It crossed the dateline late on September 3 and entered the Joint Typhoon Warning Center's Area of Responsibility.[27] Oliwa passed south of Wake Island on September 6, where it caused heavy rains but no damage. On September 7, Oliwa started a period of rapid strengthening, becoming a typhoon on September 8 and a Super Typhoon eight hours later. Oliwa stayed at that intensity for over two days. While still a strong typhoon, Oliwa passed near the Northern Marianas Islands. It then started weakening as it curved towards Japan. It made landfall as a minimal typhoon September 16. It quickly dissipated later that same day.[28] Typhoon Oliwa caused 12fatalities and left 30,000people homeless. Damage totaled to 4.36billion yen ($50.1million USD).[29][30]
Tropical Storm Kevin, first displayed hints of development while located near Panama, and developed a well-defined circulation after emerging into the Pacific. It was classified as a tropical depression in the Pacific on September 3 while located south-south west of Baja California. Convection increased and the outflow of the storm became better defined. As such, it became a tropical storm on the morning of September 4. Gradually intensifying, it reached it peak intensity as a mid-level tropical storm on September 5. As it moved westbound, it maintained its intensity for 12 hours. The environment was unfavorable, and two days later, Kevin weakened to a depression when deep convection ceased. It dissipated early on September 7, having never posed a threat to land.[31]
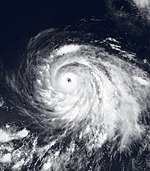
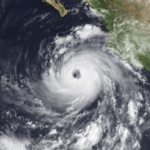
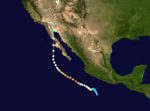
A tropical disturbance formed on September 9 and became Tropical Depression Fourteen-E later that day. The cyclone moved northwest and strengthened into a tropical storm on September 10. Linda then rapidly intensified, reaching hurricane intensity the next day as an eye formed. On September 12, Linda reached its peak intensity, with maximum sustained winds of 295km/h (185mph)—making it a Category5 hurricane on the Saffir-Simpson Hurricane Scale—and a minimum pressure of 902mbar (902hPa), making it the most intense Pacific hurricane ever recorded until Hurricane Patricia surpassed it in 2015. However, Linda soon moved over cooler waters, and began to weaken, falling below hurricane intensity on September 16. It then slowly weakened and dissipated on September 17.[32]
Linda passed very near Socorro Island.[32] In addition, early forecasts predicted that Linda would make landfall in California. The landfall never materialized and warnings or watches were not necessary for any location. However, Linda caused large surf, which crashed ashore in California, where it swept five people off a jetty. Moisture related to Linda also contributed to a landslide in southern California that destroyed or damaged 79houses.[33]
An area of disturbed weather formed early on September 10. It became better organized two days later as convection increased, and then organized into Tropical Depression Fifteen-E late on September 12. Moving slowly in a westward direction, it strengthened into a tropical storm in the morning of September 14. Later that day, the system reached its peak intensity of 45mph (72km/h). Meanwhile, the storm's forward speed slowed down even more, and it turned to the south. It then encountered an area of strong wind shear, and it weakened into a depression on September 15 as the center of circulation became displaced from the deep convection. The shear continued to weaken, and the tropical cyclone dissipated late on September 16. There were no deaths or damage.[34]
A large area of disturbed weather moved into the Pacific on September 12. It then organized into Tropical Depression Sixteen-E on September 16 and quickly strengthened into a tropical storm. Early on September 18, a poorly defined and ragged eye appeared on infrared imagery. Shortly thereafter, its winds reached 165km/h (105mph). Nora eventually peaked at Category4. It then encountered water temperature anomalies, and fluctuated in strength. Then, a trough pulled Nora northward and accelerated the storm. After weakening to a Category1, Nora made landfall in northern Baja California and stayed a tropical storm as it entered the United States. At that time, however, most of the deep rest convection was displaced to the northeast. Nora dissipated over Arizona, but its remnants kept going north.[35]
Hurricane Nora was the first Pacific hurricane to bring gale-force winds to the Continental United States since Kathleen in 1976.[36] In Mexico, Nora produced high waves, flooding, and heavy damage. Many homes were destroyed. In the United States, rains were heavy, and damage amounted to several hundred million dollars. Several hundred people were rendered homeless, and there was wind and flood damage in Arizona. Nora killed two people in Mexico, and several indirect deaths were reported in California.[35]
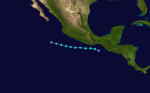
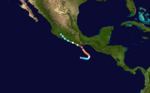
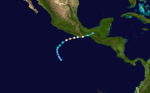
A tropical disturbance left Central America on September 22. Despite some wind shear, the system gradually became better organized and a tropical depression formed September 26, being upgraded to a tropical storm several hours later. The cyclone immediately moved north. Instead of strengthening into a hurricane before landfall as forecasted, Olaf weakened due to its proximity to land. On September 29, Olaf made landfall near Salina Cruz, Oaxaca.[37]
Olaf, as a tropical depression, moved westward, far out to sea. Operationally, Olaf was believed to have dissipated for six days. however, in the Tropical Cyclone Report, a report issued several months after the hurricane's duration, it was believed to have remained a tropical cyclone the entire time. After restrengthening slightly, Olaf moved southeast on October 5 due to the influence of Hurricane Pauline. Olaf then turned north, and on October 12 made a second landfall near Manzanillo, Colima, as a tropical depression. Olaf's surface circulation weakened, and its remnants moved back out to sea, but did not redevelop.[37]
Olaf resulted in some reports of damage and flooding in Mexico and Guatemala. During two time frames, from September 27 through October 2 and 10 through October 16, a total of 27.73 inches (704mm) of rainfall fell in association with Olaf in Soyalapa/Comaltepec.[38] Several people were reported missing. Most of its damage was from its first landfall.[37] Throughout southern Mexico, Guatemala and El Salvador, flooding caused by Olaf was blamed for eighteen deaths.[39]
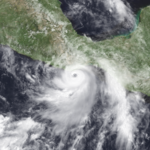
On October 3, a distinct area of disturbed weather formed. It drifted eastbound, and a well-defined low pressure soon formed. It became Tropical Depression Eighteen-E on October 5. Early the next day it intensified into tropical Storm Pauline. An eye feature developed on October 7 and as such Pauline was upgraded into a hurricane. In a favorable environment, the cyclone rapidly intensified, reaching Category4 intensity. After fluctuating in intensity, interaction with land weakened Pauline to a Category2 by the time it made landfall on October 9. It accelerated to the northwest, and passed over a mountainous region. The mountains disrupted Pauline's circulation, and squeezed the moisture from the hurricane. Pauline dissipated on October 10 while over Jalisco.[40]
Hurricane Pauline was the deadliest storm of the season. Landslides and flooding caused by heavy rain caused tragic loss of life and left thousands homeless. There were at least 230 casualties. The Red Cross reported that 400people died, but this was disputed by Mexican officials. Pauline was Mexico's deadliest hurricane since 1976's Liza.[40] In addition, the hurricane caused $447.8million in damage (1997USD; $473million 2008USD).[41]
Tropical Depression Three-C
Tropical depression(SSHWS)
Duration
October 6– October 7
Peak intensity
30mph (45km/h) (1-min);
A tropical disturbance formed near 140°W. It became Tropical Depression Three-C on October 6. The waters were very warm, and there was only moderate wind shear. However, the depression slowly moved westward without intensifying, and dissipated the next day.[4]
Towards the end of October, a tropical disturbance developed well to the southeast of the Hawaiian Islands and became better organized over the next few days, as it moved westwards along 10°N.[4][42] During October 31, after atmospheric convection had increased, the CPHC initiated advisories and designated the system as Tropical Depression Four-C.[42]
Although the waters were very warm, some dry air was located north of the system. It slowly moved westward without intensifying, and dissipated the next day as the circulation became exposed.[4]
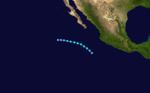
The first hurricane in November since 1991[3] formed from a tropical disturbance. Although the circulation was initially poorly defined, it later acquired enough organization and was classified as a tropical depression on November 7. It moved north until a trough of low pressure turned it to the northeast. It was named on November 8, and was upgraded to a hurricane the next day. It reached its peak intensity of 100mph (160km/h) and 973mbar (hPa). Rick made landfall in Oaxaca– the same area devastated by Hurricane Pauline one month earlier– and quickly weakened, dissipating early on November 11.[43]
The storm downed trees, washed out recently repaired roads, and disrupted communications in some small population centers. A total of 10.47 inches (266mm) of rain was reported at Astata/San Pedro Huameluca near the point of landfall in Mexico.[44] No one was killed.[43]
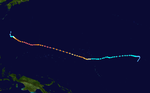
Tropical Depression Five-C formed on December 2, two days after the season ended. It was the second December tropical depression east of the dateline; 1983's Hurricane Winnie was the only other one.[3] The depression strengthened into Tropical Storm Paka (Hawaiian for Pat[4]) while west of Palmyra Atoll. The system began to move westward at a steady pace.[45] As Paka moved westward, dry air and wind shear disrupted its development until it crossed the dateline on December 6.[4]
After entering the Western Pacific, the cyclone encountered a more favorable environment, resulting in rapid intensification. It became a typhoon on December 10[46] and passed near Kwajalein with winds of 120mph (190km/h). It strengthened further, twice reaching Category5 intensity. While a super typhoon, Paka passed close to Guam on December 17, causing major damage. Afterwards, Paka encountered a hostile environment and had completely dissipated by the evening of December 22.[47]
The following list of names was used for named storms that formed in the North Pacific Ocean east of 140°W in 1997.[48] This is the same list used for the 1991 season except for Felicia, which replaced Fefa, and Dolores, which had been spelled "Delores" that year.[49] The name Felicia was used for the first time in 1997.[50]
For storms that form in the North Pacific from 140°W to the International Date Line, the names come from a series of four rotating lists. Names are used one after the other without regard to year, and when the bottom of one list is reached, the next named storm receives the name at the top of the next list.[48] Two named storms, listed below, formed in the central North Pacific in 1997. Named storms in the table above that crossed into the area during the year are noted (*).[4]
The World Meteorological Organization (WMO) retired the name Pauline in the spring of 1998 from future use in the Eastern Pacific on accounts of impacts in southern Mexico. It was replaced with Patricia for the 2003 season.[51][52] Later, in 2007, the WMO retired the name Paka from future use the Central Pacific due to its impacts on Guam. The name Pama was chosen as its replacement.[53][54]
Season effects
This is a table of all of the tropical cyclones that formed in the 1997 Pacific hurricane season. It includes their name, duration (within the basin), peak classification and intensities, areas affected, damage, and death totals. Deaths in parentheses are additional and indirect (an example of an indirect death would be a traffic accident), but were still related to that storm. Damage and deaths include totals while the storm was extratropical, a wave, or a low, and all of the damage figures are in 1997 USD.
↑ The last storm, Paka, did not dissipate on December 6. It crossed into the Western Pacific, and because it was the final storm of the season, the crossover date is listed on here as the dissipation date. December 23.
Related Research Articles
Typhoon Paka, known in the Philippines as Typhoon Rubing, was an extremely powerful and long-lived storm that devastated Guam and the Marshall Islands in December 1997. One of the strongest Pacific typhoons ever recorded in the month of December, Paka was the last tropical cyclone of the 1997 Pacific hurricane and typhoon seasons and the last of a record eleven super typhoons that formed in 1997. Paka, which is the Hawaiian name for Pat, developed on 28 November from a trough well to the southwest of Hawaii. The storm tracked generally westward for much of its duration, and on 7 December it crossed into the western Pacific Ocean. Much of its track was characterized by fluctuations in intensity, and on 10 December the cyclone attained typhoon status as it crossed the Marshall Islands. On 16 December, Paka struck Guam and Rota with winds of 230 km/h (140 mph), and it strengthened further to reach peak winds on 18 December over open waters as the final super typhoon of the year. Subsequently, it underwent a steady weakening trend, and on 23 December Paka dissipated.
The 2002 Pacific hurricane season was a near–average season which produced fifteen named storms. Eight hurricanes formed, including a record-equaling three Category 5 hurricanes, a record it shares with the 1994 and 2018 seasons. It was also a near-average season in terms of accumulated cyclone energy (ACE), having an ACE of 125. The season officially began on May 15, 2002 in the East Pacific Ocean, and on June 1, 2002 in the Central Pacific; both ended on November 30. These dates conventionally delimit the period of each year when most tropical cyclone formation occurs in these regions of the Pacific. The first system of the 2002 season, Hurricane Alma, formed on May 24, and the last, Tropical Depression Sixteen-E, dissipated on November 16.
The 1994 Pacific hurricane season was the final season of the eastern north Pacific's consecutive active hurricane seasons that started in 1982. The season officially started on May 15, 1994, in the eastern Pacific, and on June 1, 1994, in the central Pacific, and lasted until November 30, 1994. These dates conventionally delimit the period of each year when most tropical cyclones form in the northeastern Pacific Ocean. The first tropical cyclone formed on June 18, while the last system dissipated on October 26. This season, twenty-two tropical cyclones formed in the north Pacific Ocean east of the dateline, with all but two becoming tropical storms or hurricanes. A total of 10 hurricanes occurred, including five major hurricanes. The above average activity in 1994 was attributed to the formation of the 1994–95 El Niño.
The 1993 Pacific hurricane season included more than double the average number of major hurricanes – Category 3 or stronger cyclones on the Saffir–Simpson scale. This activity was the result of an El Niño event, which is the main factor contributing to above-average activity across the Pacific basin. The season featured 15 named storms, 11 hurricanes, and 9 major hurricanes. While the number of named storms was near the long-term average, the number of hurricanes was above the average of 8, and the number of major hurricanes far exceeded the long-term average of 4. Seasonal activity began on May 17 and ended on November 8, within the confines of a traditional hurricane season which begins on May 15 in the East Pacific and June 1 in the Central Pacific. The season ends on November 30 in both basins. These dates conventionally delimit the period during each year when most tropical cyclones form.
The 1989 Pacific hurricane season was a near normal season. It officially started on May 15, 1989, in the eastern Pacific, and on June 1, 1989, in the central Pacific, and lasted until November 30, 1989. These dates conventionally delimit the period of each year when most tropical cyclones form in the northeastern Pacific Ocean. A total of 18 storms and 9 hurricanes formed, which was near long-term averages. Four hurricanes reached major hurricane status on the Saffir–Simpson scale.
The 2000 Pacific typhoon season marked the first year using names contributed by the World Meteorological Organization. It was a rather below-average season, producing a total of 23 tropical storms, 13 typhoons and 4 intense typhoons. The season ran throughout 2000, though typically most tropical cyclones develop between May and October. The season's first named storm, Damrey, developed on May 7, while the season's last named storm, Soulik, dissipated on January 4 of the next year.
The 1998 Pacific typhoon season was the least active Pacific typhoon season on record, until it was surpassed 12 years later. It would produce 16 tropical storms, 8 strengthening into typhoons. The scope of this article is limited to the Pacific Ocean, north of the equator and west of the international date line. Storms that form east of the date line and north of the equator are called hurricanes; see 1998 Pacific hurricane season. Tropical Storms formed in the entire west Pacific basin were assigned a name by the Joint Typhoon Warning Center. Tropical depressions in this basin have the "W" suffix added to their number. Tropical depressions that enter or form in the Philippine area of responsibility are assigned a name by the Philippine Atmospheric, Geophysical and Astronomical Services Administration or PAGASA. This can often result in the same storm having two names.
The 1997 Pacific typhoon season was a record-breaking season featuring 11 tropical cyclones reaching super typhoon intensity, tying the record with 1965 with the most violent tropical cyclones globally, and was the ninth and last consecutive year of above-average tropical cyclone activity that started in 1989. Its extremely high activity produced a total of 570 ACE index, which is the highest ever index recorded in a single tropical cyclone season. In addition, this season had 10 Saffir-Simpson Category 5-equivalent tropical cyclones, the most ever recorded, even greater than the 2005 Atlantic hurricane season, which had nearly half of the amount. The 1997–98 El Niño event was a contributing factor to this unusually high activity. Despite this, the season produced an average number of tropical storms, spawning 29 tropical storms.
The 1996 Pacific typhoon season was a relatively active season, producing 30 tropical storms, 16 typhoons and six super typhoons. It has no official bounds; it ran year-round in 1996, but most tropical cyclones tend to form in the northwestern Pacific Ocean between May and November. These dates conventionally delimit the period of each year when most tropical cyclones form in the northwestern Pacific Ocean. However the first named storm, Ann, did not develop until April 3. The final named storm, Greg, dissipated on December 27.
The 1995 Pacific typhoon season was a slightly below average season in terms of named storms, ending a 6-year stretch of above average activity. It occurred all year round, though most tropical cyclones formed between May and November.
The 1992 Pacific typhoon season is the fourth consecutive above-average season, producing 31 tropical storms, 16 typhoons and five super typhoons. It had no official bounds; it ran year-round in 1992. Despite this, most tropical cyclones tend to form in the northwestern Pacific Ocean between May and November. These dates conventionally delimit the period of each year when most tropical cyclones form in the northwestern Pacific Ocean.
The 1991 Pacific typhoon season was a slightly above-average season with 29 tropical storms, 17 typhoons and five super typhoons forming. It was quite a catastrophic season – Typhoon Yunya impacted the Philippines in mid June while in the same time experiencing a volcanic eruption, Typhoon Mireille severely impacting Japan, which became known for being the costliest typhoon on record with US$10 billion worths of damages, and Tropical Storm Thelma on November which became one of the deadliest storms to strike the Philippines, killing at least over 5,000 people.
The 1987 Pacific typhoon season was a below average season, though it featured a relatively high amount of typhoons. It had no official bounds; it ran year-round in 1987, but most tropical cyclones formed between May and November. Tropical storms that formed in the entire basin were assigned a name by the Joint Typhoon Warning Center. Tropical depressions that enter or form in the Philippine area of responsibility are assigned a name by the Philippine Atmospheric, Geophysical and Astronomical Services Administration or PAGASA. This can often result in the same storm having two names.
The 1979 Pacific typhoon season featured the largest and most intense tropical cyclone recorded globally, Typhoon Tip. The season also used both male and female names as tropical cyclone names for the first time. Additionally, the season was slightly below-average in terms of tropical cyclone activity, with only 24 storms, 12 typhoons, and 4 super typhoons developing. The season had no official bounds; it ran year-round in 1979, but most tropical cyclones tend to form in the northwestern Pacific Ocean between June and December. These dates conventionally delimit the period of each year when most tropical cyclones form in the northwestern Pacific Ocean.
The 1970 Pacific typhoon season has no official bounds; it ran year-round in 1970, but most tropical cyclones tend to form in the northwestern Pacific Ocean between June and December. These dates conventionally delimit the period of each year when most tropical cyclones form in the northwestern Pacific Ocean.
The 1997 North Indian Ocean cyclone season had no bounds, but cyclones tend to form between April and December, with peaks in May and November. These dates conventionally delimit the period of each year when most tropical cyclones form in the northern Indian Ocean.
The 1998 North Indian Ocean cyclone season was an active season in annual cycle of tropical cyclone formation. The season has no official bounds but cyclones tend to form between April and December. These dates conventionally delimit the period of each year when most tropical cyclones form in the northern Indian Ocean. There are two main seas in the North Indian Ocean—the Bay of Bengal to the east of the Indian subcontinent and the Arabian Sea to the west of India. The official Regional Specialized Meteorological Centre in this basin is the India Meteorological Department (IMD), while the Joint Typhoon Warning Center releases unofficial advisories. An average of four to six storms form in the North Indian Ocean every season with peaks in May and November. Cyclones occurring between the meridians 45°E and 100°E are included in the season by the IMD.
Typhoon Oliwa was one of a record eleven super typhoons in the 1997 Pacific typhoon season. Oliwa formed in the central Pacific Ocean on September 2 to the southwest of Hawaii, but it became a typhoon in the western Pacific. Oliwa explosively intensified on September 8, increasing its winds from 85 mph to 160 mph in a 24‑hour period. Afterward, it slowly weakened, and after passing east of Okinawa, Oliwa turned northeast and struck Japan with winds of 85 mph (137 km/h). There, it affected 30,000 people and killed 12; thousands of houses were flooded, and some were destroyed. Offshore South Korea, the winds and waves wrecked 28 boats, while one boat went missing with a crew of 10 people. Oliwa dissipated on September 19 in northern Pacific Ocean near the International Date Line.
The 2019 Pacific hurricane season was an above average season which produced nineteen named storms, most of which were rather weak and short-lived. Only seven hurricanes formed, the fewest since 2010. The season officially began on May 15 in the East Pacific Ocean, and on June 1 in the Central Pacific; they both ended on November 30. These dates conventionally delimit the period of each year when most tropical cyclones form in the Pacific basin. This season was one of the latest-starting Pacific hurricane seasons on record, with the first tropical cyclone, Hurricane Alvin, forming on June 25. The final system, Tropical Depression Twenty-One-E, dissipated on November 18.
The year 1997 was regarded as one of the most intense tropical cyclone years on record, featuring a record 12 category 5-equivalent tropical cyclones, according to the Saffir–Simpson hurricane wind scale. The year also featured the second-highest amount of accumulated cyclone energy (ACE) on record, just behind 1992 and 2018. Throughout the year, 108 tropical cyclones have developed in bodies of water, commonly known as tropical cyclone basins. However, only 89 tropical cyclones were of those attaining 39 mph or greater, falling just below the long term average of 102 named systems. The most active basin was the Western Pacific, attaining an ACE amount of 571, the highest ever recorded in any season in any basin on record. The deadliest tropical cyclone was Severe Tropical Storm Linda (Openg). The costliest tropical cyclone was Super Typhoon Winnie (Ibiang), which set a record for having the largest eye on record. The most intense tropical cyclone was Hurricane Linda, peaking at 902 hPa/mbar. Typhoon Paka (Rubing), the longest-lived system, produced the fourth-highest ACE for a single tropical cyclone, just behind Typhoon Nancy (1961), Hurricane/Typhoon Ioke (2006), and Cyclone Freddy (2023). The accumulated cyclone energy (ACE) index for the 1997, as calculated by Colorado State University was 1,099.2 units.
1 2 Avilla, Lixion A; National Hurricane Center (September 16, 1997). Hurricane Jimena (Preliminary Report). United States National Oceanic and Atmospheric Administration's National Weather Service. Archived from the original on September 25, 2005. Retrieved June 24, 2012.
1 2 National Hurricane Operations Plan(PDF) (Report). Washington, D.C.: NOAA Office of the Federal Coordinator for Meteorological Services and Supporting Research. May 1997. pp.3-8–9. Retrieved January 13, 2024.
↑ National Hurricane Operations Plan(PDF) (Report). Washington, D.C.: NOAA Office of the Federal Coordinator for Meteorological Services and Supporting Research. April 1991. p.3-7. Retrieved February 3, 2024.
↑ National Hurricane Operations Plan(PDF) (Report). Washington, D.C.: NOAA Office of the Federal Coordinator for Meteorological Services and Supporting Research. May 2003. p.3-9. Retrieved January 30, 2024.
This page is based on this Wikipedia article Text is available under the CC BY-SA 4.0 license; additional terms may apply. Images, videos and audio are available under their respective licenses.


