This article's factual accuracy may be compromised due to out-of-date information.(January 2013) |
This is a list of notable Pacific hurricanes, subdivided by reason for notability. Notability means that it has met some criterion or achieved some statistic, or is part of a top ten for some superlative. It includes lists and rankings of Pacific hurricanes by different characteristics and impacts.
Characteristics include extremes of location, such as the northernmost or most equator-ward formation or position of a tropical cyclone. Other characteristics include its central pressure, windspeed, category on the Saffir–Simpson scale, cyclogenesis outside of a normal hurricane season's timeframe, or storms that remain unnamed despite forming after tropical cyclone naming began in 1960. Another characteristic is how long a system lasted from formation to dissipation. These include the cost of damage, the number of casualties, as well as meteorological statistics such as rainfall point maximum, wind speed, and minimum pressure.
The following names have been retired in the East Pacific (in chronological order): Hazel, Adele, Fico, Knut, Iva, Fefa, Ismael, Pauline, Adolph, Israel, Kenna, Alma, Manuel, Odile, Isis, Patricia, [1] Dora, and Otis. [2]
In addition, the following names have been retired in the Central Pacific (in chronological order): Iwa, Iniki, Paka, and Ioke. [1]
From the lists above, the names Hazel and Adele were retired for unclear reasons. [3] Also, the names Adolph, Israel, and Isis were retired because of political considerations. [1] In particular, the name Isis was pre-emptively removed in 2015 from the list of names for 2016 after being deemed inappropriate because of the eponymous militant group. [4]
Name | Year | Notes |
---|---|---|
"San Diego hurricane" | 1858 | Strongest tropical cyclone to affect California [5] |
Unnamed storm | 1871 | First and one of only three known hurricanes to make landfall on the Hawaiian Islands. [6] |
"California tropical storm" | 1939 | Only known modern landfall in California [7] |
"Cabo San Lucas hurricane" | 1941 | Deadliest hurricane to hit Cabo San Lucas in the 20th century [8] |
"Mazatlán hurricane" | 1943 | One of the strongest hurricanes to hit Mazatlán [9] |
"Texas hurricane" | 1949 | Most intense Pacific-Atlantic crossover [10] |
Hurricane Twelve | 1957 | Third-strongest Mexico landfall [9] |
"Mexico hurricane" | 1959 | Deadliest Pacific hurricane [11] |
Hurricane | Season | Fatalities | Ref. |
---|---|---|---|
"Mexico" | 1959 | 1,800 | [12] |
Paul | 1982 | 1,625 | [13] [14] [15] [16] |
Liza | 1976 | 1,263 | [17] [18] [19] |
Tara | 1961 | 436 | [20] |
Pauline | 1997 | 230–400 | [21] |
Agatha | 2010 | 204 | [22] [23] |
Manuel | 2013 | 169 | [24] |
Tico | 1983 | 141 | [25] [26] |
Ismael | 1995 | 116 | [27] |
"Lower California" | 1931 | 110 | [28] [29] |
"Mazatlán" | 1943 | 100 | [30] |
Lidia | 1981 | 100 | [23] |
The following tropical cyclones have caused at least $500 million in damage, according to various sources. Tropical cyclones listed here are listed with the value from the source providing the highest value. Due to source variation and inconsistency, sources may state damage totals lower than what is listed, or even lower than the $500 million threshold.
Storm | Season | Damage (USD) | Ref. |
---|---|---|---|
Otis | 2023 | $12–16 billion | [31] |
Manuel | 2013 | $4.2 billion | [32] |
Iniki | 1992 | $3.1 billion | [33] |
Odile | 2014 | $1.25 billion | [34] |
Agatha | 2010 | $1.1 billion | [35] |
Hilary | 2023 | $915 million | [36] |
Willa | 2018 | $825 million | [37] |
Madeline | 1998 | $750 million | [38] |
Rosa | 1994 | $700 million | [39] |
Paul | 1982 | $520 million | [40] [41] [42] |
Octave | 1983 | $512.5 million | [43] [44] |
In the Central Pacific Hurricane Center's (CPHC) area of responsibility (AOR), the season with the most tropical cyclones is the 2015 season with 16 cyclones forming in or entering the region. A season without cyclones has happened a few times since 1966, most recently in 1979. [45]
Year | NHC's AOR | CPHC's AOR | Total | ||||||
---|---|---|---|---|---|---|---|---|---|
Tropical storms | Hurricanes | Major hurricanes | Tropical storms | Hurricanes | Major hurricanes | Tropical storms | Hurricanes | Major hurricanes | |
1992 season | 24 | 14 | 8 | 3 | 2 | 2 | 27 | 16 | 10 |
2015 season | 18 | 13 | 10 | 8 | 3 | 1 | 26 | 16 | 11 |
1985 season | 22 | 12 | 8 | 2 | 2 | 0 | 24 | 14 | 8 |
2018 season | 22 | 12 | 9 | 1 | 1 | 1 | 23 | 13 | 10 |
1982 season | 19 | 11 | 5 | 4 | 1 | 0 | 23 | 12 | 5 |
2014 season | 20 | 15 | 7 | 2 | 1 | 2 | 22 | 16 | 9 |
2016 season | 20 | 12 | 5 | 2 | 2 | 1 | 22 | 13 | 6 |
1984 season | 18 | 12 | 6 | 3 | 1 | 1 | 21 | 13 | 7 |
1983 season | 21 | 12 | 8 | 0 | 0 | 0 | 21 | 12 | 8 |
1990 season | 20 | 16 | 6 | 1 | 0 | 0 | 21 | 16 | 6 |
Before 1971 and especially 1966, data in this basin is extremely unreliable. The geostationary satellite era began in 1966, [46] and that year is often considered the first year of reliable tropical records. [47] Intensity estimates are most reliable starting in the 1971 season. A few years later, the Dvorak technique came into use. Those two factors make intensity estimates more reliable starting in that year. [47] For these reasons, seasons prior to 1971 are not included.
Year | NHC's AOR | CPHC's AOR | Total | ||||||
---|---|---|---|---|---|---|---|---|---|
Tropical storms | Hurricanes | Major hurricanes | Tropical storms | Hurricanes | Major hurricanes | Tropical storms | Hurricanes | Major hurricanes | |
2010 season | 7 | 3 | 2 | 1 | 0 | 0 | 8 | 3 | 2 |
1977 season | 8 | 4 | 0 | 0 | 0 | 0 | 8 | 4 | 0 |
1996 season | 9 | 5 | 2 | 0 | 0 | 0 | 9 | 5 | 2 |
1999 season | 9 | 6 | 2 | 0 | 0 | 0 | 9 | 6 | 2 |
1995 season | 10 | 7 | 3 | 0 | 0 | 0 | 10 | 7 | 3 |
1979 season | 10 | 6 | 4 | 0 | 0 | 0 | 10 | 6 | 4 |
Earliest and next earliest forming Pacific tropical /subtropical storms by storm number | ||||
---|---|---|---|---|
Storm number | Earliest | Next earliest | ||
Name | Date of formation | Name | Date of formation | |
1 | Pali | January 7, 2016 | Winona [ specify ] | January 13, 1989 |
2 | Hali | March 29, 1992 | Bud | May 22, 2012 |
3 | Agatha | June 2, 1992 | Connie | June 8, 1974 |
4 | Four | June 12, 1956 | Dolores | June 14, 1974 |
5 | Celia | June 23, 1992 | Enrique | June 25, 2021 |
6 | Fabio | July 1, 2018 | Fefa [lower-alpha 1] | July 3, 1985 |
7 | Genevieve | July 7, 1984 | Guillermo | July 8, 1985 |
8 | Enrique | July 13, 2015 | Frank | July 14, 1992 |
9 | Georgette | July 15, 1992 | Ignacio [lower-alpha 2] | July 21, 1985 |
10 | Jimena | July 21, 1985 | Howard | July 27, 1992 |
11 | Isis | July 28, 1992 | Kevin | July 29, 1985 |
12 | Linda | July 31, 1985 | Javier | August 2, 1992 |
13 | Marty | August 7, 1985 | Lowell | August 18, 2014 |
14 | Lester | August 20, 1992 | Nora | August 21, 1985 |
15 | Olaf | August 24, 1985 | Jimena | August 27, 2015 |
16 | Newton | August 28, 1992 | Pauline [lower-alpha 3] | August 31, 1985 |
17 | Skip [ specify ] [lower-alpha 3] | August 31, 1985 | Orlene | September 3, 1992 |
18 | Rick | September 2, 1985 | Iniki | September 8, 1992 |
19 | Sandra | September 7, 1985 | Paine | September 11, 1992 |
20 | Roslyn | September 14, 1992 | Terry | September 16, 1985 |
21 | Seymour | September 18, 1992 [lower-alpha 4] | Vivian | September 20, 1985 |
22 | Tina | September 18, 1992 [lower-alpha 4] | Waldo | October 7, 1985 |
23 | Virgil | October 1, 1992 | Olaf | October 17, 2015 |
24 | Winifred | October 7, 1992 | Patricia | October 21, 2015 |
25 | Xavier | October 14, 1992 | Rick | November 19, 2015 |
26 | Yolanda | October 16, 1992 | Sandra | November 24, 2015 |
27 | Zeke | October 26, 1992 | Earliest formation by virtue of being the only of that number |
Naming of tropical cyclones in the eastern north Pacific began in the 1960 season. That year, four lists of names were created. The plan was to proceed in a manner similar to that of the western Pacific; that is, the name of the first storm in one season would be the next unused one from the same list, and when the bottom of one list was reached the next list was started. This scheme was abandoned in 1965 and next year, the lists started being recycled on a four-year rotation, starting with the A name each year. [48] That same general scheme remains in use today, although the names and lists are different. On average, the eastern north Pacific sees about sixteen named storms per year. [49]
Specific seasonal data in the Eastern Pacific basin was first compiled in 1949. [50] Therefore, seasons before 1949 are excluded from the "Most named" column.
Also, before 1971 and especially 1966, data in this basin is extremely unreliable. The geostationary satellite era began in 1966, [46] and that year is often considered the first year of reliable tropical records. [47] Intensity estimates are more reliable starting in the 1971 season. A few years later, the Dvorak technique came into use. Those two make intensity estimates more reliable starting in that year. [47] For these reasons, seasons before 1971 are not included in the "Least named" column.
† Shared by more than five seasons. Source: [50]
Month | Most named | Least named | ||
---|---|---|---|---|
Number | Season | Number | Season | |
Pre-season | 2 | 1992 | 0 | Many† |
Late May | 2 | 1956 1984 2007 2012 2013 | 0 | Many† |
June | 5 | 1985 2018 | 0 | 2004 2006 2007 2016 2024 |
July | 7 | 1985 2015 2016 | 0 | 2010 |
August | 9 | 1968 | 0 | 1996 |
September | 6 | Many† [lower-alpha 5] | 1 | 1979 2010 2011 2021 |
October | 5 | 1992 2023 | 0 | 1989 1995 1996 2005 2010 |
November | 2 | Many† [lower-alpha 6] | 0 | Many† |
Post-season | 1 | 1983 1997 2010 | 0 | Many† |
The Pacific hurricane season runs from May 15 to November 30. [51] Only systems that develop or enter during the off-season are included. The earliest off-season storm is Pali in 2016 whilst the latest off-season storm was Nine-C during 2015.
Name | Formation date | Ref. |
---|---|---|
Unnamed | December 1832 | [52] |
"Froc Cyclone" | December 23, 1902 | [53] |
"Hurd Cyclone" | December 23, 1904 | [53] |
Unnamed | May 3, 1906 | [53] |
Unnamed | February 6, 1922 | [54] |
Nine | December 22, 1925 | [55] |
Eight | December 4, 1936 | [56] |
Carmen | April 4, 1980† | [57] |
Winnie | December 4, 1983 | [50] |
Winona | January 9, 1989 | [58] |
Alma | May 12, 1990 | [50] |
Ekeka | January 26, 1992 | [59] |
Hali | March 28, 1992 | [50] |
One-E | May 13, 1996 | [50] |
Omeka | December 20, 2010 | [50] |
Aletta | May 14, 2012 | [50] |
Nine-C | December 31, 2015 | [60] |
Pali | January 7, 2016 | [61] |
Adrian | May 9, 2017 | [62] |
One-E | May 10, 2018 | [63] |
One-E | April 25, 2020 | |
Andres | May 9, 2021 |
†Entered the basin on this date
Tropical cyclones have received official names in the Eastern and Central Pacific beginning in 1960. Since then, 6 tropical storms or hurricanes have formed that did not receive a storm name. (Note: The "2006 Central Pacific cyclone" is excluded, as its status has never been officially determined.)
Since 1959, 20 Pacific hurricanes have attained Category 5 intensity. The only one to make landfall while at this intensity was Otis in 2023. [50]
Since 1900, 141 Pacific hurricanes have attained Category 4 intensity, of which five made landfall at that strength. [50]
Since 1970, 86 Pacific hurricanes have attained Category 3 intensity, of which three made landfall at that strength. [50]
This lists all Pacific hurricanes that existed as tropical cyclones while in the Pacific Ocean east of the dateline for more than two weeks continuously. Hurricanes John and Dora spent some time in the west Pacific before dissipating. John spent eleven days west of the dateline; if that time was included John would have existed for a total of 30 days and 18 hours, while including Dora's time in the west Pacific would mean that it existed for 18 days. [50] One Atlantic hurricane, Hurricane Joan, crossed into this basin and was renamed Miriam, [64] giving it a total lifespan of 22 days, [65] but not all of that was in the Pacific. 1993's Greg formed from the remnants of Tropical Storm Bret (1993). [64] Its time as an Atlantic system is excluded.
All of these systems except Trudy, Olaf, and Connie existed in both the east and central Pacific, and all except Olaf were hurricanes. Hurricane Trudy of 1990 is thus the longest lived eastern Pacific hurricane to stay in the eastern Pacific. Tropical Storm Olaf of 1997 is hence the longest-lived eastern Pacific tropical cyclone not to reach hurricane intensity. [50]
No known tropical cyclone forming in the central north Pacific lasted for longer than 14 days without crossing into another basin. [50] The tropical cyclone forming in the central Pacific that spent the most time there was Hurricane Ana (2014) at 12.75 days from formation to extratropical transition. [66] [67]
Rank | Duration (days) | Name | Season |
---|---|---|---|
1 | 24.50 | Tina | 1992 |
2 | 20.00 | Fico | 1978 |
3 | 19.00 | John | 1994 |
4 | 17.50 | Kevin | 1991 |
5 | 16.75 | Trudy | 1990 |
6 | 16.50 | Guillermo | 1997 |
16.50 | Olaf | 1997 | |
8 | 16.25 | Celeste | 1972 |
16.25 | Doreen | 1973 | |
16.25 | Kenneth | 2005 | |
11 | 16.00 | Daniel | 1982 |
12 | 15.25 | Connie | 1974 |
13 | 14.50 | Jimena | 2015 |
14.50 | Darby | 2016 | |
15 | 14.00 | Marie | 1990 |
14.00 | Greg | 1993 | |
14.00 | Dora | 1999 | |
14.00 | Lane | 2018 | |
14.00 | Olivia | 2018 |
Before the weather satellite era began, the lifespans of many Pacific hurricanes may be underestimated. [47]
This includes only systems which stayed a tropical cyclone during the passage or that maintained a circulation during the crossover.
Season | Storm (Atlantic) | Storm (Pacific) | Ref. |
---|---|---|---|
1876 | Four | Unnamed | [65] |
1911 | Four | Unnumbered tropical depression | [65] |
1945 | Ten | Unnumbered tropical depression | [68] |
1971 | Irene | Olivia | [69] |
1974 | Fifi | Orlene | [65] |
1977 | Anita | Eleven-E | [70] |
1978 | Greta | Olivia | [71] |
1988 | Debby | Seventeen-E | [72] [73] |
Joan | Miriam | [74] | |
1990 | Diana | Unnumbered tropical depression | [75] |
1993 | Gert | Fourteen-E | [76] |
1996 | Cesar | Douglas | [77] |
Dolly | Unnumbered tropical depression | [78] | |
2016 | [79] | ||
2022 | [80] | ||
[81] |
It used to be that when a Pacific named storm crossed North America and made it to the Atlantic (or vice versa), it would receive the next name on the respective basin's list. However, in 2000 this policy was changed so that a tropical cyclone will keep its name if it remains a tropical cyclone during the entire passage. Only if it dissipates and then re-forms does it get renamed. [82]
This includes only systems which stayed a tropical cyclone during the passage or that maintained a circulation during the crossover.
Season | Storm (Pacific) | Storm (Atlantic) | Ref. |
---|---|---|---|
1842 | Unnamed | Unnamed | [83] |
1902 | Unnumbered tropical depression | Four | [84] |
1923 | Unnamed | Six | [85] |
1949 | Unnumbered tropical depression | Eleven | [64] |
2010 | Eleven-E | Hermine | [86] |
Neither eastern Pacific tropical cyclones passing 140°W, nor central Pacific tropical cyclones crossing the dateline, are notable events. However, very few eastern Pacific proper cyclones that enter the central Pacific make it to the dateline.
Season | Name | Ref. |
---|---|---|
1986 | Georgette † | [87] |
1991 | Enrique | [88] |
1994 | Li‡ | [89] |
John | [90] | |
1999 | Dora | [91] |
2014 | Genevieve † | [92] |
2018 | Hector | [93] |
2023 | Dora | [94] |
† System ceased to be a tropical cyclone and regenerated at least once during its life span.
‡ System formed in the eastern Pacific, but was not named until it crossed into the central Pacific.
In addition, Hurricane Jimena of 2003 is recognized per NHC, CPHC and JTWC as a storm that existed in all three areas of responsibility, but isn't recognized by the JMA as an official western Pacific tropical cyclone. [95] [96] [97]
Tropical cyclones crossing from the western Pacific to the central Pacific are fairly rare, and this has happened only ten times. Of those ten times, six of them were storms which crossed the dateline twice; from the western to the central pacific and back (or vice versa). No tropical cyclone from the western Pacific has ever traveled east of 140°W.
Season | Name | Ref. |
---|---|---|
1958 | June † | [98] |
1959 | Patsy † | [99] |
1968 | Virginia | [100] |
1980 | Carmen † | [57] [101] |
1984 | Moke | [96] |
1985 | Skip † | [102] |
1994 | John †* | [103] |
1996 | Seventeen-W † | [104] |
2000 | Wene | [105] |
2010 | Omeka | [106] |
† System crossed the dateline twice.
* Hurricane/Typhoon John formed in the eastern Pacific.
Tropical cyclones crossing from the eastern Pacific to the central Pacific are routine; ones going the other way are not. That event has happened four times.
Season | Name | Ref. |
---|---|---|
1975 | Unnamed | [50] |
1982 | Ema | [50] |
2015 | Olaf † | [107] |
2016 | Ulika † | [108] |
† System crossed 140°W more than once.
In addition to these, an unofficial cyclone formed on October 30, 2006 in the central Pacific subtropics. It eventually developed an eye-like structure. [109] Its track data indicates that it crossed from the central to the east Pacific because it formed at longitude 149°W and dissipated at 135°W. [110] NASA, which is not a meteorological organization, called this system a subtropical cyclone, and the Naval Research Laboratory Monterey had enough interest in it to call it 91C. [109] The system has also been called extratropical. [111] This cyclone is unofficial because it is not included in the seasonal reports of either Regional Specialized Meteorological Center. [112] [113]
The apparent increase in recent seasons is spurious; it is due to better estimation and measurement, not an increase in intense storms. That is, until 1988, Pacific hurricanes generally did not have their central pressures measured or estimated from satellite imagery.
Rank | Hurricane | Year | Pressure |
---|---|---|---|
1 | Patricia | 2015 | 872 mbar ‡ |
2 | Linda | 1997 | 902 mbar* |
3 | Rick | 2009 | 906 mbar* |
4 | Kenna | 2002 | 913 mbar‡ |
5 | Ava | 1973 | 915 mbar† |
Ioke | 2006 | 915 mbar* | |
7 | Marie | 2014 | 918 mbar* |
Odile | 918 mbar‡ | ||
9 | Guillermo | 1997 | 919 mbar* |
10 | Gilma | 1994 | 920 mbar* |
* Estimated from satellite imagery
‡ Measured and adjusted
† Measured
~ Pressure while East of the International Date Line
Rank | Hurricane | Year | Winds |
---|---|---|---|
1 | Patricia | 2015 | 215 mph; 345 km/h |
2 | Linda | 1997 | 185 mph; 295 km/h |
3 | Rick | 2009 | 180 mph; 285 km/h |
4 | Patsy | 1959 | 175 mph; 280 km/h |
John | 1994 | 175 mph; 280 km/h | |
6 | Kenna | 2002 | 165 mph; 270 km/h |
Otis | 2023 | 165 mph; 270 km/h |
Intensity is measured solely by central pressure unless the pressure is not known, in which case intensity is measured by maximum sustained winds.
Month | Name | Year | Minimum pressure | Maximum winds | Classification |
---|---|---|---|---|---|
January | Pali | 2016 | 977 mb (hPa) | 100 mph (155 km/h) | Category 2 |
February | Ekeka † | 1992 | ≤ 985 mb (hPa) | 115 mph (185 km/h) | Category 3 |
March | Hali † | 1992 | 1005 mb (hPa) | 50 mph (85 km/h) | Tropical storm |
April | Carmen † | 1980 | unknown mb (hPa) [57] | 50 mph (85 km/h) | Tropical storm |
May | Amanda | 2014 | 932 mb (hPa) | 155 mph (250 km/h) | Category 4 |
June | Ava | 1973 | 915 mb (hPa) | 160 mph (260 km/h) | Category 5 |
July | Gilma | 1994 | 920 mb (hPa) | 160 mph (260 km/h) | Category 5 |
August | Ioke | 2006 | 915 mb (hPa) | 160 mph (260 km/h) | Category 5 |
September | Linda | 1997 | 902 mb (hPa) | 185 mph (295 km/h) | Category 5 |
October | Patricia | 2015 | 872 mb (hPa) | 215 mph (345 km/h) | Category 5 |
November | Sandra | 2015 | 934 mb (hPa) | 150 mph (240 km/h) | Category 4 |
December | Omeka | 2010 | 997 mb (hPa) | 50 mph (85 km/h) | Tropical storm |
† This tropical cyclone is the strongest to form in its month by virtue of its being the only known system.
Hurricane | Season | Wind speed | Ref. |
---|---|---|---|
Otis | 2023 | 160 mph (260 km/h) | [114] |
Patricia | 2015 | 150 mph (240 km/h) | [115] |
Madeline | 1976 | 145 mph (230 km/h) | [116] |
Iniki | 1992 | [59] | |
Twelve | 1957 | 140 mph (220 km/h) | [117] |
"Mexico" | 1959 | [117] | |
Kenna | 2002 | [118] | |
Lidia | 2023 | [119] |
All of these values are point maxima.
Precipitation | Storm | Location | Ref. | ||
---|---|---|---|---|---|
Rank | mm | in | |||
1 | 1011 | 39.80 | Juliette 2001 | Cuadano/Santiago | [132] |
2 | 686.0 | 27.01 | Pauline 1997 | San Luis Acatlan | [133] |
3 | 628.1 | 24.73 | Odile 1984 | Costa Azul/Acapulco | [134] |
4 | 610.1 | 24.02 | Isis 1998 | Caduano/Santiago | [135] |
5 | 570.0 | 22.44 | Flossie 2001 | Suchixtlahuaca | [136] |
6 | 566.9 | 22.32 | Greg 1999 | Tecoman | [137] |
7 | 531.9 | 20.94 | Nora 1997 | La Cruz/Elota | [138] |
8 | 525.3 | 20.68 | Eugene 1987 | Aquila | [139] |
9 | 523.0 | 20.59 | Lidia 1981 | El Varonjal/Badiraguato | [140] |
10 | 500.1 | 19.69 | Ignacio 2003 | Yeneca/Los Cabos | [141] |
Precipitation | Storm | Location | Ref. | ||
---|---|---|---|---|---|
Rank | mm | in | |||
1 | 1473 | 58.00 | Lane 2018 | Kahūnā Falls, Hawaii | [142] |
2 | 1321 | 52.00 | Hiki 1950 | Kanalohuluhulu Ranger Station | [143] |
3 | 985 | 38.76 | Paul 2000 | Kapapala Ranch 36 | [144] |
4 | 700 | 28.82 | Hone 2024 | Hakalau | [145] |
5 | 635 | 25.00 | Maggie 1970 | Various stations | [146] |
6 | 519 | 20.42 | Nina 1957 | Wainiha | [147] |
7 | 516 | 20.33 | Iwa 1982 | Intake Wainiha 1086 | [148] |
8 | 476 | 18.75 | Fabio 1988 | Papaikou Mauka 140.1 | [148] |
9 | 387 | 15.25 | Iselle 2014 | Kulani NWR | [149] |
10 | 381 | 15.00 | One-C 1994 | Waiākea-Uka, Piihonua | [103] |
Precipitation | Storm | Location | Ref. | ||
---|---|---|---|---|---|
Rank | mm | in | |||
1 | 533.7 mm | 21.01 in | Norma 1981 | Breckenridge, Texas | [150] |
2 | 430.5 mm | 16.95 in | Tico 1983 | Chickasha, Oklahoma | [151] |
3 | 374.9 mm | 14.76 in | Kathleen 1976 | Mount San Gorgonio, California | [152] |
4 | 350.5 mm | 13.80 in | Roslyn 1986 | Matagorda Texas #2 | [153] |
5 | 305.1 mm | 12.01 in | Nora 1997 | Harquahala Mountains, Arizona | [138] |
6 | 304.8 mm | 12.00 in | Octave 1983 | Mount Graham, Arizona | [154] |
7 | 302.8 mm | 11.92 in | Norma 1970 | Workman Creek, Arizona | [155] |
8 | 294.6 mm | 11.60 in | Unnamed 1939 | Mount Wilson (California) | [156] |
9 | 288.3 mm | 11.35 in | Paine 1986 | Fort Scott, Kansas | [157] |
10 | 216.7 mm | 8.53 in | Ismael 1995 | Hobbs, New Mexico | [158] |
Precipitation | Storm | Location | Ref. | ||
---|---|---|---|---|---|
Rank | mm | in | |||
1 | 1321 | 52.02 | Lane 2018 | Mountainview, Hawaii | [159] |
2 | 1321 | 52.00 | Hiki 1950 | Kanalohuluhulu Ranger Station, Hawaii | [53] |
3 | 1011 | 39.80 | Juliette 2001 | Cuadano/Santiago, Mexico | [132] |
4 | 984.5 | 38.76 | Paul 2000 | Kapapala Ranch, Hawaii | [160] |
5 | 732.0 | 28.82 | Hone 2024 | Hakalau, Hawaii | [145] |
6 | 686.0 | 27.01 | Pauline 1997 | San Luis Acatlan, Mexico | [133] |
7 | 635.0 | 25.00 | Maggie 1970 | Hawaii | [161] |
8 | 628.1 | 24.73 | Odile 1984 | Costa Azul/Acapulco, Mexico | [134] |
9 | 610.1 | 24.02 | Isis 1998 | Caduano/Santiago, Mexico | [135] |
10 | 570.0 | 22.44 | Flossie 2001 | Suchixtlahuaca, Mexico | [136] |
The 1960 Atlantic hurricane season was the least active season since 1952. The season officially began on June 15, and lasted until November 15. These dates conventionally delimit the period of each year when most tropical cyclones form in the Atlantic basin. The first system, an unnamed storm, developed in the Bay of Campeche on June 22. It brought severe local flooding to southeastern Texas and was considered the worst disaster in some towns since a Hurricane in 1945. The unnamed storm moved across the United States for almost a week before dissipating on June 29. In July, Hurricane Abby resulted in minor damage in the Leeward Islands, before impacting a few Central American counties — the remnants of the storm would go on to form Hurricane Celeste in the East Pacific. Later that month, Tropical Storm Brenda caused flooding across much of the East Coast of the United States. The next storm, Hurricane Cleo, caused no known impact, despite its close proximity to land.
The 1971 Atlantic hurricane season was an active Atlantic hurricane season overall, producing 13 named storms, of which 6 strengthened into hurricanes. The season officially began on June 1, 1971, and lasted until November 30, 1971. These dates conventionally delimit the period of each year when most tropical cyclones form in the Atlantic basin. This season, the first storm, Arlene, developed on July 4, while the last, Laura, dissipated on November 22.
The 1988 Atlantic hurricane season was a near average season that proved costly and deadly, with 15 tropical cyclones directly affecting land. The season officially began on June 1, 1988, and lasted until November 30, 1988, although activity began on May 30 when a tropical depression developed in the Caribbean. The June through November dates conventionally delimit the period of each year when most tropical cyclones form in the Atlantic basin. The first cyclone to attain tropical storm status was Alberto on August 8, nearly a month later than usual. The final storm of the year, Tropical Storm Keith, became extratropical on November 24. The season produced 19 tropical depressions of which 12 attained tropical storm status. One tropical storm was operationally classified as a tropical depression but was reclassified in post-analysis. Five tropical cyclones reached hurricane status of which three became major hurricanes reaching Category 3 on the Saffir–Simpson scale. It was later surpassed 34 years later until the 2022 Atlantic hurricane season, to have Atlantic-Pacific crossover.
Hurricane Iwa, taken from the Hawaiian language name for the frigatebird, was at the time the costliest hurricane to affect the state of Hawaiʻi. Iwa was the twenty-third tropical storm and the twelfth and final hurricane of the 1982 Pacific hurricane season. It developed from an active trough of low pressure near the equator on November 19. The storm moved erratically northward until becoming a hurricane on November 23 when it began accelerating to the northeast in response to strong upper-level flow from the north. Iwa passed within 25 miles of the island of Kauaʻi with peak winds of 90 mph (140 km/h) on November 23, and the next day it became extratropical to the northeast of the state.
The 2003 Pacific hurricane season was the first season to feature no major hurricanes since 1977. The season officially began on May 15, 2003 in the Eastern North Pacific, and on June 1 in the Central ; both ended on November 30. These dates, adopted by convention, historically describe the period in each year when most tropical cyclogenesis occurs in these regions of the Pacific. The season featured 16 tropical storms, 7 of which intensified into hurricanes, which was then considered an average season. Damage across the basin reached US$129 million, and 23 people were killed by the storms.
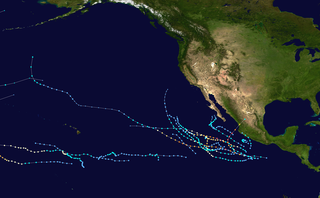
The 2002 Pacific hurricane season was an average season which produced fifteen named storms. Eight hurricanes formed, including a record-equaling three Category 5 hurricanes, a record it shares with the 1994 and 2018 seasons. It was also a near-average season in terms of accumulated cyclone energy (ACE), having an ACE of 125. The season officially began on May 15, 2002 in the East Pacific Ocean, and on June 1, 2002 in the Central Pacific; both ended on November 30. These dates conventionally delimit the period of each year when most tropical cyclone formation occurs in these regions of the Pacific. The first system of the 2002 season, Hurricane Alma, formed on May 24, and the last, Tropical Depression Sixteen-E, dissipated on November 16.
The 1997 Pacific hurricane season was a very active hurricane season. With hundreds of deaths and hundreds of millions of dollars in damage, this was one of the deadliest and costliest Pacific hurricane seasons on record. This was due to the exceptionally strong 1997–98 El Niño event. The season officially started on May 15, in the eastern Pacific, and on June 1, in the central Pacific, and lasted until November 30. These dates conventionally delimit the period of each year when almost all tropical cyclones form in the northeastern Pacific Ocean.
The 1994 Pacific hurricane season was the final season of the eastern north Pacific's consecutive active hurricane seasons that started in 1982. The season officially started on May 15, 1994, in the eastern Pacific, and on June 1, 1994, in the central Pacific, and lasted until November 30, 1994. These dates conventionally delimit the period of each year when most tropical cyclones form in the northeastern Pacific Ocean. The first tropical cyclone formed on June 18, while the last system dissipated on October 26. This season, twenty-two tropical cyclones formed in the north Pacific Ocean east of the dateline, with all but two becoming tropical storms or hurricanes. A total of 10 hurricanes occurred, including five major hurricanes. The above average activity in 1994 was attributed to the formation of the 1994–95 El Niño.
The 1986 Pacific hurricane season featured several tropical cyclones that contributed to significant flooding to the Central United States. The hurricane season officially started May 15, 1986, in the eastern Pacific, and June 1, 1986 in the central Pacific, and lasted until November 30, 1986 in both regions. These dates conventionally delimit the period of each year when most tropical cyclones form in the northeastern Pacific Ocean. A total of 17 named storms and 9 hurricanes developed during the season; this is slightly above the averages of 15 named storms and 8 hurricanes, respectively. In addition, 26 tropical depressions formed in the eastern Pacific during 1986, which, at the time, was the second most ever recorded; only the 1982 Pacific hurricane season saw a higher total.
The 1973 Pacific hurricane season was a below average, with twelve named tropical cyclones in total. Seven storms became hurricanes, of which three were major. The season officially started May 15, 1973, in the eastern Pacific, and June 1, 1973, in the central Pacific, and lasted until November 30, 1973. These dates conventionally delimit the period of each year when most tropical cyclones form in the northeastern Pacific Ocean.
Tropical Storm Frances caused extensive flooding in Mexico and Texas in September 1998. The sixth tropical cyclone and sixth named storm of the annual hurricane season, Frances developed from a low pressure area in the Gulf of Mexico on September 8. The cyclone moved northward through the western Gulf of Mexico, making landfall across the central Texas coastline before recurving across the Midwest through southeast Canada and New England. A large tropical cyclone for the Atlantic basin, yet an average sized system by western Pacific standards, the storm produced heavy rains across the Isthmus of Tehuantepec, Texas, western Louisiana and the Great Plains.
Hurricane Nina was the final tropical storm and hurricane of the 1957 Pacific hurricane season and the last storm to form during the active Central Pacific hurricane season this year. This storm was named "Nina" because during this time, hurricanes in this basin were given names from the typhoon naming lists. This storm was the last to form during a series of typhoons and hurricanes to form in the Pacific in November.
Mexico tropical cyclone rainfall climatology discusses precipitation characteristics of tropical cyclones that have struck Mexico over the years. One-third of the annual rainfall received along the Mexican Riviera and up to half of the rainfall received in Baja California Sur is directly attributable to tropical cyclones moving up the west coast of Mexico. The central plateau is shielded from the high rainfall amounts seen on the oceanward slopes of the Sierra Madre Oriental and Occidental mountain chains.
Hurricane Hiki was the third-wettest tropical cyclone on record in the United States, behind Hurricane Lane in 2018, and Hurricane Harvey in 2017. It was also considered the first official hurricane in the vicinity of the Hawaiian Islands. The fourth tropical cyclone of the 1950 Pacific hurricane season, Hiki formed as a tropical depression to the southeast of Hawaii on August 12. On the following day, the depression headed northwestward and intensified into Tropical Storm Hiki. While paralleling the Hawaiian Islands on August 16, Hiki strengthened into a hurricane. Around that time, the storm peaked with maximum sustained winds of 85 mph (140 km/h). The following day, Hiki curved southwestward on August 17. Two days later, the hurricane resumed moving northwestward and weakened to a tropical storm shortly thereafter. Around midday on August 21, Hiki weakened to a tropical depression and dissipated about six hours later.
Hurricane Eugene was the only tropical cyclone to make landfall in Mexico during the 1987 Pacific hurricane season. The eighth tropical cyclone, fifth named storm, and first hurricane of the season, Eugene developed on July 22 from a tropical disturbance centered well offshore of Mexico. Later that day, the system intensified into a tropical storm while moving northwestward. Eugene reached hurricane status on July 24; it briefly peaked as a Category 2 hurricane the next day. Hurricane Eugene weakened back to a Category 1 hurricane; subsequently, the hurricane made landfall near Manzanillo. Shortly after landfall, Eugene rapidly weakened inland, and was only a tropical storm when it re-emerged into open water, where it quickly dissipated. Throughout southwestern Mexico, the storm produced high winds, especially in the southwestern portion of the country. The hurricane deluged the southwest Mexican coastline, resulting in the highest rainfall totals from a tropical cyclone in five Mexican states. Over 5,000 people were left homeless, including 60 in Manzanillo. The city's airport control tower was also damaged, requiring closure. Elsewhere, 200 to 300 houses were destroyed in Colima. In all, Eugene injured 18 people, and caused three fatalities and $142.12 million (1987 USD) in damage.
Hurricane Iselle was the strongest tropical cyclone to make landfall on the island of Hawaii in recorded history. The tenth named storm, fifth hurricane, and fourth major hurricane of the 2014 hurricane season, Iselle developed from an area of disturbed weather southwest of Mexico on July 31, 2014. Assuming a west-northwest course that it would maintain throughout its existence, generally favorable atmospheric conditions allowed for gradual strengthening, with the cyclone attaining hurricane status a day after formation. Continued strengthening progressed for several days up until August 4, when Iselle reached peak intensity with maximum sustained winds of 140 mph (220 km/h) and a minimum barometric pressure of 947 mbar, making it a Category 4 hurricane. Thereafter, Iselle encountered hostile environmental conditions and quickly weakened before making landfall on the Big Island on August 8 as a moderate tropical storm. Its passage over the island disrupted the cyclone, and Iselle later dissipated on August 9.