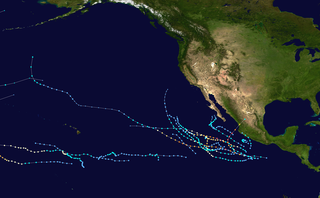
1966 Pacific hurricane season

Last updated
1966 Pacific hurricane season
1966 Pacific hurricane season summary map.png
Season summary map
Seasonal boundaries
First system formedJune 12, 1966
Last system dissipatedOctober 19, 1966
Strongest storm
Name Connie and Dolores
  Maximum winds85 mph (140 km/h)
(1-minute sustained)
  Lowest pressure981 mbar (hPa; 28.97 inHg)
Seasonal statistics
Total depressions18
Total storms13
Hurricanes8
Major hurricanes
(Cat. 3+)
0
Total fatalities9+
Total damage$5.6 million (1966 USD)
Related articles
Pacific hurricane seasons
1964, 1965, 1966, 1967, 1968

The 1966 Pacific hurricane season started on May 15, 1966, and ended November 30, 1966. The season was of little note. Hurricane Blanca traveled 4,300 miles, setting a new record. During September and October of the year, Hurricane Helga and Tropical Storms Kirsten, Lorraine, and Maggie hitting Mexico. Kirsten caused 8 deaths and US$5.6 million (equivalent to $50.51 million in 2022) in damages in Mexico.

Contents

Systems

Tropical Storm Kirsten (1966)Saffir–Simpson Hurricane Scale1966 Pacific hurricane season

Hurricane Adele

Category 1 hurricane (SSHWS)
Adele 1966 track.png  
DurationJune 20 – June 24
Peak intensity85 mph (140 km/h) (1-min);
982  mbar  (hPa)

On the morning of June 20, the first tropical depression of the season formed south of Mexico. It initially went west-northwestward. On the afternoon of June 21, the depression strengthened into a tropical storm and was named Adele. It continued north until the evening of June 22, when it strengthened into a category 1 hurricane and sharply recurved west. It made landfall west of Manzanillo, Mexico on the evening of June 24 and dissipated that day. Extensive damage was caused by Adele in Mexico but no deaths were reported. Adele was the shortest lived hurricane of the season. [1]

Tropical Depression Two

Tropical depression (SSHWS)
2-E 1966 track.png  
DurationJune 28 – June 30
Peak intensity30 mph (45 km/h) (1-min);

On June 28, a tropical depression formed west of Central America. It remained weak and dissipated two days later, never threatening land. Tropical Depression Two caused no reports of damages or deaths. [2]

Tropical Depression Three

Tropical depression (SSHWS)
3-E 1966 track.png  
DurationJuly 11 – July 11
Peak intensity30 mph (45 km/h) (1-min);

[2]

Hurricane Blanca

Category 1 hurricane (SSHWS)
Blanca 1966 track.png  
DurationAugust 2 – August 12
Peak intensity85 mph (140 km/h) (1-min);
990  mbar  (hPa)

On the evening of August 2, a tropical storm formed south of Mexico, skipping tropical depression strength. It initially went west-northwest until the evening of August 4 when it reached category 1 hurricane status. Blanca eventually leveled off as it headed westward. On the morning of August 7, Blanca weakened into a tropical depression after weakening into a tropical storm two days later. During the afternoon of that day, Blanca crossed into the Central Pacific as a 30-mile per hour tropical depression. Blanca regained tropical storm status on August 9 as it went northwestward. Blanca continued stair-stepping as it dissipated on August 12 while northwest of Honolulu, Hawaii. As Blanca never affected land, there were no reports of damages or deaths. Blanca set a record for the farthest traveling storm that formed in the Eastern Pacific by traveling 4,300 miles during its life. (1957's Hurricane/Typhoon Della traveled 5,000 miles, but formed in the Central Pacific.) [3]

Hurricane Connie

Category 1 hurricane (SSHWS)
ConnieAug141966ESSA1.jpg   Connie 1966 track.png
DurationAugust 7 – August 17
Peak intensity85 mph (140 km/h) (1-min);
981  mbar  (hPa)

On August 7, a tropical storm was identified southwest of the Baja California Peninsula and named Connie. It continued westward until three days later when Connie began to move northwest while remaining a tropical storm. During the morning of August 12, the storm crossed into the Central Pacific. The next morning, Connie was deemed to have become a hurricane with winds of 85 miles per hour. [4] Connie was stable in intensity until the 15th when she weakened into a tropical storm while southeast of the Big Island of Hawaii. Connie dissipated while almost directly south of Kihei on Maui. Connie caused no reported damage or deaths in Hawaii.

Tropical Depression Six

Tropical depression (SSHWS)
6-E 1966 track.png  
DurationAugust 11 – August 13
Peak intensity30 mph (45 km/h) (1-min);

[2]

Tropical Depression Seven

Tropical depression (SSHWS)
7-E 1966 track.png  
DurationAugust 15 – August 16
Peak intensity30 mph (45 km/h) (1-min);

[2]

Hurricane Dolores

Category 1 hurricane (SSHWS)
Dolores 1966 track.png  
DurationAugust 16 – August 25
Peak intensity85 mph (140 km/h) (1-min);
981  mbar  (hPa)

On August 16, a tropical storm was identified south of Manzanillo, Mexico and was named Dolores, the eight tropical depression of the season. During the afternoon of August 18, Dolores was noted to have more organization and became a hurricane. Dolores time as a hurricane was brief, Dolores weakened 24 hours after being upgraded. Dolores continued on her northwestward trek until August 23 when she became quasi-stationary and began to weaken. Dolores dissipated on August 25 while far away from land.

Tropical Depression Nine

Tropical depression (SSHWS)
9-E 1966 track.png  
DurationAugust 17 – August 17
Peak intensity30 mph (45 km/h) (1-min);

[2]

Hurricane Eileen

Category 1 hurricane (SSHWS)
Eileen 1966 track.png  
DurationAugust 22 – August 29
Peak intensity85 mph (140 km/h) (1-min);
990  mbar  (hPa)

On August 22, an area of low pressure gained enough organization and became Tropical Depression Ten. Two days later, the depression strengthened into a tropical storm and was named Eileen. Eileen headed northwest-ward as the slowly became stronger. On the morning of August 26, Eileen rapidly strengthened and became the seasons 5th hurricane. Eileen stayed this was for 36 hours and her minimum pressure of 990 mbar was recorded.. Just before she recurved, she weakened into a tropical storm as she moved over cooler waters. As she continued to recurve sharply, and on the night of August 28 (PDT time) she weakened into a remnant low. During the 26th, a ship sailed through the hurricane but there was no reported damage aboard the ship. Eileen also caused no deaths.

Hurricane Francesca

Category 1 hurricane (SSHWS)
FrancescaSept10111966Nimbus1SatellitePicture.gif   Francesca 1966 track.png
DurationSeptember 5 – September 16
Peak intensity85 mph (140 km/h) (1-min);
992  mbar  (hPa)

Tropical Depression Eleven formed due south of La Paz, Mexico on September 5. The next morning, the depression became the season's sixth tropical storm and was named Francesca. Francesca entered a period of rapid strengthening for six hours as the storm's winds increased by 35 mph (56 km/h) and became the season's sixth hurricane. After this period of strengthening, Francesca leveled out and remained a hurricane until the morning of September 9 when it weakened prior to a southward dive as the result of interacting with nearby Tropical Storm Gretchen. [5] Francesca continued to trek southward until the evening of September 11, when the storm very sharply recurved. Subsequently, Francesca weakened into a tropical depression as it went due east for 36 hours. Francesca degenerated into a remnant low on the morning of September 16. Francesca was the longest lived hurricane of the season by lasting eleven days. Wave action from Francesca and Hurricane Helga caused beach erosion throughout California. [6]

Tropical Storm Gretchen

Tropical storm (SSHWS)
GretchenSept10111966Nimbus1.gif   Gretchen 1966 track.png
DurationSeptember 7 – September 11
Peak intensity50 mph (85 km/h) (1-min);
992  mbar  (hPa)

During the evening of September 7, a tropical disturbance that was near Hurricane Francesca became Tropical Storm Gretchen, bypassing the depression stage. Gretchen did not strengthen during her lifetime due to her proximity to Francesca and was nearly absorbed by her because Francesca disorganized Gretchen, the last advisory was issued on September 11. [5] Because Gretchen never affected land, there was no damage or deaths reported from it.

Hurricane Helga

Category 1 hurricane (SSHWS)
HelgaSept10111966Nimbus1SatellitePicture.gif   Helga 1966 track.png
DurationSeptember 9 – September 17
Peak intensity85 mph (140 km/h) (1-min);
992  mbar  (hPa)

On the morning of September 9, a tropical wave spawned Tropical Depression Thirteen. The storm was quickly to intensify and was named six hours later. The tropical storm began to curve north and on September 12 Helga became the eighth, and last hurricane of the season. She remained at that intensity for 36 hours and then began to weaken. She had weakened into a tropical storm when she made landfall on the Baja California Peninsula and weakened into a tropical depression. The depression dissipated on the 17th while in the Mexican state of Chihuahua. Helga caused the death of one person in California and also caused beach erosion throughout California and the Baja California Peninsula. The combined wave action from Helga and Francesca caused extensive damage throughout the region. [6]

Tropical Storm Ione

Tropical storm (SSHWS)
IoneSept10111966Nimbus1SatellitePicture.gif   Ione 1966 track.png
DurationSeptember 10 – September 13
Peak intensity50 mph (85 km/h) (1-min);
999  mbar  (hPa)

On September 10, Tropical Depression Fourteen formed west of Tropical Storm Helga. The depression was slow to organize and became Tropical Storm Ione during the afternoon of the 12th. Ione's time as a tropical storm was brief and the last advisory was issued the next morning due to land interaction that weakened the system. Even though Ione dissipated near Mexico, the remnant low brought rain to Mexico. No deaths or damages were reported due to Ione when she was warned upon. While she was a low, there is no information.

Tropical Depression Twenty-Two

Tropical depression (SSHWS)
UnnamedSept10111966Nimbus1SatellitePicture.gif  
DurationSeptember 10 – September 12
Peak intensity30 mph (45 km/h) (1-min);

On September 10 a tropical depression was located by the Joint Hurricane Warning Center (JHWC) and was designated Tropical Depression Twenty-two and was heading westward. During the morning of the 12th, the depression passed 240 miles south of the island of Hawaii. It dissipated that night. The depression caused heavy rainfall throughout the Hawaiian Islands during the 12th. [7] The reason that this depression was named 22 is unknown, but it is probably because it was numbered with the Western Pacific storm numbers.

Tropical Storm Joyce

Tropical storm (SSHWS)
Joyce 1966 track.png  
DurationSeptember 14 – September 20
Peak intensity50 mph (85 km/h) (1-min);
1001  mbar  (hPa)

During the late evening of September 14, Tropical Depression Fifteen formed far away from land. The depression took a long time to strengthen and became a tropical storm for only 24 hours late in its life before cooler waters took hold of the system and made it a remnant low on September 20. Joyce was one of the shortest lasting storms of the season.

Tropical Storm Kirsten

Tropical storm (SSHWS)
Kirsten 1966 track.png  
DurationSeptember 26 – September 29
Peak intensity50 mph (85 km/h) (1-min);
997  mbar  (hPa)

Six days after Joyce dissipated, a new tropical depression formed while southwest of the Baja California Peninsula. This depression, like Joyce before it, took a long time to become named. The depression finally became named storm on September 28 while nearing landfall. Kirsten made landfall during the late morning of September 28 on the Baja California Peninsula. She made another landfall near Los Mochis, Mexico later that day. Kirsten rapidly dissipated over land the next morning. Kirsten caused at least eight deaths in Ciudad Obregón and an estimated damage of $5.6 million (equivalent to $50.51 million in 2022). [8] Despite this, Kirsten was not retired, although the name Kirsten was not used in 1970 due to a possible misspelling. In 1970, the name Kristen was used as a "K" name instead, but in 1974, the "K" name was changed back to Kirsten.

Tropical Storm Lorraine

Tropical storm (SSHWS)
Lorraine 1966 track.png  
DurationOctober 3 – October 5
Peak intensity50 mph (85 km/h) (1-min);
1002  mbar  (hPa)

Near the end of the season Tropical Depression Sixteen formed while south of Mexico. The depression quickly intensified and became a tropical storm and was named Lorraine. Lorraine made landfall west of Tecoman, Mexico and quickly dissipated. Lorraine brought rain to Mexico in areas that would get rain from Tropical Storm Maggie (see below) a few days later. Lorraine caused no reports of damage or deaths in Mexico.

Tropical Storm Maggie

Tropical storm (SSHWS)
Maggie 1966 track.png  
DurationOctober 16 – October 19
Peak intensity50 mph (85 km/h) (1-min);
1002  mbar  (hPa)

On October 16, Tropical Depression Eighteen formed while south of Mexico. The depression, like Joyce and Kirsten before it took a long time to become a tropical storm. Finally on October 18 the depression strengthened and became Tropical Storm Maggie, the final tropical storm of the season. Maggie brought torrential rains to areas affected by Lorraine earlier in the month as she paralleled the Mexican coast. She finally made landfall near Manzanillo, Mexico and weakened into a tropical depression while near Puerto Vallarta. The depression briefly emerged off the coast before making landfall near Puerto Vallarta for the last time. Maggie dissipated shortly afterward. Maggie caused no reports of damages or deaths.

Other system

Tropical storm (SSHWS)
KathyOct1319660405zESSA3.jpg   Kathy 1966 track.png
DurationOctober 20 (Entered basin) – October 21
Peak intensity65 mph (100 km/h) (1-min);
958  mbar  (hPa)

According to the Joint Typhoon Warning Center and Japan Meteorological Agency, on October 20 Tropical Storm Kathy crossed the International Dateline, entering into CPHC's area of responsibility; [9] [10] however, this storm wasn't included into CPHC database. The storm eventually became extratropical on October 21 over open waters.

Storm names

The following list of names was used for named storms that formed in the North Pacific Ocean east of 140°W in 1966. This was the third of four sets of storm names introduced at the start of the 1960 season. As only names in sets one and two had been used through the 1965 season, every name used in 1966 was used for the first time. Also, this was the first season in which sets of names were cycled on an annual rotation basis beginning with the "A" name each year. This set, with the exception of Kirsten, which was replaced by Kristen, was reused for the 1970 season. [11] [12]

  • Adele
  • Blanca*
  • Connie*
  • Dolores
  • Eileen
  • Francesca
  • Gretchen*
  • Helga
  • Ione
  • Joyce
  • Kirsten
  • Lorraine
  • Maggie
  • Norma (unused)
  • Orlene (unused)
  • Patricia (unused)
  • Rosalie (unused)
  • Selma (unused)
  • Toni (unused)
  • Vivian (unused)
  • Winona (unused)

Had any tropical storms formed in the North Pacific between 140°W and the International Date Line in 1966, their names would have been drawn from the Western Pacific typhoon naming list. [12] Named storms in the table above that crossed into the area during the year are noted (*). [13]

See also

Related Research Articles

<span class="mw-page-title-main">1997 Pacific hurricane season</span> Hurricane season in the Pacific Ocean

The 1997 Pacific hurricane season was a very active hurricane season. With hundreds of deaths and hundreds of millions of dollars in damage, this was one of the deadliest and costliest Pacific hurricane seasons on record. This was due to the exceptionally strong 1997–98 El Niño event. The season officially started on May 15, in the eastern Pacific, and on June 1, in the central Pacific, and lasted until November 30. These dates conventionally delimit the period of each year when almost all tropical cyclones form in the northeastern Pacific Ocean.

<span class="mw-page-title-main">1987 Pacific hurricane season</span> Hurricane season in the Pacific Ocean

The 1987 Pacific hurricane season was the last year in which the Eastern Pacific Hurricane Center was the primary warning center for tropical cyclones in the eastern Pacific Ocean. The season officially started May 15, 1987, in the eastern Pacific, and June 1, 1987, in the central Pacific, and lasted until November 30, 1987. These dates conventionally delimit the period of each year when the vast majority of tropical cyclones form in the northeastern Pacific Ocean.

<span class="mw-page-title-main">1985 Pacific hurricane season</span> Hurricane season in the Pacific Ocean

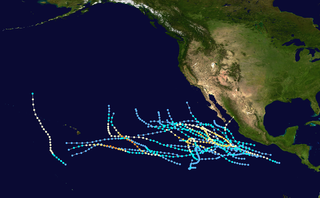
The 1985 Pacific hurricane season is the third-most active Pacific hurricane season on record. It officially started on May 15, 1985, in the eastern Pacific, and on June 1, 1985, in the central Pacific, and lasted until November 30, 1985. These dates conventionally delimit the period of each year when most tropical cyclones form in the northeastern Pacific Ocean. At the time, the 1985 season was the most active on record in the eastern north Pacific, with 28 tropical cyclones forming. Of those, 24 were named, 13 reached hurricane intensity, and 8 became major hurricanes by attaining Category 3 status or higher on the Saffir–Simpson scale. At that time, the 24 named storms was a record; however, this record was broken seven years later in 1992, and was therefore recognized as the second busiest season within the basin, until it was surpassed exactly thirty years later by the 2015 season.
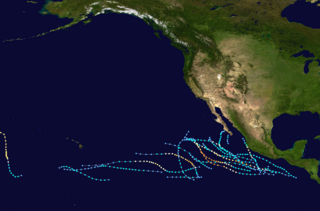
<span class="mw-page-title-main">1973 Pacific hurricane season</span> Hurricane season in the Pacific Ocean

The 1973 Pacific hurricane season was an event in tropical cyclone meteorology. The most important system this year was Hurricane Ava, which was the most intense Pacific hurricane known at the time. Several other much weaker tropical cyclones came close to, or made landfall on, the Pacific coast of Mexico. The most serious of these was Hurricane Irah, which downed power and communication lines in parts of the Baja California Peninsula; the other landfalling storms caused rain and some flooding. No tropical cyclone this season caused any deaths.

<span class="mw-page-title-main">1974 Pacific hurricane season</span> Hurricane season in the Pacific Ocean

The 1974 Pacific hurricane season featured one of the most active periods of tropical cyclones on record with five storms existing simultaneously. The season officially started May 15 in the eastern Pacific, and June 1 in the central Pacific, and lasted until November 30. These dates conventionally delimit the period of each year when most tropical cyclones form in the northeast Pacific Ocean.

<span class="mw-page-title-main">1970 Pacific typhoon season</span> Typhoon season in the Pacific Ocean

The 1970 Pacific typhoon season has no official bounds; it ran year-round in 1970, but most tropical cyclones tend to form in the northwestern Pacific Ocean between June and December. These dates conventionally delimit the period of each year when most tropical cyclones form in the northwestern Pacific Ocean.

<span class="mw-page-title-main">1972 Pacific hurricane season</span> Hurricane season in the Pacific Ocean

The 1972 Pacific hurricane season was an ongoing event in tropical cyclone meteorology. There were few notable storms this year. Only one person was killed and storm effects were almost not serious at all. The most notable systems were Hurricane Celeste and Joanne. Celeste was the strongest storm of the season, and caused heavy damage to Johnston Atoll. Hurricane Joanne brought gale-force winds to the Continental United States and caused flooding in Arizona and northern Mexico, which killed one person. The only other system to directly impact land was Hurricane Annette.

<span class="mw-page-title-main">1971 Pacific hurricane season</span> Hurricane season in the Pacific Ocean

The 1971 Pacific hurricane season began on May 15, 1971 in the eastern Pacific, and on June 1, 1971 in the Central Pacific ; both ended on November 30, 1971. These dates, adopted by convention, historically describe the period in each year when most tropical cyclogenesis occurs in these regions of the Pacific. It was the first year that continuous Weather satellite coverage existed over the entire Central Pacific. As such, this season is often viewed as the start year for modern reliable tropical cyclone data in the Pacific Ocean.

<span class="mw-page-title-main">1970 Pacific hurricane season</span> Hurricane season in the Pacific Ocean

The 1970 Pacific hurricane season began on May 15, 1970 in the east Pacific, and on June 1, 1970 in the central Pacific. It ended on November 30, 1970. These dates conventionally delimit the period of time when tropical cyclones form in the eastern Pacific Ocean.

<span class="mw-page-title-main">1967 Pacific hurricane season</span> Hurricane season in the Pacific Ocean

The 1967 Pacific hurricane season started on June 1 and ended on November 30, 1967. The season was of little note except for Hurricanes Katrina and Olivia. Katrina made landfall on the Baja Peninsula, killing at least one and made 2,500 homeless. Olivia made landfall on the eastern side of the Baja Peninsula as a major hurricane—only one of two storms ever to do so. Hurricane/Typhoon Sarah formed in the Central Pacific and reached category 1 strength before crossing over to the Western Pacific.

<span class="mw-page-title-main">Tropical Storm Kirsten (1966)</span> Pacific tropical storm in 1966

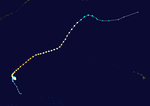
Tropical Storm Kirsten was the eighth tropical cyclone of the 1966 Pacific hurricane season and the second to make landfall in the Baja California peninsula. Forming north of the Intertropical Convergence Zone (ITCZ), Kirsten developed into a tropical depression on September 25 and like Tropical Storm Joyce of the same season, took a long period of time before intensifying into a tropical storm.

<span class="mw-page-title-main">2009 Pacific hurricane season</span> Hurricane season in the Pacific Ocean

The 2009 Pacific hurricane season was the most active Pacific hurricane season since 1997. The season officially started on May 15 in the East Pacific Ocean, and on June 1 in the Central Pacific; they both ended on November 30. These dates conventionally delimit the period of each year when most tropical cyclones form in the Eastern Pacific tropical cyclone basin; however, tropical cyclone formation is possible at any time of the year. The first system of the season, Tropical Depression One-E, developed on June 18, and the last, Hurricane Neki, dissipated on October 27, keeping activity well within the bounds of the season.

<span class="mw-page-title-main">Timeline of the 1997 Pacific hurricane season</span>

The 1997 Pacific hurricane season was the most active season since the 1994 season, producing 24 tropical depressions, 19 of which became tropical storms or hurricanes. The season officially started on May 15, 1997 in the Eastern Pacific—designated as the area east of 140°W—and on June 1, 1997 in the Central Pacific, which is between the International Date Line and 140°W. The season officially ended in both basins on November 30, 1997. These dates typically limit the period of each year when most tropical cyclones form in the eastern Pacific basin. This timeline documents all the storm formations, strengthening, weakening, landfalls, extratropical transitions, as well as dissipation. The timeline also includes information which was not operationally released, meaning that information from post-storm reviews by the National Hurricane Center, such as information on a storm that was not operationally warned on, has been included.

<span class="mw-page-title-main">2015 Pacific hurricane season</span> Hurricane season in the Pacific Ocean

The 2015 Pacific hurricane season is the second-most active Pacific hurricane season on record, with 26 named storms, only behind the 1992 season. A record-tying 16 of those storms became hurricanes, and a record 11 storms further intensified into major hurricanes throughout the season. The Central Pacific, the portion of the Northeast Pacific Ocean between the International Date Line and the 140th meridian west, had its most active year on record, with 16 tropical cyclones forming in or entering the basin. Moreover, the season was the third-most active season in terms of accumulated cyclone energy, amassing a total of 290 units. The season officially started on May 15 in the Eastern Pacific and on June 1 in the Central Pacific; they both ended on November 30. These dates conventionally delimit the period of each year when most tropical cyclones form in the Northeast Pacific basin. However, the formation of tropical cyclones is possible at any time of the year. This was shown when a tropical depression formed on December 31. The above-average activity during the season was attributed in part to the very strong 2014–16 El Niño event.

<span class="mw-page-title-main">Tropical cyclones in 2021</span>

During 2021, tropical cyclones formed in seven major bodies of water, commonly known as tropical cyclone basins. Tropical cyclones will be assigned names by various weather agencies if they attain maximum sustained winds of 35 knots. During the year, one hundred forty-five systems have formed and ninety-one were named, including one subtropical depression and excluding one system, which was unofficial. One storm was given two names by the same RSMC. The most intense storm of the year was Typhoon Surigae, with maximum 10-minute sustained wind speeds of 220 km/h (140 mph) and a minimum pressure of 895 hPa (26.43 inHg). The deadliest tropical cyclone was Typhoon Rai, which caused 410 fatalities in the Philippines and 1 in Vietnam, while the costliest was Hurricane Ida, which caused an estimated $75.25 billion USD in damage after striking Louisiana and the Northeastern United States. Six Category 5 tropical cyclones formed during the year, tying 2003. The accumulated cyclone energy (ACE) index for the 2021, as calculated by Colorado State University (CSU) was 621.1 units overall.

<span class="mw-page-title-main">Tropical cyclones in 2022</span>

During 2022, tropical cyclones formed in seven major bodies of water, commonly known as tropical cyclone basins. Tropical cyclones were named by various weather agencies when they attained maximum sustained winds of 35 knots. During the year, 133 systems formed, of which 87 were named. The strongest storm to form was Typhoon Nanmadol, with minimum pressure of 910 hPa (26.87 inHg). The deadliest tropical cyclone was Tropical Storm Megi, which caused 214 fatalities in the Philippines, while the costliest was Hurricane Ian, which had an estimated damage total of at least $113.1 billion after affecting Trinidad and Tobago, Venezuela, Colombia, the western part of the Greater Antilles and Southeast United States. Throughout 2022, eighteen major tropical cyclones formed, including three Category 5 tropical cyclones Saffir–Simpson scale (SSHWS) during the year. The accumulated cyclone energy (ACE) index for the 2022, as calculated by Colorado State University (CSU) was 559.6 units overall.

<span class="mw-page-title-main">Tropical cyclones in 2023</span> Tropical cyclones in 2023 worldwide

During 2023, tropical cyclones formed in seven major bodies of water, commonly known as tropical cyclone basins. They were named by various weather agencies when they attained maximum sustained winds of 35 knots. Throughout the year, a total of 115 systems formed, with 79 of them being named. The most intense storm this year was Typhoon Mawar, which had a minimum pressure of 900 hPa (26.58 inHg). The deadliest and costliest tropical cyclone of the year was Storm Daniel, which killed at least 10,028 people in Libya, Greece, Turkey, and Bulgaria, and caused at least US$21.14 billion worth of damage. Among this year's systems, thirty became major tropical cyclones, of which nine intensified into Category 5 tropical cyclones on the Saffir–Simpson scale (SSHWS). This year, for the first time on record, at least one such Category 5 system formed in each tropical cyclone basin: Typhoons Mawar and Bolaven in the western Pacific Ocean, Hurricanes Jova and Otis in the eastern Pacific, Hurricane Lee in the Atlantic, Cyclone Mocha in the North Indian Ocean, Cyclone Freddy in the southwest Indian Ocean, Cyclone Ilsa in the Australian region, and Cyclone Kevin in the South Pacific. The accumulated cyclone energy (ACE) index for the 2023, as calculated by Colorado State University (CSU) was 857.4 units overall.

References

  1. Joint Typhoon Warning Center (1966). "JTWC Report of 1966" (PDF). Archived from the original (PDF) on 2011-06-07. Retrieved 2008-10-08.
  2. 1 2 3 4 5 "JTWC Report on the 1966 Hurricane Season" (PDF). Joint Typhoon Warning Center. 1966. Archived from the original (PDF) on 2011-06-07. Retrieved 2008-09-25.
  3. Central Pacific Hurricane Center (1966). "CHPC Report of 1966" . Retrieved 2008-10-08.
  4. The 1966 Central Pacific Tropical Cyclone Season. Central Pacific Hurricane Center (Report). National Oceanic and Atmospheric Administration. Retrieved 13 January 2019.
  5. 1 2 Central Pacific Hurricane Center (1966). "Effects of Hurricane Francesca to Gretchen" . Retrieved 2008-10-08.
  6. 1 2 Fred Hamlin (September 14, 1966). "Newport, Seal Beach Pounded". Independent. Long Beach, California. p. A-4. Retrieved September 14, 2023 via Newspapers.com. Lock-green.svg
  7. Central Pacific Hurricane Center (1966). "Effects of Hurricane Francesca to Gretchen" . Retrieved 2008-10-08.
  8. Tuscan Daily Citizen Hurricane Center (1966). "Effects of Tropical Storm Kirsten on Mexico". Archived from the original on 2015-11-05. Retrieved 2008-10-08.
  9. "Japan Meteorological Agency Best Tracks" (ZIP). Japan Meteorological Agency. 2015. Retrieved November 29, 2015.
  10. "bwp251966" (TXT). Joint Typhoon Warning Center. 1966. Retrieved November 29, 2015.
  11. "Eastern North Pacific Tropical Cyclone Name History". Atlantic Tropical Weather Center. Archived from the original on September 29, 2007. Retrieved February 25, 2024.
  12. 1 2 Padgett, Gary (July 11, 2008). "Monthly Global Tropical Cyclone Summary: November 2007 First Installment". Australian Severe Weather. Retrieved February 25, 2024.
  13. Pao-Shin Chu; Peng Wu (2008). Climatic Atlas of Tropical Cyclone Tracks over the Central North Pacific (PDF) (Report). University of Hawaii-Manoa. Archived (PDF) from the original on October 23, 2014. Retrieved February 25, 2024.