1965 Pacific hurricane season

Last updated

1965 Pacific hurricane season
1965 Pacific hurricane season summary map.png
Season summary map
Seasonal boundaries
First system formedJune 4, 1965
Last system dissipatedSeptember 27, 1965
Strongest storm
Name Emily
  Maximum winds90 mph (150 km/h)
(1-minute sustained)
  Lowest pressure980 mbar (hPa; 28.94 inHg)
Seasonal statistics
Total depressions11
Total storms10
Hurricanes1
Major hurricanes
(Cat. 3+)
0
Total fatalities6 total
Total damage$10 million (1965 USD)
Related articles
Pacific hurricane seasons
1963, 1964, 1965, 1966, 1967

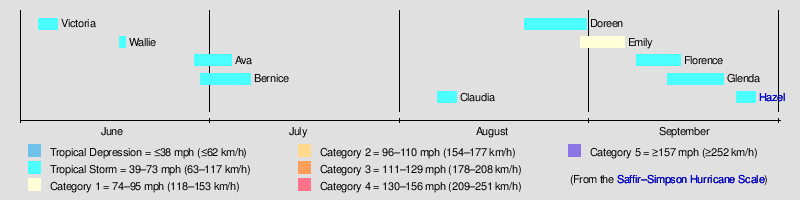
The 1965 Pacific hurricane season officially started May 15, 1965, in the eastern Pacific, and June 1, 1965, in the central Pacific, and lasted until November 30, 1965. These dates conventionally delimit the period of each year when most tropical cyclones form in the northeast Pacific Ocean. A total of ten systems were observed. The most notable storm was Tropical Storm Hazel, which killed six people in Mexico.

Contents

Systems

Tropical Storm Hazel (1965)Saffir–Simpson Hurricane Scale1965 Pacific hurricane season

Tropical Storm Victoria

Tropical storm (SSHWS)
VictoriaJune41965.jpg   Victoria 1965 track.png
DurationJune 4 – June 7
Peak intensity85 km/h (50 mph) (1-min);
1005  hPa  (mbar)

On June 4, a tropical depression formed 585 miles (945 km) southwest of Acapulco, Mexico Early the next day, the depression system intensified into the first tropical storm of the season and was named Victoria. At that time, the storm was at its peak intensity of 50 mph (85 km/h) which it retained while moving the northwest. Early on June 7, the tropical storm weakened into a tropical depression before dissipating six hours later. [1] In all, Tropical Storm Victoria stayed at sea.

Tropical Storm Wallie

Tropical storm (SSHWS)
Wallie 1965 track.png  
DurationJune 17 – June 18
Peak intensity85 km/h (50 mph) (1-min);
1000  hPa  (mbar)

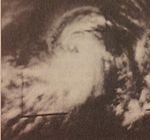
Early on the morning of June 17, a tropical depression formed 185 miles (300 km/h) west of Puerto Angel, Mexico. The depression strengthened into Tropical Storm Wallie. Meanwhile, Wallie was at its peak intensity of 50 mph (85 km/h). [1] Wallie headed northwest and degenerated into an area of low pressure just off the Mexican coast early on June 18. [1] The remnant low made landfall in the near Zihuatanejo, Mexico early on June 18. The low dissipated later that day. [1]

Damage in Mexico from Wallie was described as the worst in eight years. Monetary damages were described was being in the "thousands", however an exact damage total is unknown. No deaths were reported due to the storm. [2]

Tropical Storm Ava

Tropical storm (SSHWS)
AvaJune301965TirosIX.jpg   Ava 1965 track.png
DurationJune 29 – July 5
Peak intensity85 km/h (50 mph) (1-min);
998  hPa  (mbar)

Early on June 29, a tropical storm was identified 535 miles (860 km) south of Cabo San Lucas, Mexico and named Ava. At that time, the storm was at peak intensity of 50 mph (85 km/h). However, Tropical Storm Ava weakened into a tropical depression within 24 hours. Late on June 30, the depression re-strengthened into a tropical storm and regained peak intensity. At this time, the storm took a track that went north and back south gently. On July 3, Tropical Storm Ava weakened into a tropical depression. Ava dissipated early on July 5. The tropical storm stayed at sea, and no damage was reported. [1]

Tropical Storm Bernice

Tropical storm (SSHWS)
Bernice 1965 track.png  
DurationJune 30 – July 8
Peak intensity85 km/h (50 mph) (1-min);
983  hPa  (mbar)

On June 30, Tropical Storm Bernice formed. At this time, the system was located 275 miles (445 km) south of Puerto Angel, Mexico. For the next few days, the storm moved northeastward, while maintaining peak intensity of 50 mph (85 km/h). On July 5, Bernice stopped its northeastward motion and began to turn east, Berice dissipating on July 8, [1] without ever impacting any land masses.

Tropical Storm Claudia

Tropical storm (SSHWS)
Claudia 1965 track.png  
DurationAugust 7 – August 10
Peak intensity85 km/h (50 mph) (1-min);
1004  hPa  (mbar)

During the afternoon of August 7, a tropical depression formed 150 miles southwest of Cabo San Lucas, Mexico. On August 8, the cyclone strengthened into Tropical Storm Claudia. At that time, Claudia was reaching its peak intensity of 50 mph (85 km/h), while also beginning to recurve to the north. The storm remained at peak intensity while re-curving until August 10 when the wind speeds decreased slightly and advisories were discontinued. [1] The storm never affected land.

Tropical Storm Doreen

Tropical storm (SSHWS)
Doreen 1965 track.png  
DurationAugust 21 – August 31
Peak intensity85 km/h (50 mph) (1-min);
≥975  hPa  (mbar)

Late on August 19, Tropical Storm Doreen was first located with a TIROS satellite image. The next day, a ship, the San Juan Prospector reported winds of 40 knots (45 mph, 70 km/h) and a pressure of 975 mbar (hPa). At this time, Doreen was moving to the northwest as 10 knots. On August 21, Doreen altered its course to the west, but reversed back to its original heading the next day. On August 22, the ship Kyoyu Maru, which was just north of the storm's center reported winds of 60 knots (70 mph, 115 km/h). Over the next few days, the storm gently recurved northward but then slowed down and headed to the southwest. On August 30, Tropical Storm Doreen crossed the Central Pacific where it dissipated the next morning. During the course of the system, 13 ships reported winds related to Doreen, [1] [3] but no damage was reported.

Hurricane Emily

Category 1 hurricane (SSHWS)
Emily 1965 track.png  
DurationAugust 30 – September 6
Peak intensity90 mph (150 km/h) (1-min);
983  mbar  (hPa)

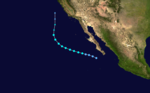
On August 30, a moderate tropical storm developed. It slowing intensified, becoming the first hurricane of this season at 1200 UTC August 31. Emily began to weaken while moving northward in the Eastern Pacific. On 0000 UTC time September 3, Emily weakened into a tropical depression. It hit Baja California at the same intensity on September 6. [1] According to one source, Emily was the first potentially hazardous storm in many years to approach Southern California. [4] It approached Southern California while the SEALAB II Project was underway at La Jolla, California. There was concern that waves from Emily would move the Berkone, a support ship for SEALAB, away from the SEALAB site as the project would have to be halted. [4] Rainfall totals reach 1 in (25 mm) in isolated areas. [5]

Tropical Storm Florence

Tropical storm (SSHWS)
Florence 1965 track.png  
DurationSeptember 8 – September 15
Peak intensity85 km/h (50 mph) (1-min);
1006  hPa  (mbar)

Tropical Storm Florence first formed on September 8 as a tropical depression. After 24 hours, Florence intensified into a tropical storm. At that time, the cyclone peaked with 50 mph (80 km/h) winds. However, on September 11, Florence suddenly weakened. After maintaining its intensity for a while, the depression was declared dissipated. [1] Florence stayed at sea and no deaths or damage were reported.

Tropical Storm Glenda

Tropical storm (SSHWS)
Glenda 1965 track.png  
DurationSeptember 13 – September 22
Peak intensity85 km/h (50 mph) (1-min);
1005  hPa  (mbar)

Tropical Storm Glenda formed on September 13 and maintained the same intensity of 50 mph(85 km/h) for nine days before advisories were dropped. [1]

Tropical Storm Hazel

Tropical storm (SSHWS)
Hazel 1965 track.png  
DurationSeptember 24 – September 27
Peak intensity85 km/h (50 mph) (1-min);
986  hPa  (mbar)

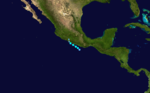
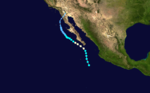
Hazel developed from a northward-moving disturbance that originated southeast of Socorro Island. [6] After reaching tropical storm strength on the Saffir–Simpson hurricane scale, the cyclone turned to the east-northeast – a motion confirmed by a ship report. The storm made landfall near Mazatlán on September 26 and quickly became extratropical. [1] Thousands more were left homeless. Mazatlán's shrimp fleet, which makes up the base of the city's economy, suffered major damage, while in southern Sinaloa, 55,000 acres of cotton, corn, and sorghum were lost. At least 50 boats were damaged or sunk by the storm. The damage from the storm was estimated at $10 million (1965 USD) and possibly more, making Hazel the costliest tropical cyclone of the season. [7]

Accumulated cyclone energy (ACE) rating

ACE (104kt²) – Source [1]
18.3025 Doreen 62.2275 Florence
27.4925 Glenda 71.8225 Victoria
36.2775 Bernice 81.8225 Claudia
44.96 Emily 91.62 Hazel
52.835 Ava 100.81 Wallie
Total: 40.17

Accumulated cyclone energy (ACE) is a measure of the activity of a hurricane season. It is calculated by squaring the windspeed of a cyclone with at least tropical storm-force winds every six hours, summing the results, and dividing that total by 104. As a tropical cyclone does not have gale-force winds until it becomes a tropical storm, tropical depressions are not included in these tables. [8]

Storm names

The following names were used for tropical storms that formed in the North Pacific Ocean east of 140°W during 1965. The names came from a series of four rotating lists. Names were used one after the other without regard to year, and when the bottom of one list was reached, the next named storm received the name at the top of the next list. As the final tropical storm of the 1964 season was given the "T" name from list 2, the first two storms of the 1965 season were given the "V" and "W" names from that list ("U" being excluded). However, when it came time to assign a name to the season's third storm, instead of moving to the "A" name on list 3 ("X", "Y", and "Z" being excluded), forecasters returned the list 2 "A" name and proceeded from there. [9]

  • Victoria
  • Wallie
  • Ava
  • Bernice
  • Claudia
  • Doreen
  • Emily
  • Florence

Had any tropical storms formed in the North Pacific between 140°W and the International Date Line in 1965, their names would have been drawn from the Western Pacific typhoon naming list. [9]

Retirement

The name Hazel was retired following the 1965 season from further use in the Eastern Pacific basin, and replaced with Heather. [9] [10]

See also

Related Research Articles

<span class="mw-page-title-main">1953 Atlantic hurricane season</span> Hurricane season in the Atlantic Ocean

The 1953 Atlantic hurricane season was an active season, with fourteen tropical storms, six of which developed into hurricanes; four of the hurricanes attained major hurricane status. This was the first season in which an official list of female names was used to name storms in the basin. The season officially began on June 15, and lasted until November 15, although activity occurred both before and after the season's limits.

<span class="mw-page-title-main">2000 Pacific hurricane season</span> Hurricane season in the Pacific Ocean

The 2000 Pacific hurricane season was an above-average Pacific hurricane season, although most of the storms were weak and short-lived. There were few notable storms this year. Tropical storms Miriam, Norman, and Rosa all made landfall in Mexico with minimal impact. Hurricane Daniel briefly threatened the U.S. state of Hawaii while weakening. Hurricane Carlotta was the strongest storm of the year and the second-strongest June hurricane in recorded history. Carlotta killed 18 people when it sank a freighter. Overall, the season was significantly more active than the previous season, with 19 tropical storms. In addition, six hurricanes developed. Furthermore, there were total of two major hurricanes.

<span class="mw-page-title-main">1997 Pacific hurricane season</span> Hurricane season in the Pacific Ocean

The 1997 Pacific hurricane season was a very active hurricane season. With hundreds of deaths and hundreds of millions of dollars in damage, this was one of the deadliest and costliest Pacific hurricane seasons on record. This was due to the exceptionally strong 1997–98 El Niño event. The season officially started on May 15, in the eastern Pacific, and on June 1, in the central Pacific, and lasted until November 30. These dates conventionally delimit the period of each year when almost all tropical cyclones form in the northeastern Pacific Ocean.

<span class="mw-page-title-main">1996 Pacific hurricane season</span> Hurricane season in the Pacific Ocean

The 1996 Pacific hurricane season had below normal tropical cyclone activity, producing 9 tropical storms, of which 5 became hurricanes, with 2 of those intensifying into major hurricanes. With an Accumulated cyclone energy (ACE) index of 53.9, the season ranks among the least intense Pacific hurricane seasons on record. It officially began May 15, 1996, in the eastern north Pacific and on June 1, 1996, in the central north Pacific. It ended on November 30, 1996. These dates conventionally delimit the period of each year when most tropical cyclones form in the northeastern Pacific Ocean. The season slightly exceeded these bounds when tropical storm One-E formed on May 13.

<span class="mw-page-title-main">1987 Pacific hurricane season</span> Hurricane season in the Pacific Ocean

The 1987 Pacific hurricane season was the last year in which the Eastern Pacific Hurricane Center was the primary warning center for tropical cyclones in the eastern Pacific Ocean. The season officially started May 15, 1987, in the eastern Pacific, and June 1, 1987, in the central Pacific, and lasted until November 30, 1987. These dates conventionally delimit the period of each year when the vast majority of tropical cyclones form in the northeastern Pacific Ocean.

<span class="mw-page-title-main">1986 Pacific hurricane season</span> Hurricane season in the Pacific Ocean

The 1986 Pacific hurricane season featured several tropical cyclones that contributed to significant flooding to the Central United States. The hurricane season officially started May 15, 1986, in the eastern Pacific, and June 1, 1986 in the central Pacific, and lasted until November 30, 1986 in both regions. These dates conventionally delimit the period of each year when most tropical cyclones form in the northeastern Pacific Ocean. A total of 17 named storms and 9 hurricanes developed during the season; this is slightly above the averages of 15 named storms and 8 hurricanes, respectively. In addition, 26 tropical depressions formed in the eastern Pacific during 1986, which, at the time, was the second most ever recorded; only the 1982 Pacific hurricane season saw a higher total.

<span class="mw-page-title-main">1984 Pacific hurricane season</span> Hurricane season in the Pacific Ocean

The 1984 Pacific hurricane season featured numerous tropical cyclones, several of which were impactful to land. It was a busy hurricane season with 21 named storms, 13 hurricanes, and 7 major hurricanes, the latter of which are Category 3 or stronger cyclones on the Saffir–Simpson scale. This activity was unusual given the presence of a La Niña, which typically suppresses Central and East Pacific tropical cyclone activity, and only average sea surface temperatures. Seasonal activity began on May 17 and ended on November 8. This lies within the confines of a traditional hurricane season which begins on May 15 in the East Pacific and June 1 in the Central Pacific, and ends on November 30 in both basins. These dates conventionally delimit the period during each year when most tropical cyclones form.

<span class="mw-page-title-main">1983 Pacific hurricane season</span> Hurricane season in the Pacific Ocean

The 1983 Pacific hurricane season was the longest season ever recorded at that time. It was a very active Pacific hurricane season. The season started on May 15, 1983 in the eastern Pacific, and on June 1, 1983 in the central Pacific, and lasted until November 30, 1983. These dates conventionally delimit the period of each year when most tropical cyclones form in the northeastern Pacific Ocean. During the 1983 season, there were 20 named storms, which was slightly less than the previous season. Furthermore, twelve of those storms became hurricanes. And eight of the storms reached major hurricane status, or Category 3 or higher on the Saffir–Simpson hurricane wind scale (SSHWS). The decaying 1982–83 El Niño event likely contributed to this level of activity. That same El Niño influenced a very quiet Atlantic hurricane season.

<span class="mw-page-title-main">1982 Pacific hurricane season</span> Hurricane season in the Pacific Ocean

The 1982 Pacific hurricane season, with 23 named storms, ranks as the fourth-most active Pacific hurricane season on record, tied with 2018. It was at that time the most active season in the basin until it was later surpassed by the 1985 season. It officially started June 1, 1982, in the eastern Pacific, and June 1, 1982, in the central Pacific, and lasted until October 31, 1982, in the central Pacific and until November 15, 1982, in the Eastern Pacific. These dates conventionally delimit the period of each year when most tropical cyclones form in the northeastern Pacific Ocean. At that time, the season was considered as the most active season within the basin in terms of named storms, however, the 1985 season surpassed these numbers just three years later.

<span class="mw-page-title-main">1981 Pacific hurricane season</span> Hurricane season in the Pacific Ocean

The 1981 Pacific hurricane season was a slightly below average Pacific hurricane season. The season officially started on May 15 in the eastern Pacific basin and June 1 in the central Pacific basin. Both basins' seasons ended on November 30; these dates conventionally delimit the period during which most tropical cyclones form in the northeastern Pacific Ocean. The first tropical cyclone of the season was designated on May 30, and the final storm of the season, Hurricane Otis, dissipated on October 30. The season produced fifteen named storms and a total of eight hurricanes, which was near normal. However, the total of one major hurricane was below the average of three.

<span class="mw-page-title-main">1973 Pacific hurricane season</span> Hurricane season in the Pacific Ocean

The 1973 Pacific hurricane season was an event in tropical cyclone meteorology. The most important system this year was Hurricane Ava, which was the most intense Pacific hurricane known at the time. Several other much weaker tropical cyclones came close to, or made landfall on, the Pacific coast of Mexico. The most serious of these was Hurricane Irah, which downed power and communication lines in parts of the Baja California Peninsula; the other landfalling storms caused rain and some flooding. No tropical cyclone this season caused any deaths.

<span class="mw-page-title-main">1977 Pacific hurricane season</span> Hurricane season in the Pacific Ocean

The 1977 Pacific hurricane season stands alongside 2010 as the least active Pacific hurricane season since reliable records began in 1971. Only eight tropical storms formed throughout the year; four further intensified into hurricanes, yet none strengthened into major hurricanes—a Category 3 or stronger on the Saffir–Simpson scale—an occurrence not seen again until 2003. Most tropical cyclones remained over the open eastern Pacific; however, the remnants of hurricanes Doreen and Heather led to heavy rainfall which damaged or destroyed structures and flooded roadways throughout the Southwest United States. Notably, Hurricane Anita which originally formed in the Gulf of Mexico made the rare trek across Mexico into the eastern Pacific, briefly existing as a tropical depression. Eight deaths were recorded while damage reached $39.6 million.

<span class="mw-page-title-main">1976 Pacific hurricane season</span> Hurricane season in the Pacific Ocean

The 1976 Pacific hurricane season was a very deadly and costly season. Hurricanes Kathleen, Liza, and Madeline were the most notable storms this year. Hurricane Kathleen caused death and destruction in California and Arizona due to flooding. Hurricane Liza was the deadliest storm of the season when it killed over 600 people in Mexico. Hurricane Madeline is notable for being one of the most intense Pacific hurricanes at landfall.

<span class="mw-page-title-main">1975 Pacific hurricane season</span> Hurricane season in the Pacific Ocean

The 1975 Pacific hurricane season officially started May 15, 1975, in the eastern Pacific, and June 1, 1975, in the central Pacific, and lasted until November 30, 1975. These dates conventionally delimit the period of each year when most tropical cyclones form in the northeast Pacific Ocean.

<span class="mw-page-title-main">1971 Pacific hurricane season</span> Hurricane season in the Pacific Ocean

The 1971 Pacific hurricane season began on May 15, 1971 in the eastern Pacific, and on June 1, 1971 in the Central Pacific ; both ended on November 30, 1971. These dates, adopted by convention, historically describe the period in each year when most tropical cyclogenesis occurs in these regions of the Pacific. It was the first year that continuous Weather satellite coverage existed over the entire Central Pacific. As such, this season is often viewed as the start year for modern reliable tropical cyclone data in the Pacific Ocean.

<span class="mw-page-title-main">1970 Pacific hurricane season</span> Hurricane season in the Pacific Ocean

The 1970 Pacific hurricane season began on May 15, 1970 in the east Pacific, and on June 1, 1970 in the central Pacific. It ended on November 30, 1970. These dates conventionally delimit the period of time when tropical cyclones form in the eastern Pacific Ocean.

<span class="mw-page-title-main">1969 Pacific hurricane season</span> Hurricane season in the Pacific Ocean

The 1969 Pacific hurricane season had below average tropical cyclone activity, with only ten named storms forming; most of these storms never approached land. Only four named storms reached hurricane strength, of which none became a major hurricane. It officially started on May 15, 1969, in the eastern Pacific Ocean, and ended on November 30, 1969. These dates conventionally delimit the period of each year when most tropical cyclones form east of this region of the Pacific. The first named storm of the season, Tropical Storm Ava, developed on July 1, and the last, Hurricane Jennifer, dissipated on October 23. At the time, Ava was the latest forming first named storm in any Eastern Pacific season on record.

<span class="mw-page-title-main">1968 Pacific hurricane season</span> Hurricane season in the Pacific Ocean

The 1968 Pacific hurricane season ties the record for having the most active August in terms of tropical storms. It officially started on May 15, 1968, in the eastern Pacific and June 1 in the central Pacific and lasted until November 30, 1968. These dates conventionally delimit the period of each year when most tropical cyclones form in the northeastern Pacific Ocean.

<span class="mw-page-title-main">1967 Pacific hurricane season</span> Hurricane season in the Pacific Ocean

The 1967 Pacific hurricane season started on June 1 and ended on November 30, 1967. The season was of little note except for Hurricanes Katrina and Olivia. Katrina made landfall on the Baja Peninsula, killing at least one and made 2,500 homeless. Olivia made landfall on the eastern side of the Baja Peninsula as a major hurricane—only one of two storms ever to do so. Hurricane/Typhoon Sarah formed in the Central Pacific and reached category 1 strength before crossing over to the Western Pacific.

<span class="mw-page-title-main">1957 Pacific hurricane season</span> Hurricane season in the Pacific Ocean

The 1957 Pacific hurricane season was a moderately active year in which 13 tropical cyclones formed. The hurricane season ran through the summer and fall months which conventionally delimit the period during which most tropical cyclones form in the northeastern Pacific Ocean. The first tropical cyclone developed on July 15. The final storm dissipated on December 6, becoming one of the few Pacific storms to exist outside of the seasonal dates. Of the season's 13 storms, five of these formed or crossed into the central Pacific.

References

  1. 1 2 3 4 5 6 7 8 9 10 11 12 13 National Hurricane Center; Hurricane Research Division; Central Pacific Hurricane Center (April 4, 2023). "The Northeast and North Central Pacific hurricane database 1949–2022". United States National Oceanic and Atmospheric Administration's National Weather Service. A guide on how to read the database is available here. PD-icon.svg This article incorporates text from this source, which is in the public domain.
  2. "Storm Rips Acapulco". The Modesto Bee. June 14, 1965. Retrieved March 21, 2011.
  3. "Central Pacific Hurricane Center Report on Tropical Storm Doreen". Central Pacific Hurricane Center . Retrieved November 11, 2009.
  4. 1 2 "Pacific Hurricane Threatens Sealab Project". The Miami News. Associated Press. September 2, 1965. p. 8A. Retrieved September 14, 2023 via Newspapers.com. Lock-green.svg
  5. Jack Williams (May 17, 2005). "California's Tropical Cyclones". USA Today. Retrieved March 25, 2010.
  6. United States Weather Bureau (1965). Climatological Data – National Summary. U.S. Department of Commerce, Weather Bureau. pp.  72–73. Retrieved March 25, 2011.
  7. "Death Count Now 6 In Mazatlan Storm". Tucson Daily Citizen. Associated Press. September 28, 1965. Retrieved August 31, 2022 via Newspapers.com. Lock-green.svg
  8. "Measuring total seasonal activity: The Accumulated Cyclone Energy (ACE) index". Climate Prediction Center. Archived from the original on August 26, 2010. Retrieved January 3, 2011.
  9. 1 2 3 Padgett, Gary (July 11, 2008). "Monthly Global Tropical Cyclone Summary: November 2007 First Installment". Australian Severe Weather. Retrieved February 24, 2024.
  10. "Tropical Cyclone Naming History and Retired Names". Miami, Florida: National Hurricane Center. Retrieved February 24, 2024.