The 1967 Pacific hurricane season started on June 1 and ended on November 30, 1967. The season was of little note except for Hurricanes Katrina and Olivia. Katrina made landfall on the Baja Peninsula, killing at least one and made 2,500 homeless. Olivia made landfall on the eastern side of the Baja Peninsula as a major hurricane—only one of two storms ever to do so. Hurricane/Typhoon Sarah formed in the Central Pacific and reached category 1 strength before crossing over to the Western Pacific.
On May 18, the first tropical depression of the season formed. It remained weak and dissipated the next day far out at sea.[1]
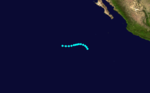
Tropical Storm Agatha
Tropical storm(SSHWS)
Duration
June 7– June 10
Peak intensity
50mph (85km/h) (1-min);
The first tropical storm of the season formed on June 7 at peak intensity far off from any landmass.[2] It remained at peak intensity until it was stopped being tracked on the 10th.[2]
Tropical Storm Bridget
Tropical storm(SSHWS)
Duration
June 16– June 16
Peak intensity
45mph (75km/h) (1-min);
On June 16, a tropical storm was identified south of Mexico with winds of 45mph (72km/h).[3] It weakened as it approached the Mexican mainland and dissipated later that day.[3]
Hurricane Carlotta
Category 1hurricane(SSHWS)
Duration
June 23– June 26
Peak intensity
85mph (140km/h) (1-min);
The first hurricane of the season, Hurricane Carlotta formed on June 23 near the Mexican coast. The storm gradually strengthened and became the next day. The storm stayed as a hurricane until June 25. It rapidly weakened and was stopped being tracked on June 26 south of the Baja Peninsula of Mexico.[4]
Tropical Storm Denise
Tropical storm(SSHWS)
Duration
July 5– July 18
Peak intensity
50mph (85km/h) (1-min);
On July 6, a tropical depression formed south of Mexico. The depression had its origin in a loosely organized area of squalls which had first appeared on satellite photos late on July 5. It strengthened to a tropical storm on the 9th and was named Denise.[5] On July 15, Denise, now in the Central Pacific weakened into a tropical depression. The depression dissipated south-west of Hawaii on July 18, never threatening land.[6][7][8]
Tropical Storm Eleanor
Tropical storm(SSHWS)
Duration
July 13– July 22
Peak intensity
65mph (100km/h) (1-min);
On June 29, a local hurricane center in Mexico started to track a disturbance off the coast Yucatan, the disturbance remained stationary and unable to develop before it crossed over and slowly moved westwards strengthening to a tropical depression southwest of the Baja Peninsula. It strengthened into a tropical storm late that night and was named Eleanor. It weakened into a tropical depression three days later, on July 16. The depression continued a long journey north-westward until July 22, when it dissipated. Eleanor never threatened land.[9]
On July 24, the sixth tropical storm of the season was identified relatively close to the Mexican coast. The storm continued a north-westward direction until it dissipated south of the Baja Peninsula.[10]
On July 25, a tropical depression was found far from any landmass. It reached tropical storm strength the next day and was named Georgette. It dissipated on July 30.[11]
Tropical Depression Hilary
Tropical depression(SSHWS)
Duration
August 10– August 11
Peak intensity
30mph (45km/h) (1-min);
On August 10, another tropical depression formed south of the Baja California Peninsula. It moved northwestward until it dissipated the next day.[1]
Hilary reportedly attained Tropical Storm strength, however the system's best track by the NHC does support the strength, and in post-storm analysis, Hilary was downgraded into a depression.
Tropical Storm Ilsa
Tropical storm(SSHWS)
Duration
August 12– August 18
Peak intensity
70mph (110km/h) (1-min);
On August 12, the eighth named storm of the year formed and was named Ilsa. It strengthened to a peak intensity of 70 miles (110km) per hour on the 14th. The storm held peak intensity for only 6 hours and weakened to have winds of 50 miles (80km) per hour. The storm weakened rapidly on the night of the 17th and dissipated the next morning never having affected land.[12]
On the day Ilsa dissipated, a new tropical storm was found and named Jewel. It rapidly strengthened that night and reached its peak intensity the next morning. It held peak intensity for 24 hours and weakened the next morning to a moderate tropical storm. It dissipated on the 22nd.[13]
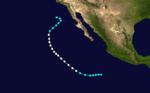
Hurricane Katrina
Category 1hurricane(SSHWS)
Duration
August 30– September 3
Peak intensity
85mph (140km/h) (1-min);
The first storm to make landfall, Katrina formed on August 30.[14] It became the third hurricane of the season 30 hours after it was named. The night that Katrina became a hurricane, it made landfall on the Baja Peninsula with winds of 85 miles (137km) per hour. It emerged soon after and paralleled the peninsula until making landfall at the head of the Bay of California. It rapidly weakened to a tropical depression and dissipated over Arizona.[15][16]
In Mexico, Katrina caused significant damage to parts of San Felipe. A total of 2,500 people were left homeless and 60 ships were sunk.[17][18] Five people were killed in Mexico.[19][20]
On September 5, a tropical storm formed and was named Lily. Lily became the season's fourth hurricane on the night of September 6. It slightly weakened to have winds of 75 miles (121km) per hour and stayed this way for 30 hours. It weakened to a tropical storm and dissipated as a tropical cyclone on the 11th,[21] though its surface circulation continued drifting westward near the 30th parallel north and remained identifiable on weather satellite images through the 20th.[22]
The only storm to form in the Central Pacific during the year, Sarah was found southeast of Hawaii on September 9 with winds of 70 miles (110km) per hour. It weakened slightly to have winds of 65 miles (105km) per hour. On September 11, Sarah became a hurricane for twelve hours, before weakening to a tropical storm.[23] Sarah then regained typhoon status crossed into the Western Pacific.[23] After it crossed, it rapidly strengthened to have winds of 150 miles (240km) per hour. The only measured pressure reading from Sarah was found in the Western Pacific, 932 hectopascals (27.5inHg). It steadily weakened and became extratropical with winds of 80 miles (130km) per hour on the 22nd.[24]
Tropical Storm Monica
Tropical storm(SSHWS)
Duration
September 13– September 20
Peak intensity
60mph (95km/h) (1-min);
On September 13, a tropical storm formed south of the Baja Peninsula and was named Monica. It weakened to a tropical depression the next morning and stayed that way until September 19. It became a tropical storm again but never regained peak intensity. It dissipated on September 20.[25]
Tropical Storm Nanette
Tropical storm(SSHWS)
Duration
September 13– September 21
Peak intensity
50mph (85km/h) (1-min);
On September 13, another tropical depression formed directly south of Mexico. Twelve hours later, it became the fourteenth tropical storm of the season, Nanette. It stayed at peak intensity of 50 miles (80km) per hour until September 21 when it dissipated.[26]
The only major hurricane of the season, Olivia formed on October 6 as a tropical depression. It slowly strengthened and became a tropical storm 3 days later. As a tropical storm, Olivia again took a long time to become a hurricane. It headed north-northeast and hit Baja California with 50mph winds. On the 13th, Olivia finally became a hurricane, while in the Gulf of California. It rapidly strengthened due to its very small size, and reached winds of 125 miles (201km) per hour for six hours and made landfall on the eastern side of the Baja California Peninsula at that strength. Olivia rapidly weakened even faster than it strengthened and dissipated 18 hours after landfall.[27]
Olivia is only one of two major hurricanes to make landfall on eastern side of the Baja California Peninsula the other being Hurricane Kiko of 1989. It was also the first major hurricane to be named in the East Pacific. No damage figures exist from Olivia, due to the scarce population of the area it struck. However, a total of 61 people died.[28]
Hurricane Priscilla
Category 1hurricane(SSHWS)
Duration
October 14– October 20
Peak intensity
85mph (140km/h) (1-min);
The final hurricane of the season formed on October 14 south of central Mexico as a tropical storm. It became a hurricane two days later. Priscilla stayed a hurricane for 48 hours until it weakened into a tropical storm on the 18th as it curved westward. It dissipated on October 20.[29]
Tropical Storm Ramona
Tropical storm(SSHWS)
Duration
October 21– November 3
Peak intensity
50mph (85km/h) (1-min);
On October 21, the final tropical storm of the season formed. It became a tropical storm the next morning and was named Ramona. Ramona stayed as a tropical storm until October 25 when it weakened to a tropical depression. The depression again strengthened to a tropical storm on the 29th as the storm started to recurve. The system dissipated while heading due north on November 3.[30]
Other systems
There were four additional systems in the Central Pacific that were likely tropical depressions but not operationally monitored.[31]
The following list of names was used for named storms that formed in the North Pacific Ocean east of 140°W in 1967.[32] This was the fourth of four sets of storm names established at the start of the 1960 season, and was utilized for the first in 1967. As such, every name used that season was used for the first time.[33][34] This list of names was used again for the 1971 season.[35]
Agatha
Bridget
Carlotta
Denise*
Eleanor
Francene
Georgette
Hilary
Ilsa
Jewel
Katrina
Lily
Monica
Nanette
Olivia
Priscilla
Ramona*
Sharon(unused)
Terry(unused)
Veronica(unused)
Winifred(unused)
One named storm, listed below, formed in the North Pacific between 140°W and the International Date Line in 1967. At the time, storm names within this region were assigned by the Joint Typhoon Warning Center on Guam.[32][33] Named storms in the table above that crossed into the area during the season are noted (*).[23]
↑ National Hurricane Operations Plan(PDF) (Report). Washington, D.C.: NOAA Office of the Federal Coordinator for Meteorological Services and Supporting Research. May 1971. p.97. Retrieved February 25, 2024.
This page is based on this Wikipedia article Text is available under the CC BY-SA 4.0 license; additional terms may apply. Images, videos and audio are available under their respective licenses.