1965 Pacific typhoon season

Last updated
1965 Pacific typhoon season
1965 Pacific typhoon season summary map.png
Season summary map
Seasonal boundaries
First system formedJanuary 2, 1965
Last system dissipatedDecember 28, 1965
Strongest storm
NameBess
  Maximum winds280 km/h (175 mph)
(1-minute sustained)
  Lowest pressure900 hPa (mbar)
Seasonal statistics
Total depressions44
Total storms35
Typhoons21
Super typhoons11 (unofficial)
(record high; tied with 1997)
Total fatalitiesUnknown
Total damageUnknown
Related articles
Pacific typhoon seasons
1963, 1964, 1965, 1966, 1967

The 1965 Pacific typhoon season has no official bounds; it ran year-round in 1965, but most tropical cyclones tend to form in the northwestern Pacific Ocean between June and December. These dates conventionally delimit the period of each year when most tropical cyclones form in the northwestern Pacific Ocean.

Contents

The scope of this article is limited to the Pacific Ocean, north of the equator and west of the International Date Line. Storms that form east of the date line and north of the equator are called hurricanes; see 1965 Pacific hurricane season. Tropical Storms formed in the entire west pacific basin were assigned a name by the Joint Typhoon Warning Center. Tropical depressions in this basin have the "W" suffix added to their number. Tropical depressions that enter or form in the Philippine area of responsibility are assigned a name by the Philippine Atmospheric, Geophysical and Astronomical Services Administration or PAGASA. This can often result in the same storm having two names.

Systems

1965 Pacific typhoon season

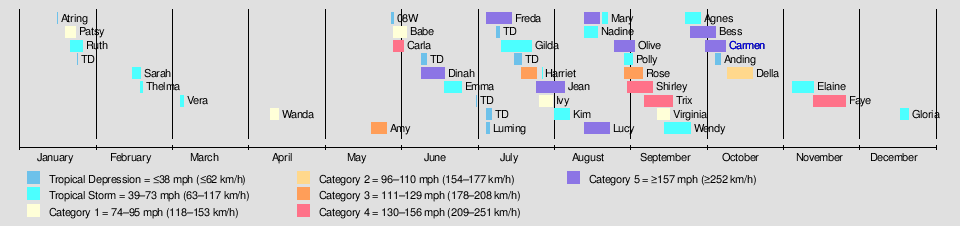
40 tropical depressions formed this year in the Western Pacific, of which 35 became tropical storms. 21 storms reached typhoon intensity, of which a record-tying 11 reached super typhoon strength and 8 reached category 5.

Tropical Depression Atring

Tropical depression (PAGASA)
CMA TD 1 1965 track.png  
DurationJanuary 16 – January 17
Peak intensity55 km/h (35 mph) (10-min);
1003  hPa  (mbar)

Possibly regenerated into Typhoon Patsy.

Typhoon Patsy (Bining)

Typhoon (JMA)
Category 1-equivalent typhoon (SSHWS)
Patsy 1965 track.png  
DurationJanuary 19 – January 23
Peak intensity120 km/h (75 mph) (1-min);
990  hPa  (mbar)

Severe Tropical Storm Ruth

Severe tropical storm (JMA)
Tropical storm (SSHWS)
Ruth 1965 track.png  
DurationJanuary 21 – January 26
Peak intensity110 km/h (70 mph) (1-min);
994  hPa  (mbar)

CMA Tropical Depression 4

Tropical depression (CMA)
CMA TD 4 1965 track.png  
DurationJanuary 24 – January 24
Peak intensity45 km/h (30 mph) (10-min);
1002  hPa  (mbar)

The depression stayed at sea and it did not last long at all.

Tropical Storm Sarah

Tropical storm (JMA)
Tropical storm (SSHWS)
Sarah 1965 track.png  
DurationFebruary 15 – February 18
Peak intensity85 km/h (50 mph) (1-min);
1002  hPa  (mbar)

Tropical Depression Thelma (Kuring)

Tropical depression (JMA)
Tropical storm (SSHWS)
Thelma 1965 track.png  
DurationFebruary 18 – February 19
Peak intensity75 km/h (45 mph) (1-min);
1000  hPa  (mbar)

Thelma was short-lived.

Tropical Storm Vera (Daling)

Tropical storm (JMA)
Tropical storm (SSHWS)
Vera 1965 track.png  
DurationMarch 6 – March 7
Peak intensity75 km/h (45 mph) (1-min);
1004  hPa  (mbar)

Vera did not last long.

Severe Tropical Storm Wanda

Severe tropical storm (JMA)
Category 1-equivalent typhoon (SSHWS)
Wanda 1965 track.png  
DurationApril 11 – April 14
Peak intensity120 km/h (75 mph) (1-min);
996  hPa  (mbar)

Wanda did not impact land.

Typhoon Amy (Elang)

Typhoon (JMA)
Category 3-equivalent typhoon (SSHWS)
Amy 1965 track.png  
DurationMay 21 – May 27
Peak intensity185 km/h (115 mph) (1-min);
976  hPa  (mbar)

Tropical Depression 08W

Tropical depression (SSHWS)
08W 1965 track.png  
DurationMay 29 – May 30
Peak intensity45 km/h (30 mph) (1-min);

Severe Tropical Storm Babe

Severe tropical storm (JMA)
Category 1-equivalent typhoon (SSHWS)
Babe 1965 track.png  
DurationMay 30 – June 4
Peak intensity150 km/h (90 mph) (1-min);
990  hPa  (mbar)

Severe Tropical Storm Carla (Goring)

Severe tropical storm (JMA)
Category 4-equivalent typhoon (SSHWS)
Carla 1965 track.png  
DurationMay 30 – June 3
Peak intensity220 km/h (140 mph) (1-min);
995  hPa  (mbar)

Carla formed with Babe. Carla rapidly intensified on June 1 but then rapidly weakened and then moved northeastward then dissipated on June 3.

CMA Tropical Depression 12

Tropical depression (CMA)
CMA TD 12 1965 track.png  
DurationJune 10 – June 12
Peak intensity45 km/h (30 mph) (10-min);
1000  hPa  (mbar)

Super Typhoon Dinah (Huling)

Typhoon (JMA)
Category 5-equivalent super typhoon (SSHWS)
Dinah 1965 track.png  
DurationJune 10 – June 19
Peak intensity295 km/h (185 mph) (1-min);
935  hPa  (mbar)

A surge in the southern hemisphere indraft developed into Tropical Depression 11W on June 12 to the east of the Philippines. It tracked west-northwestward, quickly strengthening to a tropical storm that day and a typhoon on the 13th. Dinah continued to quickly intensify as it turned to the northwest, and attained a peak of 185 mph on the 17th to the northeast of Luzon. Its southerly inflow was cut off, and Dinah weakened as it turned to the north. It hit southern Taiwan on the 18th as a 140 mph typhoon, and weakened greatly over the island to a tropical storm. At this time, Dinah exhibited a rare false radar eye. Dinah turned to the northeast, where it became extratropical near Japan on June 20. The storm killed 45 people on its path, and destroyed 5000 homes on Taiwan.

Tropical Storm Emma (Ibiang)

Tropical storm (JMA)
Tropical storm (SSHWS)
Emma 1965 track.png  
DurationJune 19 – June 26
Peak intensity95 km/h (60 mph) (1-min);
996  hPa  (mbar)

CMA Tropical Depression 15

Tropical depression (CMA)
CMA TD 15 1965 track.png  
DurationJuly 2 – July 2
Peak intensity55 km/h (35 mph) (10-min);
1004  hPa  (mbar)

CMA Tropical Depression 16

Tropical depression (CMA)
CMA TD 16 1965 track.png  
DurationJuly 6 – July 8
Peak intensity55 km/h (35 mph) (10-min);
1002  hPa  (mbar)

Tropical Depression 13W (Luming)

Tropical storm (PAGASA)
Tropical depression (SSHWS)
13W 1965 track.png  
DurationJuly 6 – July 9
Peak intensity65 km/h (40 mph) (10-min);
1004  hPa  (mbar)

Super Typhoon Freda (Miling)

Typhoon (JMA)
Category 5-equivalent super typhoon (SSHWS)
Freda 1965 track.png  
DurationJuly 6 – July 16
Peak intensity260 km/h (160 mph) (1-min);
925  hPa  (mbar)

160 mph Super Typhoon Freda, which began its life on July 6, hit northern Luzon on the 13th. It crossed the island and the South China Sea, where it hit Hainan Island as a 115 mph typhoon on the 15th. Freda dissipated the next day over China, after causing heavy flooding killing an unknown number of people. In Hong Kong, Freda killed 2 people. [1]

CMA Tropical Depression 18

Tropical depression (CMA)
CMA TD 18 1965 track.png  
DurationJuly 10 – July 11
Peak intensity45 km/h (30 mph) (10-min);
999  hPa  (mbar)

The depression stayed away from land, yet it did not last long.

Severe Tropical Storm Gilda (Narsing)

Severe tropical storm (JMA)
Tropical storm (SSHWS)
Gilda 1965.png   Gilda 1965 track.png
DurationJuly 12 – July 24
Peak intensity110 km/h (70 mph) (1-min);
985  hPa  (mbar)

Gilda did not last long, although it caused some damage.

CMA Tropical Depression 20

Tropical depression (CMA)
CMA TD 20 1965 track.png  
DurationJuly 17 – July 20
Peak intensity55 km/h (35 mph) (10-min);

The depression did not last long.

Typhoon Harriet (Openg)

Typhoon (JMA)
Category 3-equivalent typhoon (SSHWS)
Typhoon Harriet 24 Jun 1965.png   Harriet 1965 track.png
DurationJuly 20 – July 28
Peak intensity185 km/h (115 mph) (1-min);
970  hPa  (mbar)

Harriet hit Taiwan as a Category 3 typhoon.

Super Typhoon Jean (Rubing)

Typhoon (JMA)
Category 5-equivalent super typhoon (SSHWS)
Jean 1965 track.png  
DurationJuly 26 – August 6
Peak intensity260 km/h (160 mph) (1-min);
940  hPa  (mbar)

Super Typhoon Jean, after reaching a peak of 160 mph on August 3, weakened slightly to hit southwestern Japan as a 150 mph super typhoon on August 5. The typhoon brought heavy winds to Southern Japan before becoming extratropical on the 7th. Typhoon Jean killed 28 people throughout Southern Japan. [2]

Typhoon Ivy (Pining)

Typhoon (JMA)
Category 1-equivalent typhoon (SSHWS)
Ivy 1965 track.png  
DurationJuly 27 – August 1
Peak intensity150 km/h (90 mph) (1-min);
990  hPa  (mbar)

Ivy did a loop and only survived 5 days before dissipating.

Severe Tropical Storm Kim

Severe tropical storm (JMA)
Tropical storm (SSHWS)
Kim 1965 track.png  
DurationAugust 2 – August 8
Peak intensity110 km/h (70 mph) (1-min);
990  hPa  (mbar)

Kim stayed at sea.

Super Typhoon Lucy

Typhoon (JMA)
Category 5-equivalent super typhoon (SSHWS)
Lucy 1965.png   Lucy 1965 track.png
DurationAugust 14 – August 24
Peak intensity280 km/h (175 mph) (1-min);
940  hPa  (mbar)

On August 14 a tropical depression formed and was named Lucy after it became a tropical storm. Lucy became a typhoon and soon into a 175 mph super typhoon. Lucy weakened and struck Japan as a minimal typhoon. Lucy dissipated on August 24.

Super Typhoon Mary (Saling)

Typhoon (JMA)
Category 5-equivalent super typhoon (SSHWS)
MaryAug191965TIROSVIII.jpg   Mary 1965 track.png
DurationAugust 14 – August 23
Peak intensity280 km/h (175 mph) (1-min);
950  hPa  (mbar)

175 mph Super Typhoon Mary weakened from its peak to hit eastern Taiwan on August 18 as a 105 mph typhoon. The typhoon brought strong winds and heavy rain before dissipating over China on the 20th.

Tropical Storm Nadine

Tropical storm (JMA)
Tropical storm (SSHWS)
Nadine 1965 track.png  
DurationAugust 14 – August 19
Peak intensity110 km/h (70 mph) (1-min);
990  hPa  (mbar)

Super Typhoon Olive

Typhoon (JMA)
Category 5-equivalent super typhoon (SSHWS)
Olive 1965 track.png  
DurationAugust 26 – September 3
Peak intensity280 km/h (175 mph) (1-min);
940  hPa  (mbar)

Tropical Storm Polly (Tasing)

Tropical storm (JMA)
Tropical storm (SSHWS)
Polly 1965 track.png  
DurationAugust 30 – September 2
Peak intensity85 km/h (50 mph) (1-min);
994  hPa  (mbar)

Typhoon Rose (Unding)

Typhoon (JMA)
Category 3-equivalent typhoon (SSHWS)
Rose 1965 track.png  
DurationAugust 30 – September 6
Peak intensity185 km/h (115 mph) (1-min);
980  hPa  (mbar)

Super Typhoon Shirley

Typhoon (JMA)
Category 4-equivalent typhoon (SSHWS)
Shirley 1965 track.png  
DurationAugust 31 – September 10
Peak intensity240 km/h (150 mph) (1-min);
940  hPa  (mbar)

130 mph Typhoon Shirley, after weakening from a peak of 150 mph, hit southern Japan on September 10, causing moderate damage and heavy rain. Resulting floods and landslides killed 67 people and left 6 missing. [2]

Super Typhoon Trix (Walding)

Typhoon (JMA)
Category 4-equivalent typhoon (SSHWS)
Trix 1965 track.png  
DurationSeptember 7 – September 18
Peak intensity240 km/h (150 mph) (1-min);
935  hPa  (mbar)

Typhoon Trix struck central Honshū Island in Japan just days after Typhoon Shirley. Trix caused heavy rains 98 people were killed and 9 were missing due to the resulting flooding and landslides. [2]

Severe Tropical Storm Virginia

Severe tropical storm (JMA)
Category 1-equivalent typhoon (SSHWS)
Virginia 1965 track.png  
DurationSeptember 12 – September 17
Peak intensity120 km/h (75 mph) (1-min);
980  hPa  (mbar)

Severe Tropical Storm Wendy (Yeyeng)

Severe tropical storm (JMA)
Tropical storm (SSHWS)
Wendy 1965 track.png  
DurationSeptember 15 – September 25
Peak intensity95 km/h (60 mph) (1-min);
986  hPa  (mbar)

Tropical Storm Agnes

Tropical storm (JMA)
Tropical storm (SSHWS)
Agnes 1965 track.png  
DurationSeptember 23 – September 29
Peak intensity110 km/h (70 mph) (1-min);
990  hPa  (mbar)

Tropical Storm Agnes struck Hong Kong killing 5 people. [1]

Super Typhoon Bess

Typhoon (JMA)
Category 5-equivalent super typhoon (SSHWS)
Bess 1965 track.png  
DurationSeptember 25 – October 5
Peak intensity280 km/h (175 mph) (1-min);
900  hPa  (mbar)

Bess was the strongest storm of the season. The storm formed on September 27 northeast of Palau and dissipated on October 6 north of Japan.

Late September Depression

Tropical depression (SSHWS)
Temporary cyclone north.svg   Late September Depression-1965.png
DurationSeptember 25 – September 26
Peak intensityWinds not specified;

Super Typhoon Carmen

Typhoon (JMA)
Category 5-equivalent super typhoon (SSHWS)
Typhoon Carmen surface analysis 6 October 1965.png   Carmen 1965 track.png
DurationOctober 1 – October 9
Peak intensity280 km/h (175 mph) (1-min);
910  hPa  (mbar)

Tropical Depression Anding

Anding did not last long.

Tropical depression (PAGASA)
Temporary cyclone north.svg  
DurationOctober 5 – October 7
Peak intensity55 km/h (35 mph) (10-min);

Typhoon Della

Typhoon (JMA)
Category 2-equivalent typhoon (SSHWS)
DellaOct1819650126z.JPG   Della 1965 track.png
DurationOctober 10 – October 20
Peak intensity155 km/h (100 mph) (1-min);
975  hPa  (mbar)

Della stayed at sea.

Tropical Storm Elaine

Tropical storm (JMA)
Tropical storm (SSHWS)
Elaine 1965 track.png  
DurationNovember 5 – November 13
Peak intensity95 km/h (60 mph) (1-min);
996  hPa  (mbar)

Super Typhoon Faye (Binang)

Typhoon (JMA)
Category 4-equivalent typhoon (SSHWS)
Faye 1965 track.png  
DurationNovember 13 – November 26
Peak intensity250 km/h (155 mph) (1-min);
930  hPa  (mbar)

Tropical Depression Gloria

Tropical depression (JMA)
Tropical storm (SSHWS)
Gloria 1965 track.png  
DurationDecember 18 – December 21
Peak intensity75 km/h (45 mph) (1-min);
1003  hPa  (mbar)

Storm names

  • Agnes 33W
  • Bess 34W
  • Carmen 35W
  • Della 37W
  • Elaine 38W
  • Faye 39W
  • Gloria 40W
  • Hester
  • Irma
  • Judy
  • Kit
  • Lola
  • Mamie
  • Nina
  • Ora
  • Phyllis
  • Rita
  • Susan
  • Tess
  • Viola
  • Winnie
  • Alice
  • Betty
  • Cora
  • Doris
  • Elsie
  • Flossie
  • Grace
  • Helen
  • Ida
  • June
  • Kathy
  • Lorna
  • Marie
  • Nancy
  • Olga
  • Pamela
  • Ruby
  • Sally
  • Therese
  • Violet
  • Wilda
  • Anita
  • Billie
  • Clara
  • Dot
  • Ellen
  • Fran
  • Georgia
  • Hope
  • Iris
  • Joan
  • Kate
  • Louise
  • Marge
  • Nora
  • Opal
  • Patsy 1W
  • Ruth 2W
  • Sarah 3W
  • Thelma 4W
  • Vera 5W
  • Wanda 6W
  • Amy 7W
  • Babe 9W
  • Carla 10W
  • Dinah 11W
  • Emma 12W
  • Freda 14W
  • Gilda 15W
  • Harriet 16W
  • Ivy 18W
  • Jean 17W
  • Kim 19W
  • Lucy 20W
  • Mary 21W
  • Nadine 22W
  • Olive 25W
  • Polly 26W
  • Rose 27W
  • Shirley 28W
  • Trix 29W
  • Virginia 31W
  • Wendy 32W

Philippines

Used Names

Official List
AtringBiningKuringDalingElang
GoringHulingIbiangLumingMiling
NarsingOpengPiningRubingSaling
TasingUndingWaldingYeyeng
Auxiliary list used
Anding
Binang

Unused names

Unused names
Kadiang (unused)Dinang (unused)Epang (unused)Gundang (unused)

The Philippine Atmospheric, Geophysical and Astronomical Services Administration uses its own naming scheme for tropical cyclones in their area of responsibility. PAGASA assigns names to tropical depressions that form within their area of responsibility and any tropical cyclone that might move into their area of responsibility. Should the list of names for a given year prove to be insufficient, names are taken from an auxiliary list, the first 6 of which are published each year before the season starts. Names not retired from this list will be used again in the 1969 season. PAGASA uses its own naming scheme that starts in the Filipino alphabet, with names of Filipino female names ending with "ng" (A, B, K, D, etc.). Names that were not assigned/going to use are marked in gray.

See also

Related Research Articles

<span class="mw-page-title-main">2005 Pacific typhoon season</span> Typhoon season in the Western Pacific Ocean

The 2005 Pacific typhoon season was the least active typhoon season since 2000, producing 23 named storms, of which 13 became typhoons. It was an event in the annual cycle of tropical cyclone formation, in which tropical cyclones form in the western Pacific Ocean. The season ran throughout 2005, though most tropical cyclones typically develop between May and October. The season's first named storm, Kulap, developed on January 13, while the season's last named storm, Bolaven, dissipated on November 20. The season's first typhoon, Haitang, reached typhoon status on July 13, and became the first super typhoon of the year three days later.

<span class="mw-page-title-main">2000 Pacific typhoon season</span> Typhoon season in the Western Pacific Ocean

The 2000 Pacific typhoon season marked the first year using names contributed by the World Meteorological Organization. It was a rather below-average season, producing a total of 23 tropical storms, 13 typhoons and 4 intense typhoons. The season ran throughout 2000, though typically most tropical cyclones develop between May and October. The season's first named storm, Damrey, developed on May 7, while the season's last named storm, Soulik, dissipated on January 4 of the next year.

<span class="mw-page-title-main">1998 Pacific typhoon season</span> Typhoon season in the Western Pacific Ocean

The 1998 Pacific typhoon season was the least active Pacific typhoon season on record, until it was surpassed 12 years later. It would produce 16 tropical storms, 8 strengthening into typhoons. The scope of this article is limited to the Pacific Ocean, north of the equator and west of the international date line. Storms that form east of the date line and north of the equator are called hurricanes; see 1998 Pacific hurricane season. Tropical Storms formed in the entire west Pacific basin were assigned a name by the Joint Typhoon Warning Center. Tropical depressions in this basin have the "W" suffix added to their number. Tropical depressions that enter or form in the Philippine area of responsibility are assigned a name by the Philippine Atmospheric, Geophysical and Astronomical Services Administration or PAGASA. This can often result in the same storm having two names.

<span class="mw-page-title-main">1996 Pacific typhoon season</span> Typhoon season in the Western Pacific Ocean

The 1996 Pacific typhoon season was a relatively active season, producing 30 tropical storms, 16 typhoons and six super typhoons. It has no official bounds; it ran year-round in 1996, but most tropical cyclones tend to form in the northwestern Pacific Ocean between May and November. These dates conventionally delimit the period of each year when most tropical cyclones form in the northwestern Pacific Ocean. However the first named storm, Ann, did not develop until April 3. The final named storm, Greg, dissipated on December 27.

<span class="mw-page-title-main">1995 Pacific typhoon season</span> Typhoon season in the Western Pacific Ocean

The 1995 Pacific typhoon season occurred all year round, unusual in that most tropical cyclones tend to form in the northwestern Pacific Ocean between May and November.

<span class="mw-page-title-main">1993 Pacific typhoon season</span> Typhoon season in the Western Pacific Ocean

The 1993 Pacific typhoon season was the most active season for the Philippines, seeing a total of 32 storms forming or entering their area of responsibility. Overall, it was an average season, spawning 28 tropical storms, 15 typhoons and three super typhoons. The season had no official bounds; it ran year-round in 1993, but most tropical cyclones tend to form in the northwestern Pacific Ocean between May and November. These dates conventionally delimit the period of each year when most tropical cyclones form in the northwestern Pacific Ocean.

<span class="mw-page-title-main">1992 Pacific typhoon season</span> Typhoon season in the Western Pacific Ocean

The 1992 Pacific typhoon season is the fourth consecutive above-average season, producing 31 tropical storms, 16 typhoons and five super typhoons. It had no official bounds; it ran year-round in 1992. Despite this, most tropical cyclones tend to form in the northwestern Pacific Ocean between May and November. These dates conventionally delimit the period of each year when most tropical cyclones form in the northwestern Pacific Ocean.

<span class="mw-page-title-main">1987 Pacific typhoon season</span> Typhoon season in the Pacific Ocean

The 1987 Pacific typhoon season has no official bounds; it ran year-round in 1987, but most tropical cyclones tend to form in the northwestern Pacific Ocean between May and November. These dates conventionally delimit the period of each year when most tropical cyclones form in the northwestern Pacific Ocean. Tropical storms formed in the entire west pacific basin were assigned a name by the Joint Typhoon Warning Center. Tropical depressions that enter or form in the Philippine area of responsibility are assigned a name by the Philippine Atmospheric, Geophysical and Astronomical Services Administration or PAGASA. This can often result in the same storm having two names.

<span class="mw-page-title-main">1980 Pacific typhoon season</span> Period of formation of tropical cyclones in the Western Pacific Ocean in 1980

The 1980 Pacific typhoon season was a slightly-below average season when compared to the long-term average, though it featured several intense storms. It ran year-round in 1980, but most tropical cyclones formed between June and December. These dates conventionally delimit the period of each year when most tropical cyclones form in the northwestern Pacific Ocean. A total of 28 tropical depressions formed this year in the Western Pacific, of which 24 became tropical storms and were assigned a name by the Joint Typhoon Warning Center. Beginning in March, tropical cyclones formed in each subsequent month through December. Of the 24 named storms, 15 storms reached typhoon intensity, of which 2 reached super typhoon strength.

<span class="mw-page-title-main">1979 Pacific typhoon season</span> Period of formation of tropical cyclones in the Western Pacific Ocean in 1979

The 1979 Pacific typhoon season featured the largest and most intense tropical cyclone recorded globally, Typhoon Tip. The season also experienced slightly above-average tropical cyclone activity. The season had no official bounds; it ran year-round in 1979, but most tropical cyclones tend to form in the northwestern Pacific Ocean between June and December. These dates conventionally delimit the period of each year when most tropical cyclones form in the northwestern Pacific Ocean.

<span class="mw-page-title-main">1978 Pacific typhoon season</span> Typhoon season in the Northwestern Pacific ocean

The 1978 Pacific typhoon season was a very active season that produced 31 tropical storms, 16 typhoons and one intense typhoon. It ran year-round in 1978, but most tropical cyclones tend to form in the northwestern Pacific Ocean between June and December. These dates conventionally delimit the period of each year when most tropical cyclones form in the northwestern Pacific Ocean.

<span class="mw-page-title-main">1977 Pacific typhoon season</span>

The 1977 Pacific typhoon season was one of the least active Pacific typhoon seasons on record, with only 19 tropical storms forming. It was also the second of three known typhoon seasons during the satellite era to not produce a Category 5-equivalent super typhoon, sandwiched between the 1974 and 2017 seasons. The season's first storm, Severe Tropical Storm Patsy, formed on March 23 and the last, Typhoon Mary, dissipated on January 2, 1978. With Mary spanning two calendar years, it became the fourth typhoon to do so since 1945. Since then, two other typhoons have achieved this feat.

<span class="mw-page-title-main">1976 Pacific typhoon season</span>

The 1976 Pacific typhoon season has no official bounds; it ran year-round in 1976, but most tropical cyclones tend to form in the northwestern Pacific Ocean between June and December. These dates conventionally delimit the period of each year when most tropical cyclones form in the northwestern Pacific Ocean.

<span class="mw-page-title-main">1970 Pacific typhoon season</span> Typhoon season in the Pacific Ocean

The 1970 Pacific typhoon season has no official bounds; it ran year-round in 1970, but most tropical cyclones tend to form in the northwestern Pacific Ocean between June and December. These dates conventionally delimit the period of each year when most tropical cyclones form in the northwestern Pacific Ocean.

<span class="mw-page-title-main">1975 Pacific typhoon season</span>

The 1975 Pacific typhoon season was one of the deadliest tropical cyclone seasons on record, with nearly 229,000 fatalities occurring during the season. It had no official bounds; it ran year-round in 1975, but most tropical cyclones tend to form in the northwestern Pacific Ocean between June and December. These dates conventionally delimit the period of each year when most tropical cyclones form in the northwestern Pacific Ocean.

<span class="mw-page-title-main">1974 Pacific typhoon season</span> Typhoon season in the Pacific Ocean

The 1974 Pacific typhoon season was the first season on record to not feature a Category 5 equivalent super typhoon; a feat later repeated by the 1977 and 2017 seasons. Even so, the season was overly active, with 32 tropical storms and 16 typhoons being developed this year. It has no official bounds; it ran year-round in 1974, but most tropical cyclones tend to form in the northwestern Pacific Ocean between June and December. These dates conventionally delimit the period of each year when most tropical cyclones form in the northwestern Pacific Ocean.

<span class="mw-page-title-main">1973 Pacific typhoon season</span> Time of tropical cyclone formation in the western Pacific during 1973

The 1973 Pacific typhoon season, in comparison to the two years preceding it, was a below average season, with only 21 named storms and 12 typhoons forming. However, it featured Typhoon Nora, which ties Typhoon June of 1975 for the second strongest typhoon on record. It has no official bounds; it ran year-round in 1973, but most tropical cyclones tend to form in the northwestern Pacific Ocean between June and December. These dates conventionally delimit the period of each year when most tropical cyclones form in the northwestern Pacific Ocean.

<span class="mw-page-title-main">1969 Pacific typhoon season</span> Time of typhoon formation in 1969

The 1969 Pacific typhoon season was the fourth least-active season on record. The season had no official bounds; it ran year-round in 1969, but most tropical cyclones tend to form in the northwestern Pacific Ocean between June and December. These dates conventionally delimit the period of each year when most tropical cyclones form in the northwestern Pacific Ocean.

<span class="mw-page-title-main">1968 Pacific typhoon season</span>

The 1968 Pacific typhoon season has no official bounds; it ran year-round in 1968, but most tropical cyclones tend to form in the northwestern Pacific Ocean between June and December. These dates conventionally delimit the period of each year when most tropical cyclones form in the northwestern Pacific Ocean.

<span class="mw-page-title-main">1967 Pacific typhoon season</span> Typhoon season in the Pacific Ocean

The 1967 Pacific typhoon season was one of the most active Pacific typhoon seasons on record, witnessing the formation of 35 tropical storms during the season. It began on January 1, 1967, though most storms usually form between June and December within the basin. The first storm of the season, Ruby, formed on January 28 west of the Philippines. The scope of this article is limited to the Pacific Ocean, north of the equator and west of the international date line. Storms that form east of the date line and north of the equator are called hurricanes; see 1967 Pacific hurricane season. Tropical depressions that are monitored by the United States' Joint Typhoon Warning Center (JTWC) were given a numerical designation with a "W" suffix, and any storms reaching 1-minute sustained winds of over 40 mph were given a name. Tropical depressions that enter or form in the Philippine area of responsibility are assigned a name by the Philippine Atmospheric, Geophysical and Astronomical Services Administration or PAGASA. This can often result in the same storm having two names.

References

  1. 1 2 "Historical Information". Archived from the original on 2015-05-16. Retrieved 2007-12-17.
  2. 1 2 3 Digital Typhoon: Disaster Information