1970 Pacific typhoon season

Last updated
1970 Pacific typhoon season
1970 Pacific typhoon season summary map.png
Season summary map
Seasonal boundaries
First system formedJanuary 1, 1970
Last system dissipatedDecember 19, 1970
Strongest storm
NameHope
  Maximum winds280 km/h (175 mph)
(1-minute sustained)
  Lowest pressure895 hPa (mbar)
Seasonal statistics
Total depressions31
Total storms26
Typhoons13
Super typhoons7 (unofficial)
Total fatalities> 1,847
Total damage> $216 million (1970 USD)
Related articles
Pacific typhoon seasons
1968, 1969, 1970, 1971, 1972

The 1970 Pacific typhoon season has no official bounds; it ran year-round in 1970, but most tropical cyclones tend to form in the northwestern Pacific Ocean between June and December. These dates conventionally delimit the period of each year when most tropical cyclones form in the northwestern Pacific Ocean.

Contents

The scope of this article is limited to the Pacific Ocean, north of the equator and west of the International Dateline. Storms that form east of the date line and north of the equator are called hurricanes; see 1970 Pacific hurricane season. Tropical Storms formed in the entire west Pacific basin were assigned a name by the Joint Typhoon Warning Center. Tropical depressions in this basin have the "W" suffix added to their number. Tropical depressions that enter or form in the Philippine area of responsibility are assigned a name by the Philippine Atmospheric, Geophysical and Astronomical Services Administration or PAGASA. This can often result in the same storm having two names.

Systems

Typhoon PatsyTyphoon KateTyphoon Joan1970 Pacific typhoon season

27 tropical depressions formed this year in the Western Pacific, of which 24 became tropical storms. 12 storms reached typhoon intensity, of which 7 reached super typhoon strength.

Typhoon Nancy (Atang)

Typhoon (JMA)
Category 4-equivalent typhoon (SSHWS)
NancyFeb2419700501zESSA9.jpg   Nancy 1970 track.png
DurationFebruary 19 – February 28
Peak intensity220 km/h (140 mph) (1-min);
950  hPa  (mbar)

Nancy originated from the interaction between an active ITCZ and a cold front near the Caroline Islands and the equator in mid February. An increase in convection was shown by weather satellites on February 18 and by the following day a recon aircraft found a weak depression to the south of the Caroline Islands. The depression moved west, suppressed south by a high pressure ridge to the north, and gradually strengthened into a tropical storm and was given the name Nancy early on February 20. Nancy became a typhoon on the 22 about 100 miles northwest from Woleai. On February 23 Nancy passed to the north of Yap where strong gale winds occurred. Continuing to encounter more favorable conditions Nancy was able to achieve a peak intensity of 140 mph (220 km/h) and a pressure of 952 hPa (28.1 inHg) on February 24. [1] This was the equivalent of a category four hurricane. It is rare to have a typhoon of this magnitude during the month of February, as noted by the JTWC, only Irma of the 1953 season reached the same intensity at the time. As Nancy approached the Philippine Islands the typhoon traversed to the western ambit of the ridge that had kept it to the south, allowing it to move farther in a north direction. During the 25 Nancy passed east off the coast of the easternmost islands of the Philippines. On the island of Catanduanes, the edge of the eye brushed the eastern coast. A U. S. Coast Guard loran station on Catanduanes recorded intense winds, at which point the equipment malfunctioned. The storm encountered a hostile environment to the northeast of Luzon and began to weaken. By February 26 Nancy had become a tropical storm and shortly afterward had transitioned into an extra tropical cyclone and moved off into open ocean. By the 28 what remained of Nancy was a frontal trough. [2]

Nancy caused significant damage to the Philippines and surrounding islands. Particularly hard hit were the islands of Catanduanes and Samar. Damage was estimated near a million dollars with 5,000 families homeless. On the Island of Yap heavy storm surge caused $160,000 in damages, luckily no one was killed. A 6,065 ton American ship, Antinous, encountered the full brunt of the typhoon shortly before midnight, February 24. Ship logs record sea swells of over 40 feet, winds over 100 knots, a central pressure of 953 millibars, and three of the ships large butane tanks on the main dock broke free during the storm along with a portion of its bulwark. [2]

Typhoon Olga (Deling)

Typhoon (JMA)
Category 5-equivalent super typhoon (SSHWS)
OlgaJul119700644zITOS1.jpg   Olga 1970 track.png
DurationJune 27 – July 5
Peak intensity260 km/h (160 mph) (1-min);
905  hPa  (mbar)

In mid-June a change in the jet stream over a large part of the Pacific Ocean caused an increase in tropical wave frequency; one becoming the precursor to Olga. The wave was first noticed near the Marshall Islands, particularly the Island of Majuro on June 24. As it moved west weather satellites depicted the wave had begun to organize with considerable convection and spiraling storm bands as it neared the Central Caroline Islands. Due to the waves close proximity to a high pressure area to the north, strong easterlies accelerated it to the west. The increased forward speed inhibited the establishment of a circulation until it was south of Guam early on June 29. Later that day reconnaissance found a closed center and gale-force winds, prompting the JTWC to upgrade the low into a tropical storm and was given the name Olga. As it entered the Philippine Sea the ridge that had kept it to the south began to weaken allowing Olga to move in a northwestward direction. As Olga entered an increasingly favorable environment, the storm slowed its forward speed and strengthened into a typhoon late on June 29. Rapid intensification followed as the system bottomed out at a pressure of 904 hPa (26.7 inHg) and winds of 160 mph (260 km/h) on July 1. [3] The rapid 62 millibar drop between June 30 and July 1 caused an intense wind profile surrounding the small eye. The storm followed a break in the ridge and moved north while gradually weakening. As Olga was passing to the east of Taiwan a short wave from the China mainland gave an eastward component to the storm's motion. A low developed following the short wave and began to influence Olga, causing the typhoon to weaken. Dry air soon entered the circulation, reducing the systems overall convection. During July 5 Olga made landfall on the Kansai region of Japan, south of Osaka, as a tropical storm. The system continued into the Sea of Japan, and merged with a cold front. The remaining low tracked over South Korea before completely dissipating on July 7. [2]

Olga was a very intense typhoon, causing an estimated ten million dollars to Japan alone. While passing through the Ryukyu Islands wind measurements were as high as 130 mph (205 km/h) on July 4. Heavy rains occurred over Japan, up to 14 inches in some areas, caused landslides and extensive flooding; killing 20. In South Korea 29 deaths were caused by the heavy rainfall associated with Olga's remnants. [2]

Severe Tropical Storm Pamela (Klaring)

Severe tropical storm (JMA)
Tropical storm (SSHWS)
PamelaJun2919700646z.gif   Pamela 1970 track.png
DurationJune 28 – July 1
Peak intensity95 km/h (60 mph) (1-min);
980  hPa  (mbar)

Forming on June 28, Pamela slowly travelled towards the Philippines, and made landfall late on June 30. The tropical storm brought rains and winds to the Philippines, but no major damage was reported. Having greatly weakened after landfall, Pamela degenerated into a remnant low and dissipated over the South China Sea on July 1, just as Category 5 Super Typhoon Olga reached its peak.

Severe Tropical Storm Ruby (Emang)

Severe tropical storm (JMA)
Tropical storm (SSHWS)
Temporary cyclone north.svg   Ruby 1970 track.png
DurationJuly 11 – July 17
Peak intensity100 km/h (65 mph) (1-min);
985  hPa  (mbar)

Tropical Storm Ruby formed as a disturbance east of the Philippines. It slowly traveled west-southwest, becoming a tropical storm on the 12th. It crossed the northern part of Luzon before making landfall in China on the 15th. [2] The storm became extratropical over China, and proceeded northwest, crossing Hokkaido before dissipating over the Aleutian Islands.

Tropical Storm Sally

Tropical storm (JMA)
Tropical storm (SSHWS)
SallyJul2119700430zITOS1.jpg   Sally 1970 track.png
DurationJuly 19 – July 23
Peak intensity75 km/h (45 mph) (1-min);
992  hPa  (mbar)

Tropical Storm Sally stayed far offshore during its life. It formed as a disturbance over the Pacific on the 18th, became a tropical storm on the 21st, then became extratropical on the 22nd and dissipated the next day. [2]

Tropical Depression 07W (Gading)

Tropical depression (JMA)
Tropical storm (SSHWS)
Temporary cyclone north.svg   07W 1970 track.png
DurationJuly 25 – August 2
Peak intensity85 km/h (50 mph) (1-min);
994  hPa  (mbar)

Tropical Storm 06W

Tropical storm (JMA)
Tropical storm (SSHWS)
Temporary cyclone north.svg   06W 1970 track.png
DurationJuly 28 – August 1
Peak intensity75 km/h (45 mph) (1-min);
994  hPa  (mbar)

Tropical Storm Therese

Tropical storm (JMA)
Tropical storm (SSHWS)
ThereseAug319700322zITOS1.jpg   Therese 1970 track.png
DurationAugust 1 – August 4
Peak intensity75 km/h (45 mph) (1-min);
990  hPa  (mbar)

Tropical Storm Therese also remained far at sea during its life. It formed as a disturbance on the 30th, then turned northwestward and became a tropical storm, before undergoing extratropical transition and dissipating over the Bering Sea.

Tropical Storm Violet (Heling)

Tropical storm (JMA)
Tropical storm (SSHWS)
VioletAug619700608zITOS1.jpg   Violet 1970 track.png
DurationAugust 3 – August 9
Peak intensity75 km/h (45 mph) (1-min);
992  hPa  (mbar)

Tropical Storm Violet formed east of the Philippines, then traveled westward, becoming a tropical storm before making landfall on Luzon. Violet then crossed the South China Sea before making landfall in China as a weak tropical storm. It dissipated over China shortly after.

Typhoon Wilda (Iliang)

Typhoon (JMA)
Category 3-equivalent typhoon (SSHWS)
WildaAug1419700558ITOS1.jpg   Wilda 1970 track.png
DurationAugust 9 – August 15
Peak intensity195 km/h (120 mph) (1-min);
940  hPa  (mbar)

A broad surface trough developed into Tropical Storm Wilda on August 9. After drifting to the west-southwest, it turned to the north, where it reached a peak of 120 mph winds on the 12th near Okinawa. Wilda continued northward, and weakened slightly to a 105 mph typhoon before making landfall on western Kyūshū on the 14th. Wilda accelerated to the northeast, and became extratropical on the 15th. The typhoon caused heavy rain, killing 11 people.

Typhoon Anita

Typhoon (JMA)
Category 4-equivalent typhoon (SSHWS)
AnitaAug2019700550UTCITOS1.png   Anita 1970 track.png
DurationAugust 15 – August 22
Peak intensity250 km/h (155 mph) (1-min);
910  hPa  (mbar)

An upper level low contributed to the formation of Tropical Depression 11W on August 16 over the northern Marianas Islands. It quickly intensified, reaching typhoon status that night. Anita's intensification rate slowed initially, but as it continued northwestward late on the 18th and 19th, Anita rapidly strengthened to a 155 mph super typhoon. It weakened as it accelerated to the north-northwest, and hit western Shikoku in Japan on the 21st as a 115 mph typhoon. Anita, which became extratropical on the 22nd, caused 23 deaths and sank 31 vessels.

Typhoon Billie (Loleng)

Typhoon (JMA)
Category 3-equivalent typhoon (SSHWS)
BillieAug2719700640UTCITOS1.png   Billie 1970 track.png
DurationAugust 21 – August 31
Peak intensity205 km/h (125 mph) (1-min);
945  hPa  (mbar)

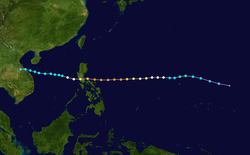
Typhoon Billie formed in the Philippine Sea as a weak depression. It intensified while heading northwards, becoming a tropical storm on the 23rd, a typhoon on the 25th, and reaching its maximum intensity of 110-knot winds and a 945-millibar central pressure as it passed the Ryukyu Islands on the 27th. The storm brushed South Korea as a category-1-equivalent typhoon on the 29th before making landfall in North Korea on the 30th. [2] The remnants of Billie dissipated over the Sino-Soviet border shortly after.

Typhoon Clara

Typhoon (JMA)
Category 2-equivalent typhoon (SSHWS)
ClaraAug2819700541zITOS1.png   Clara 1970 track.png
DurationAugust 25 – September 4
Peak intensity155 km/h (100 mph) (1-min);
960  hPa  (mbar)

Tropical Storm Clara developed on August 26 southeast of Japan from an upper tropospheric circulation that separated from the Mid-Pacific trough. It quickly strengthened, and became a typhoon on the 27th at 31.9º North, one of only 16 Western Pacific typhoons to reach that strength north of 30ºN. Clara peaked at 95 mph before coming close to Japan, when a shortwave trough forced it sharply eastward. The storm maintained its intensity until becoming extratropical on September 3. An interesting fact about Clara was a reconnaissance mission flown into Hurricane Dot in the central Pacific also flew into Clara on the same flight, an unusual accomplishment not normally seen.

Tropical Depression Miding

Tropical depression (JMA)
Temporary cyclone north.svg   CMA TD 26 1970 track.png
DurationAugust 31 – September 2
Peak intensity55 km/h (35 mph) (10-min);
996  hPa  (mbar)

Severe Tropical Storm Fran (Norming)

Severe tropical storm (JMA)
Tropical storm (SSHWS)
Temporary cyclone north.svg   Fran 1970 track.png
DurationSeptember 3 – September 10
Peak intensity100 km/h (65 mph) (1-min);
975  hPa  (mbar)

Tropical Storm Fran formed east of the Philippines on the 3rd, then traveled in a rather unusual fashion, traveling away from the coast before turning back towards it. It passed over the northern part of Taiwan Island on the 6th, before making landfall in China on the 7th. The remnants of Fran lingered over China for some days before it dissipated. [2]

Tropical Storm Ellen (Oyang)

Tropical storm (JMA)
Tropical storm (SSHWS)
Temporary cyclone north.svg   Ellen 1970 track.png
DurationSeptember 3 – September 6
Peak intensity85 km/h (50 mph) (1-min);
985  hPa  (mbar)

Tropical Storm Ellen formed east of the Philippines and traveled northwestwards, becoming a tropical storm well south of Japan. It passed over the southern Ryukyu Islands before dissipating.

Typhoon Georgia (Pitang)

Typhoon (JMA)
Category 5-equivalent super typhoon (SSHWS)
Temporary cyclone north.svg   Georgia 1970 track.png
DurationSeptember 7 – September 16
Peak intensity260 km/h (160 mph) (1-min);
905  hPa  (mbar)

Georgia originated from a tropical wave on September 7, and became tropical storm Georgia on the 8th. Moving over warmer waters, Georgia reached typhoon status late on the 8th and super typhoon status on the 10th, developing a distinct eye. Georgia continued to strengthen further and peaked as a 160 mph category 5 super typhoon, just as the typhoon made landfall at Luzon. Georgia did not drop a lot of rain during its passage through the Philippines, but its strong winds caused 95 casualties (with 80 missing) and damage at $1.4 million (1970 USD). Georgia greatly weakened over the Philippines, and emerged into the South China Sea on the 12th, as a category 1 typhoon. A trough turned Georgia to the north on the 13th, and Georgia made its final landfall in China, degenerating into a remnant low on the 14th, and completely dissipating on the 16th.

Typhoon Hope

Typhoon (JMA)
Category 5-equivalent super typhoon (SSHWS)
Hope Sept 26 1970 0154Z.png   Hope 1970 track.png
DurationSeptember 19 – September 30
Peak intensity280 km/h (175 mph) (1-min);
895  hPa  (mbar)

The strongest storm of the season, Hope was a very strong category 5 super typhoon with pressure reaching 895 mbar. Hope did not affect land and stayed well out to sea. It formed in September 19 and dissipated on September 30.

Tropical Depression Ruping

Tropical depression (JMA)
Temporary cyclone north.svg   Ruping 1970 track.png
DurationSeptember 18 – September 28
Peak intensity55 km/h (35 mph) (10-min);
1000  hPa  (mbar)

Typhoon Iris

Typhoon (JMA)
Category 3-equivalent typhoon (SSHWS)
IrisOctober519700649UTCITOS1.gif   Iris 1970 track.png
DurationOctober 2 – October 8
Peak intensity185 km/h (115 mph) (1-min);
960  hPa  (mbar)

Iris was the first typhoon to develop over the South China Sea in October since 1957. [2] Iris developed on the 2nd due to a shear line. It intensified while slowly traveling northwards, reaching its maximum intensity on the afternoon of the 6th while 140 miles south of Hong Kong. The conditions around the system rapidly became unfavorable after that, and it weakened quickly, finally dissipating on the 9th. [2]

Tropical Depression 20W

Tropical depression (JMA)
Tropical depression (SSHWS)
Temporary cyclone north.svg   20W 1970 track.png
DurationOctober 4 – October 10
Peak intensity55 km/h (35 mph) (10-min);
1004  hPa  (mbar)

Typhoon Joan (Sening)

Typhoon (JMA)
Category 5-equivalent super typhoon (SSHWS)
JoanOctober1319700640UTCITOS1.gif   Joan 1970 track.png
DurationOctober 9 – October 18
Peak intensity280 km/h (175 mph) (1-min);
905  hPa  (mbar)

A tropical disturbance organized into Tropical Storm Joan on October 10, east of the Philippines. Conditions favored strengthening, and Joan reached typhoon status on the 11th. From late on the 11th to early on the 13th, Typhoon Joan rapidly intensified to a 175 mph Super Typhoon. It struck the southeastern Luzon at that intensity on the 13th, and crossed the archipelago. After weakening to a minimal typhoon, Joan turned to the northwest, where it reintensified to a 115 mph typhoon. It made landfall on eastern Hainan Island on the 16th, and dissipated on the 18th over China. Joan left 768 people dead (with 193 missing), and caused $74 million in damage (1970 USD), mostly from agricultural losses.

Typhoon Kate (Titang)

Typhoon (JMA)
Category 4-equivalent typhoon (SSHWS)
Kateoct2219700727UTCITOS1.gif   Kate 1970 track.png
DurationOctober 14 – October 26
Peak intensity240 km/h (150 mph) (1-min);
940  hPa  (mbar)

Tropical Storm Kate developed just behind Typhoon Joan, east of the southern Philippines on October 14. It tracked westward as a small cyclone, and strengthened into a typhoon on the 15th. It made landfall twice, once in the Philippines and once in Vietnam, resulting in at least 631 fatalities (with 284 missing) and $50 million in damage.

Typhoon Louise (Uding)

Typhoon (JMA)
Tropical storm (SSHWS)
LouiseOct2819700720UTCITOS1.gif   Louise 1970 track.png
DurationOctober 23 – October 29
Peak intensity110 km/h (70 mph) (1-min);
990  hPa  (mbar)

Typhoon Louise (classified as a tropical storm by the JTWC) formed as a disturbance east of the Philippines. The disturbance traveled across them before it became a tropical storm over the South China Sea. It made landfall in South Vietnam and dissipated over the Gulf of Thailand. [2]

Severe Tropical Storm Marge (Wening)

Severe tropical storm (JMA)
Tropical storm (SSHWS)
MargeNov319700710UTCITOS1.gif   Marge 1970 track.png
DurationOctober 27 – November 8
Peak intensity100 km/h (65 mph) (1-min);
990  hPa  (mbar)

Tropical Storm Marge followed a similar path to Louise. It formed over the Pacific, becoming a tropical depression south of Guam. It became a tropical storm 3 days later, then crossed southern Luzon before dissipating over the South China Sea off the Vietnamese coast.

Tropical Storm Nora

Tropical storm (JMA)
Tropical storm (SSHWS)
NoraNov219700810UTCITOS1.gif   Nora 1970 track.png
DurationNovember 1 – November 4
Peak intensity95 km/h (60 mph) (1-min);
1000  hPa  (mbar)

Tropical Storm Nora formed south of Vietnam and began to strengthen, becoming a tropical storm the next day. The system passed south of Cape Cà Mau as a tropical storm before weakening and dissipating over the Gulf of Thailand. [2] The remnants of Nora then crossed the Malay Peninsula on the 5th, and contributed to the formation of the 1970 Bhola cyclone on the 8th, which devastated East Pakistan (Modern day Bangladesh).

Severe Tropical Storm Opal

Severe tropical storm (JMA)
Tropical storm (SSHWS)
OpalNov1519700659UTCITOS1.gif   Opal 1970 track.png
DurationNovember 11 – November 17
Peak intensity95 km/h (60 mph) (1-min);
990  hPa  (mbar)

Tropical Storm Opal formed as a disturbance over the sea east of Mindanao, then crossed the Philippines before becoming a depression over the South China Sea. It intensified into a tropical storm as it turned southwestward over the South China Sea, passing close to Vietnam, but it dissipated southeast of the Mekong Delta.

Typhoon Patsy (Yoling)

Typhoon (JMA)
Category 4-equivalent typhoon (SSHWS)
Patsynov1719700657UTCITOS1.gif   Patsy 1970 track.png
DurationNovember 14 – November 22
Peak intensity250 km/h (155 mph) (1-min);
910  hPa  (mbar)

A tropical disturbance organized into Tropical Depression 27W on November 14 near the Marianas Islands. A strong ridge to its north forced it westward, where it strengthened to tropical storm status later on the 14th. Patsy steadily intensified, reaching typhoon strength on the 16th and peaking at 155 mph on the 18th. Its inflow became disrupted by the Philippines to its west, and Patsy hit Luzon on the 19th with winds of 130 mph, making it the 3rd strong typhoon since September to strike the island. After crossing the island, Patsy traversed the South China Sea, where cooler waters kept the system a tropical storm. On November 22, Patsy struck Vietnam, and dissipated soon after. Typhoon Patsy was one of the deadliest typhoons to strike the Philippines in its history. 611 people were killed (with 351 missing) on the island, and 135 people were killed at sea due to shipping failures. Because the Vietnam War was raging at that time, it is difficult to say about the damage or death toll, but estimates say that 30 people died in Vietnam.

Tropical Storm Ruth (Aning)

Tropical storm (JMA)
Tropical storm (SSHWS)
Temporary cyclone north.svg   Ruth 1970 track.png
DurationNovember 24 – November 29
Peak intensity75 km/h (45 mph) (1-min);
996  hPa  (mbar)

Tropical Storm Ruth formed as a disturbance far at sea, then slowly travelled westward, but it did not intensify into a tropical depression until it was in the South China Sea. It briefly became a tropical storm south of the Mekong Delta, but it weakened into a tropical depression before it crossed just south of Cape Cà Mau. The remnants of Ruth dissipated just off the coast of Thailand.

Tropical Depression Bidang

Tropical depression (JMA)
Temporary cyclone north.svg   Bidang 1970 track.png
DurationDecember 15 – December 19
Peak intensity55 km/h (35 mph) (10-min);
1002  hPa  (mbar)

Other systems

According to the Japan Meteorological Agency, on September 2 Tropical Cyclone Dot briefly crossed the International Date Line from the Central Pacific into its area of responsibility, crossing back later that day. [4]

Storm names

Western North Pacific tropical cyclones were named by the Joint Typhoon Warning Center. The first storm of 1970 was named Nancy and the final one was named Ruth.

  • Agnes
  • Bonnie
  • Carmen
  • Della
  • Elaine
  • Faye
  • Gloria
  • Hester
  • Irma
  • Judy
  • Kit
  • Lola
  • Mamie
  • Nina
  • Ora
  • Phyllis
  • Rita
  • Susan
  • Tess
  • Viola
  • Winnie
  • Alice
  • Betty
  • Cora
  • Doris
  • Elsie
  • Flossie
  • Grace
  • Helen
  • Ida
  • June
  • Kathy
  • Lorna
  • Marie
  • Nancy 1W
  • Olga 2W
  • Pamela 3W
  • Ruby 4W
  • Sally 5W
  • Therese 8W
  • Violet 9W
  • Wilda 10W
  • Anita 11W
  • Billie 12W
  • Clara 13W
  • Dot 14C
  • Ellen 15W
  • Fran 16W
  • Georgia 17W
  • Hope 18W
  • Iris 19W
  • Joan 21W
  • Kate 22W
  • Louise 23W
  • Marge 24W
  • Nora 25W
  • Opal 26W
  • Patsy 27W
  • Ruth 28W
  • Sarah
  • Thelma
  • Vera
  • Wanda
  • Amy
  • Babe
  • Carla
  • Dinah
  • Emma
  • Freda
  • Gilda
  • Harriet
  • Ivy
  • Jean
  • Kim
  • Lucy
  • Mary
  • Nadine
  • Olive
  • Polly
  • Rose
  • Shirley
  • Trix
  • Virginia
  • Wendy

One Central Pacific System developed, Hurricane Dot. The policy at that time was to use Western Pacific Names for the Central Pacific.

Philippines

AtangBisingKlaringDelingEmang
GadingHelingIliangLolengMiding
NormingOyangPitangRupingSening
TitangUdingWeningYoling
Auxiliary list
Aning
BidangKading (unused)Delang (unused)Esang (unused)Garding (unused)

The Philippine Atmospheric, Geophysical and Astronomical Services Administration uses its own naming scheme for tropical cyclones in their area of responsibility. PAGASA assigns names to tropical depressions that form within their area of responsibility and any tropical cyclone that might move into their area of responsibility. Should the list of names for a given year prove to be insufficient, names are taken from an auxiliary list, the first 6 of which are published each year before the season starts. Names not retired from this list will be used again in the 1974 season. This is the same list used for the 1966 season. PAGASA uses its own naming scheme that starts in the Filipino alphabet, with names of Filipino female names ending with "ng" (A, B, K, D, etc.). Names that were not assigned/going to use are marked in gray.

Retirement

Due to the severe damage in the Philippines, PAGASA later retired the names Pitang, Sening, Titang, and Yoling. Those were replaced by Pasing, Susang, Tering, and Yaning for the 1974 season. This season had the most retired names by PAGASA at that time.

Season effects

This table will list all the storms that developed in the northwestern Pacific Ocean west of the International Date Line and north of the equator during 1970. It will include their intensity, duration, name, areas affected, deaths, missing persons (in parentheses), and damage totals. Classification and intensity values will be based on estimations conducted by the JMA, however due to lack of information around this time sustained winds were recorded by the JTWC. All damage figures will be in 1970 USD. Damages and deaths from a storm will include when the storm was a precursor wave or an extratropical low.

NameDatesPeak intensityAreas affectedDamage
(USD)
DeathsRefs
Category Wind speedPressure
TDJanuary 1 – 2Tropical depressionNot specified1008 hPa (29.77 inHg)None NoneNone
TDJanuary 9Tropical depressionNot specified1010 hPa (29.83 inHg)None NoneNone
NancyFebruary 19 – 28Typhoon220 km/h (140 mph)950 hPa (28.05 inHg) Caroline Islands, Philippines $160,000None
TDMarch 14 – 17Tropical depressionNot specified1004 hPa (29.65 inHg) Palau, Philippines NoneNone
BisingJune 11 – 13Tropical depression55 km/h (35 mph)997 hPa (29.44 inHg) Taiwan NoneNone
TDJune 23 – 24Tropical depressionNot specified1008 hPa (29.77 inHg) Philippines NoneNone
Olga (Deling)June 27 – July 5Typhoon260 km/h (160 mph)905 hPa (26.72 inHg) Caroline Islands, Ryukyu Islands, Japan, South Korea $10 million49
Pamela (Klaring)June 28 – July 1Severe tropical storm95 km/h (60 mph)980 hPa (28.94 inHg) Philippines UnknownUnknown
TDJuly 9Tropical depressionNot specified1008 hPa (29.77 inHg)None NoneNone
TDJuly 10 – 11Tropical depressionNot specified1008 hPa (29.77 inHg)None NoneNone
Ruby (Emang)July 11 – 17Severe tropical storm100 km/h (65 mph)985 hPa (29.09 inHg) Philippines, South China NoneNone
TDJuly 10 – 12Tropical depressionNot specified1008 hPa (29.77 inHg)None NoneNone
TDJuly 15 – 30Tropical depressionNot specified1004 hPa (29.65 inHg)None NoneNone
SallyJuly 19 – 23Tropical storm75 km/h (45 mph)992 hPa (29.29 inHg)None NoneNone
TDJuly 19 – August 2Tropical depressionNot specified996 hPa (29.65 inHg)None NoneNone
07W (Gading)July 25 – August 2Tropical depression85 km/h (50 mph)996 hPa (29.41 inHg) Taiwan, East China NoneNone
06WJuly 28 – August 1Tropical storm75 km/h (45 mph)994 hPa (29.35 inHg) Ryukyu Islands NoneNone
TDJuly 29Tropical depressionNot specified1006 hPa (29.71 inHg) Ryukyu Islands NoneNone
ThereseAugust 1 – 4Tropical storm75 km/h (45 mph)990 hPa (29.23 inHg)None NoneNone
TDAugust 1Tropical depressionNot specified1000 hPa (29.71 inHg)None NoneNone
TDAugust 3Tropical depressionNot specified1008 hPa (29.77 inHg)None NoneNone
Violet (Heling)August 3 – 9Tropical storm75 km/h (45 mph)992 hPa (29.29 inHg) Philippines, South China NoneNone
TDAugust 6 – 9Tropical depressionNot specified1004 hPa (29.65 inHg)None NoneNone
Wilda (Iliang)August 9 – 15Typhoon195 km/h (120 mph)940 hPa (27.76 inHg) Ryukyu Islands, Japan Unknown11
TDAugust 11 – 16Tropical depressionNot specified1004 hPa (29.65 inHg) Philippines NoneNone
TDAugust 12 – 16Tropical depressionNot specified1004 hPa (29.65 inHg) Vietnam NoneNone
TDAugust 12 – 15Tropical depressionNot specified1006 hPa (29.71 inHg) Mariana Islands NoneNone
TDAugust 14 – 19Tropical depressionNot specified997 hPa (29.44 inHg) Vietnam NoneNone
TDAugust 14 – 16Tropical depressionNot specified1004 hPa (29.65 inHg) Ryukyu Islands NoneNone
AnitaAugust 15 – 22Typhoon250 km/h (155 mph)910 hPa (26.87 inHg) Japan None31
TDAugust 15 – 20Tropical depressionNot specified1006 hPa (29.71 inHg) Japan NoneNone
TDAugust 18Tropical depressionNot specified1004 hPa (29.65 inHg)None NoneNone
Billie (Loleng)August 21 – 31Typhoon205 km/h (125 mph)945 hPa (27.91 inHg) Ryukyu Islands, Korean Peninsula UnknownUnknown
TDAugust 21Tropical depressionNot specified1008 hPa (29.77 inHg)None NoneNone
ClaraAugust 25 – September 4Typhoon155 km/h (100 mph)960 hPa (28.35 inHg)None NoneNone
TDAugust 25 – 31Tropical depressionNot specified1004 hPa (29.65 inHg)None NoneNone
TDAugust 25 – 26Tropical depressionNot specified1004 hPa (29.65 inHg)None NoneNone
MidingAugust 31 – September 2Tropical depression55 km/h (35 mph)996 hPa (29.41 inHg) Taiwan NoneNone
DotSeptember 2Severe ropical storm75 km/h (45 mph)1004 hPa (29.65 inHg)None NoneNone
Fran (Norming)September 3 – 10Severe tropical storm100 km/h (65 mph)975 hPa (28.79 inHg) Ryukyu Islands, Taiwan, East China NoneNone
TDSeptember 3Tropical depressionNot specified1000 hPa (29.53 inHg) Laos NoneNone
Ellen (Oyang)September 3 – 6Tropical storm85 km/h (50 mph)985 hPa (29.09 inHg) Ryukyu Islands NoneNone
TDSeptember 4Tropical depressionNot specified1006 hPa (29.71 inHg)None NoneNone
Georgia (Pitang)September 7 – 16Typhoon260 km/h (160 mph)905 hPa (26.72 inHg) Philippines, China $1.4 million95
TDSeptember 11 – 13Tropical depressionNot specified1008 hPa (29.77 inHg)None NoneNone
TDSeptember 13Tropical depressionNot specified1008 hPa (29.77 inHg)None NoneNone
TDSeptember 16 – 24Tropical depressionNot specified1006 hPa (29.71 inHg)None NoneNone
RupingSeptember 18 – 28Tropical depression45 km/h (30 mph)1000 hPa (29.53 inHg) Philippines NoneNone
HopeSeptember 19 – 30Typhoon280 km/h (175 mph)895 hPa (26.43 inHg)None NoneNone
TDSeptember 27 – October 4Tropical depressionNot specified1004 hPa (29.65 inHg)None NoneNone
TDOctober 1 – 4Tropical depressionNot specified1002 hPa (29.59 inHg)None NoneNone
IrisOctober 2 – 8Typhoon185 km/h (115 mph)960 hPa (28.35 inHg) South China NoneNone
TDOctober 4Tropical depressionNot specified1006 hPa (29.71 inHg)None NoneNone
20WOctober 4 – 10Tropical depression45 km/h (35 mph)1004 hPa (29.65 inHg)None NoneNone
TDOctober 7Tropical depressionNot specified1004 hPa (29.65 inHg)None NoneNone
Joan (Sening) October 9 – 18Typhoon280 km/h (175 mph)905 hPa (26.72 inHg) Caroline Islands, Philippines, South China $74 million768
TDOctober 12Tropical depressionNot specified1006 hPa (29.71 inHg) Vietnam NoneNone
TDOctober 14 – 19Tropical depressionNot specified1002 hPa (29.59 inHg)None NoneNone
Kate (Titang) October 14 – 26Typhoon240 km/h (150 mph)940 hPa (27.76 inHg) Philippines $50 million631
TDOctober 18 – 19Tropical depressionNot specified1008 hPa (29.77 inHg)None NoneNone
TDOctober 18 – 19Tropical depressionNot specified1006 hPa (29.71 inHg)None NoneNone
TDOctober 23 – 24Tropical depressionNot specified1010 hPa (29.83 inHg)None NoneNone
Louise (Uding)October 23 – 29Typhoon110 km/h (70 mph)990 hPa (29.23 inHg) Philippines, Vietnam, Laos NoneNone
Marge (Wening)October 27 – November 8Severe tropical storm100 km/h (65 mph)990 hPa (29.23 inHg) Philippines, Vietnam NoneNone
TDOctober 27 – 29Tropical depressionNot specified1012 hPa (29.88 inHg)None NoneNone
TDOctober 29 – 30Tropical depressionNot specified1012 hPa (29.88 inHg)None NoneNone
NoraNovember 1 – 4Tropical storm95 km/h (60 mph)1000 hPa (29.53 inHg) Vietnam, Thailand NoneNone
TDNovember 3 – 5Tropical depressionNot specified1006 hPa (29.71 inHg)None NoneNone
OpalNovember 11 – 17Severe tropical storm95 km/h (60 mph)990 hPa (29.23 inHg) Vietnam NoneNone
TDNovember 11 – 12Tropical depressionNot specified1012 hPa (29.88 inHg)None NoneNone
TDNovember 14Tropical depressionNot specified1008 hPa (29.77 inHg)None NoneNone
Patsy (Yoling) November 14 – 22Typhoon250 km/h (155 mph)910 hPa (26.87 inHg) Mariana Islands, Philippines, Vietnam $80 million262
Ruth (Aning)November 24 – 29Tropical storm75 km/h (45 mph)996 hPa (29.41 inHg)None NoneNone
TDDecember 2 – 3Tropical depressionNot specified1008 hPa (29.77 inHg)None NoneNone
TDDecember 2 – 3Tropical depressionNot specified1004 hPa (29.65 inHg)None NoneNone
BidangDecember 15 – 19Tropical depression55 km/h (35 mph)1002 hPa (29.59 inHg)None NoneNone
Season aggregates
76 systemsJanuary 1 – December 19, 1970280 km/h (175 mph)895 hPa (26.43 inHg)>$216 million>1,847

See also

Related Research Articles

<span class="mw-page-title-main">2005 Pacific typhoon season</span> Typhoon season in the Western Pacific Ocean

The 2005 Pacific typhoon season was the least active typhoon season since 2000, producing 23 named storms, of which 13 became typhoons. It was an event in the annual cycle of tropical cyclone formation, in which tropical cyclones form in the western Pacific Ocean. The season ran throughout 2005, though most tropical cyclones typically develop between May and October. The season's first named storm, Kulap, developed on January 13, while the season's last named storm, Bolaven, dissipated on November 20. The season's first typhoon, Haitang, reached typhoon status on July 13, and became the first super typhoon of the year three days later.

<span class="mw-page-title-main">2000 Pacific typhoon season</span> Typhoon season in the Western Pacific Ocean

The 2000 Pacific typhoon season marked the first year using names contributed by the World Meteorological Organization. It was a rather below-average season, producing a total of 23 tropical storms, 13 typhoons and 4 intense typhoons. The season ran throughout 2000, though typically most tropical cyclones develop between May and October. The season's first named storm, Damrey, developed on May 7, while the season's last named storm, Soulik, dissipated on January 4 of the next year.

<span class="mw-page-title-main">1999 Pacific typhoon season</span> Typhoon season in the Western Pacific Ocean

The 1999 Pacific typhoon season was the last Pacific typhoon season to use English names as storm names. It also featured the lowest number of typhoons on record, with only five reaching this intensity. This was mainly due to a strong La Niña which persisted from last year. The season was also below-average in named storms, with only 20 of such spawning. It had no official bounds; it ran year-round in 1999, but most tropical cyclones tend to form in the northwestern Pacific Ocean between May and November. These dates conventionally delimit the period of each year when most tropical cyclones form in the northwestern Pacific Ocean. The first named storm, Hilda, developed on January 6, while the last named storm, Gloria, dissipated on November 16.

<span class="mw-page-title-main">1998 Pacific typhoon season</span> Typhoon season in the Western Pacific Ocean

The 1998 Pacific typhoon season was the least active Pacific typhoon season on record, until it was surpassed 12 years later. It would produce 16 tropical storms, 8 strengthening into typhoons. The scope of this article is limited to the Pacific Ocean, north of the equator and west of the international date line. Storms that form east of the date line and north of the equator are called hurricanes; see 1998 Pacific hurricane season. Tropical Storms formed in the entire west Pacific basin were assigned a name by the Joint Typhoon Warning Center. Tropical depressions in this basin have the "W" suffix added to their number. Tropical depressions that enter or form in the Philippine area of responsibility are assigned a name by the Philippine Atmospheric, Geophysical and Astronomical Services Administration or PAGASA. This can often result in the same storm having two names.

<span class="mw-page-title-main">1997 Pacific typhoon season</span> Typhoon season in the Western Pacific Ocean

The 1997 Pacific typhoon season was a record-breaking season featuring 11 tropical cyclones reaching super typhoon intensity, tying the record with 1965 with the most violent tropical cyclones globally, and was the ninth and last consecutive year of above-average tropical cyclone activity that started in 1989. Its extremely high activity produced a total of 570 ACE index, which is the highest ever index recorded in a single tropical cyclone season. In addition, this season had 10 Saffir-Simpson Category 5-equivalent tropical cyclones, the most ever recorded, even greater than the 2005 Atlantic hurricane season, which had nearly half of the amount. The 1997–98 El Niño event was a contributing factor to this unusually high activity. Despite this, the season produced an average number of tropical storms, spawning 29 tropical storms.

<span class="mw-page-title-main">1992 Pacific typhoon season</span> Typhoon season in the Western Pacific Ocean

The 1992 Pacific typhoon season is the fourth consecutive above-average season, producing 31 tropical storms, 16 typhoons and five super typhoons. It had no official bounds; it ran year-round in 1992. Despite this, most tropical cyclones tend to form in the northwestern Pacific Ocean between May and November. These dates conventionally delimit the period of each year when most tropical cyclones form in the northwestern Pacific Ocean.

<span class="mw-page-title-main">1991 Pacific typhoon season</span> Typhoon season in the Pacific Ocean

The 1991 Pacific typhoon season was a slightly above-average season with 29 tropical storms, 17 typhoons and five super typhoons forming. It was quite a catastrophic season – Typhoon Yunya impacted the Philippines in mid June while in the same time experiencing a volcanic eruption, Typhoon Mireille severely impacting Japan, which became known for being the costliest typhoon on record with US$10 billion worths of damages, and Tropical Storm Thelma on November which became one of the deadliest storms to strike the Philippines, killing at least over 5,000 people.

<span class="mw-page-title-main">1986 Pacific typhoon season</span> Typhoon season in the Pacific Ocean

The 1986 Pacific typhoon season was an above average season, featuring 29 named storms, 19 typhoons, and 3 super typhoons. It has no official bounds; it ran year-round in 1986, but most tropical cyclones tend to form in the northwestern Pacific Ocean between May and December. These dates conventionally delimit the period of each year when most tropical cyclones form in the northwestern Pacific Ocean. Tropical Storms formed in the entire west pacific basin were assigned a name by the Joint Typhoon Warning Center. Tropical depressions that enter or form in the Philippine area of responsibility are assigned a name by the Philippine Atmospheric, Geophysical and Astronomical Services Administration or PAGASA. This can often result in the same storm having two names.

<span class="mw-page-title-main">1985 Pacific typhoon season</span> Typhoon season in the Pacific Ocean

The 1985 Pacific typhoon season was a slightly above average season in terms of named storms, though most storms were weak and short-lived. The season had 28 named storms, 15 typhoons and 1 super typhoon. It ran year-round, thus ending the two-season run which began in 1983 that only had tropical cyclones forming between June and December. These dates conventionally delimit the period of each year when most tropical cyclones form in the northwestern Pacific Ocean. A total of 57 tropical depressions formed this year, of which only 28 became tropical storms and were assigned a name by the Joint Typhoon Warning Center. This made the season well above average. Additionally, tropical depressions that enter or form in the Philippine area of responsibility were assigned a name by the Philippine Atmospheric, Geophysical and Astronomical Services Administration or PAGASA. This can often result in the same storm having two names. This year, a total of 17 storms were named this way.

<span class="mw-page-title-main">1981 Pacific typhoon season</span> Period of formation of tropical cyclones in the Western Pacific Ocean in 1981

The 1981 Pacific typhoon season was a slightly above average season that produced 29 tropical storms, 13 typhoons and two intense typhoons. The season ran throughout 1981, though most tropical cyclones typically develop between May and October. The season's first named storm, Freda, developed on March 12 while the final storm, Lee, dissipated on December 29. Tropical cyclones only accounted for 12 percent of the rainfall in Hong Kong this season, the lowest percentage for the protectorate since 1972.

<span class="mw-page-title-main">1980 Pacific typhoon season</span> Period of formation of tropical cyclones in the Western Pacific Ocean in 1980

The 1980 Pacific typhoon season was a slightly-below average season when compared to the long-term average, though it featured several intense storms. It ran year-round in 1980, but most tropical cyclones formed between June and December. These dates conventionally delimit the period of each year when most tropical cyclones form in the northwestern Pacific Ocean. A total of 28 tropical depressions formed this year in the Western Pacific, of which 24 became tropical storms and were assigned a name by the Joint Typhoon Warning Center. Beginning in March, tropical cyclones formed in each subsequent month through December. Of the 24 named storms, 15 storms reached typhoon intensity, of which 2 reached super typhoon strength.

<span class="mw-page-title-main">1979 Pacific typhoon season</span> Period of formation of tropical cyclones in the Western Pacific Ocean in 1979

The 1979 Pacific typhoon season featured the largest and most intense tropical cyclone recorded globally, Typhoon Tip. The season also experienced slightly below-average tropical cyclone activity. The season had no official bounds; it ran year-round in 1979, but most tropical cyclones tend to form in the northwestern Pacific Ocean between June and December. These dates conventionally delimit the period of each year when most tropical cyclones form in the northwestern Pacific Ocean.

<span class="mw-page-title-main">1959 Pacific typhoon season</span> Typhoon season in the Pacific Ocean

The 1959 Pacific typhoon season was regarded as one of the most devastating years for Pacific typhoons on record, with China, Japan and South Korea sustaining catastrophic losses. It was an event in the annual cycle of tropical cyclone formation. The season had no official bounds, but tropical cyclones in the Western Pacific Ocean normally develop between May and October.

<span class="mw-page-title-main">1975 Pacific typhoon season</span>

The 1975 Pacific typhoon season was one of the deadliest tropical cyclone seasons on record, with nearly 229,000 fatalities occurring during the season. It had no official bounds; it ran year-round in 1975, but most tropical cyclones tend to form in the northwestern Pacific Ocean between June and December. These dates conventionally delimit the period of each year when most tropical cyclones form in the northwestern Pacific Ocean.

<span class="mw-page-title-main">1974 Pacific typhoon season</span> Typhoon season in the Pacific Ocean

The 1974 Pacific typhoon season was the first season on record to not feature a Category 5 equivalent super typhoon; a feat later repeated by the 1977 and 2017 seasons. Even so, the season was overly active, with 32 tropical storms and 16 typhoons being developed this year. It has no official bounds; it ran year-round in 1974, but most tropical cyclones tend to form in the northwestern Pacific Ocean between June and December. These dates conventionally delimit the period of each year when most tropical cyclones form in the northwestern Pacific Ocean.

<span class="mw-page-title-main">1972 Pacific typhoon season</span>

The 1972 Pacific typhoon season was an above average season, producing 31 tropical storms, 24 typhoons and 2 intense typhoons. It has no official bounds; it ran year-round in 1972, but most tropical cyclones tend to form in the northwestern Pacific Ocean between June and December. These dates conventionally delimit the period of each year when most tropical cyclones form in the northwestern Pacific Ocean.

<span class="mw-page-title-main">1962 Pacific typhoon season</span> Typhoon season in the Pacific Ocean

The 1962 Pacific typhoon season had no official bounds; there was activity in every month but January, March, and June, but most tropical cyclones form in the northwestern Pacific Ocean between May and November and this conventionally delimits the season.

<span class="mw-page-title-main">1958 Pacific typhoon season</span>

The 1958 Pacific typhoon season was an event in the annual cycle of tropical cyclone formation. The season had no official bounds, but tropical cyclones in the Western Pacific Ocean normally develop between May and October. The season was below average in storms, with only twenty-three forming. However, all but two of those storms developed into typhoons, resulting in a well above-average number of typhoons, and a very high ACE figure of 445.8 units. In addition, there were also nine tropical storms tracked only by the JMA. The season began very early, with a very rare super typhoon in January, Typhoon Ophelia, and ended in early December with Typhoon Olga. It also featured Typhoon Ida, the strongest storm ever recorded at that time.

<span class="mw-page-title-main">1957 Pacific typhoon season</span>

The 1957 Pacific typhoon season has no official bounds; it ran year-round in 1957, but most tropical cyclones tend to form in the northwestern Pacific Ocean between June and December. These dates conventionally delimit the period of each year when most tropical cyclones form in the northwestern Pacific Ocean.

The 1939 Pacific typhoon season has no official bounds; it ran year-round in 1939, but most tropical cyclones tend to form in the northwestern Pacific Ocean between May and November. These dates conventionally delimit the period of each year when most tropical cyclones form in the northwestern Pacific Ocean.

References

  1. National Climatic Data Center (2013). "Nancy IBTrACS File". National Oceanic and Atmospheric Administration. Retrieved 23 June 2013.
  2. 1 2 3 4 5 6 7 8 9 10 11 12 Joint Typhoon Warning Center (1971). "Annual Typhoon Report 1970" (PDF). United States Navy. Retrieved 2020-10-29.
  3. National Climatic Data Center (2013). "Olga IBTrACS File". National Oceanic and Atmospheric Administration. Retrieved 11 July 2013.
  4. JMA Best Track Data (Text)