Category4, the second-highest classification on the Saffir–Simpson scale,[nb 1] is used for tropical cyclones that have winds of 130–156mph (209–251km/h; 113–136kn). The division of the eastern and central Pacific basins occurs at 140°W; the eastern Pacific covers area east of 140°W, while the central Pacific extends between 140°W to 180°W. Both basins' division points are at 66°N as a northern point and the equator as the southern point. As of 2024[update], 143hurricanes have attained Category 4 status in the northeastern Pacific basins. This list does not include storms that also attained Category5 status on the scale.
Numerous climatological factors influence the formation of hurricanes in the Pacific basins. The North Pacific High and Aleutian Low, usually present between January and April, cause strong wind shear and unfavorable conditions for the development of hurricanes. During its presence, El Niño results in increased numbers of powerful hurricanes through weaker wind shear, while La Niña reduces the number of such hurricanes through the opposite. Global warming may also influence the formation of tropical cyclones in the Pacific basin. During a thirty-year period with two sub-periods, the first between 1975 and 1989 and the second between 1990 and 2004, an increase of thirteenCategory4 or 5 storms was observed from the first sub-period.
Statistics and background
Tracks of all known Category4 Pacific hurricanes from 1949 to 2011 in the central and eastern Pacific basins
On the Saffir–Simpson Hurricane Scale, "Category4" is the second-most powerful classification, with winds ranging between 130 and 156mph (209 and 251km/h; 113 and 136kn). When these hurricanes make landfall, impacts are usually severe but are not as destructive as Category5 hurricanes that come ashore.[1] The term "maximum sustained wind" refers to the average wind speed measured during the period of one minute at the height of 10 feet (3.0m) above the ground. The windspeed is measured at that height to prevent disruption from obstructions. Wind gusts in tropical cyclones are usually approximately 30% stronger than the one-minute maximum sustained winds.[2]
The northeastern Pacific hurricane basins are divided into two parts– eastern and central. The eastern Pacific basin extends from all areas of the Pacific north of the equator east of 140°W, while the central Pacific basin includes areas north of the equator between 140°W and 180°W.[3] Both basins extend to the Arctic Circle at 66°N.[4]
When tropical cyclones cross from the Atlantic into the Pacific, the name of the previous storm is retained if the system continues to exhibit tropical characteristics; however, when hurricanes degenerate into a remnant low-pressure area, the system is designated with the next name on the rotating eastern Pacific hurricane naming list.[5]
Since 1900, 143Category4 hurricanes have been recorded in the eastern and central Pacific basins. Of these, fourteen have attained Category4 status on more than one occasion, by weakening to a status on the Saffir–Simpson Hurricane Scale lower than Category4 and later restrengthening into a Category4. Such storms are demarcated by the dates they first attained and the final time they lost the intensity. Only four storms, Hurricane Fico in 1978, Hurricane Norbert in 1984, Hurricane Hector in 2018, and Hurricane Dora in 2023, reached Category4 status three times or more.[6]
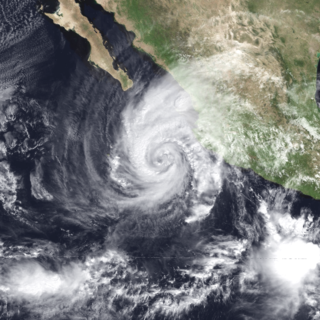
The track of Hurricane Sandra in 2015, which is the latest-forming Category4 hurricane on record in the northeastern Pacific basin.
A total of 143Category4 hurricanes have been recorded in the eastern and central Pacific basins since 1900. Only two Category4 hurricanes have been recorded in May, in addition to 14in June, 25in July, 31in August, 32in September, 20in October, and two in November.[6] No Category4 storms have developed during the off-season.[6] It is theorized that global warming was responsible for an increase of 13Category4 and 5 storms that developed in the eastern Pacific, from 36in the period of 1975–1989 to 49in the period of 1990–2004. It was estimated that if sea-surface temperatures ascended by 2 to 2.5degrees, the intensity of tropical cyclones would increase by 6–10% internationally. During years with the existence of an El Niño, sea-surface temperatures increase in the eastern Pacific, resulting in an increase in activity as vertical wind shear decreases in the Pacific; the opposite happens in the Atlantic basin during El Niño, when wind shear increases creating an unfavourable environment for tropical cyclone formation in the Atlantic.[8] Contrary to El Niño, La Niña increases wind shear over the eastern Pacific and reduces it over the Atlantic.[9]
The presence of a semi-permanent high-pressure area known as the North Pacific High in the eastern Pacific is a dominant factor against formation of tropical cyclones in the winter, as the Pacific High results in wind shear that causes environmental conditions for tropical cyclone formation to be unconducive. Its effects in the central Pacific basin are usually related to keeping cyclones away from the Hawaiian Islands. Due to westward trade winds, hurricanes in the Pacific nearly never head eastward, although several storms have defied the odds and headed eastward. A second factor preventing tropical cyclones from forming during the winter is the occupation of a semi-permanent low-pressure area designated the Aleutian Low between January and April. Its presence over western Canada and the northwestern United States contributes to the area's occurrences of precipitation in that duration. In addition, its effects in the central Pacific near 160°W causes tropical waves that form in the area to drift northward into the Gulf of Alaska and dissipate. Its retreat in late-April allows the warmth of the Pacific High to meander in, bringing its powerful clockwise wind circulation with it. The Intertropical Convergence Zone departs southward in mid-May permitting the formation of the earliest tropical waves,[4] coinciding with the start of the eastern Pacific hurricane season on May15.[10]
Cooler waters near the Baja California peninsula are thought to prevent storms in the easternPacific from transitioning into an extratropical cyclone; as of 2009, only three storms listed in the database are known to have successfully completed an extratropical transition.[7]
Category4 Pacific hurricanes
1950s
During the 1950s, there were three Category4 hurricanes in the Pacific Ocean. A dagger (†) denotes that the storm temporarily weakened below Category4 intensity during the specified period of time.
† The storm noted formed or attained Category4 status in the central Pacific basin but may have formed in the eastern Pacific basin
‡ The storm noted attained Category4 status more than once
* The storm noted was both a Category4 in the eastern and central Pacific basins
** The storm noted originated in the Atlantic basin, but later intensified into a Category4 hurricane in the eastern Pacific basin
# Storms that attained Category4 status at one point but intensified into Category5 at a later time are not included.
As the Pacific hurricane database only goes back to 1949, the 1943 Mazatlán hurricane is not included, although it attained Category4-equivalent winds at 136mph (219km/h). It is unknown if the winds observed were sustained.[6][13]
Storms that formed in the eastern or central Pacific but strengthened to reach Category4 status in the western Pacific basin (west of 180°W) are not included.[14][15]
1970s
During the 1970s, there were 18 Category4 hurricanes in the Pacific Ocean. A dagger (†) denotes that the storm temporarily weakened below Category4 intensity during the specified period of time.
† The storm noted formed or attained Category4 status in the central Pacific basin but may have formed in the eastern Pacific basin
‡ The storm noted attained Category4 status more than once
* The storm noted was both a Category4 in the eastern and central Pacific basins
** The storm noted originated in the Atlantic basin, but later intensified into a Category4 hurricane in the eastern Pacific basin
# Storms that attained Category4 status at one point but intensified into Category5 at a later time are not included.
1980s
During the 1980s, there were 23 Category4 hurricanes in the Pacific Ocean. A dagger (†) denotes that the storm temporarily weakened below Category4 intensity during the specified period of time.
† The storm noted formed or attained Category4 status in the central Pacific basin but may have formed in the eastern Pacific basin
‡ The storm noted attained Category4 status more than once
* The storm noted was both a Category4 in the eastern and central Pacific basins
** The storm noted originated in the Atlantic basin, but later intensified into a Category4 hurricane in the eastern Pacific basin
# Storms that attained Category4 status at one point but intensified into Category5 at a later time are not included.
1990s
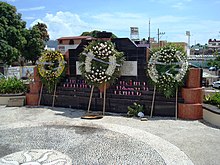
Hurricane Olivia, the most intense hurricane of the decade in terms of barometric pressureHurricane Pauline was one of the deadliest Pacific hurricanes to make landfall in Mexico.Memorial in Acapulco to honor the victims from Pauline
During the 1990s, there were 34 Category4 hurricanes in the Pacific Ocean. A dagger (†) denotes that the storm temporarily weakened below Category4 intensity during the specified period of time. The most intense storms of the decade in terms of sustained winds were 1990's Hernan and Trudy with 155mph (250km/h). While the strongest hurricane in terms of barometric pressure was 1990's Trudy with 924hPa (27.29inHg).
† The storm noted formed or attained Category4 status in the central Pacific basin but may have formed in the eastern Pacific basin
‡ The storm noted attained Category4 status more than once
* The storm noted was both a Category4 in the eastern and central Pacific basins
** The storm noted originated in the Atlantic basin, but later intensified into a Category4 hurricane in the eastern Pacific basin
# Storms that attained Category4 status at one point but intensified into Category5 at a later time are not included.
2000s
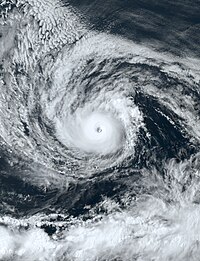
Hurricane Juliette, the most intense Category4 hurricane of the decade in terms of barometric pressure
During the 2000s, there were 14 Category4 hurricanes in the Pacific Ocean. A dagger (†) denotes that the storm temporarily weakened below Category4 intensity during the specified period of time. The most intense storms of the decade in terms of sustained winds were 2000's Carlotta and 2009's Jimena with 155mph (250km/h). While the strongest hurricane in terms of barometric pressure was 2001's Juliette with 923hPa (27.26inHg).
† The storm noted formed or attained Category4 status in the central Pacific basin but may have formed in the eastern Pacific basin
‡ The storm noted attained Category4 status more than once
* The storm noted was both a Category4 in the eastern and central Pacific basins
** The storm noted originated in the Atlantic basin, but later intensified into a Category4 hurricane in the eastern Pacific basin
# Storms that attained Category4 status at one point but intensified into Category5 at a later time are not included.
2010s
Hurricane Odile, the most intense Category4 hurricane of the decade in terms of barometric pressureBv. Paseo de La Marina in Cabo San Lucas the morning following Hurricane Odile
During the 2010s, there were 37 Category4 hurricanes in the Pacific Ocean. A dagger (†) denotes that the storm temporarily weakened below Category4 intensity during the specified period of time. The most intense storms of the decade in terms of sustained winds were 2011's Dora, 2014's Amanda, 2015's Jimena, 2018's Hector, and 2019's Barbara at 155mph (250km/h), while the strongest hurricane in terms of barometric pressure was Odile with 918hPa (27.11inHg).
† The storm noted formed or attained Category4 status in the central Pacific basin but may have formed in the eastern Pacific basin
‡ The storm noted attained Category4 status more than once
* The storm noted was both a Category4 in the eastern and central Pacific basins
** The storm noted originated in the Atlantic basin, but later intensified into a Category4 hurricane in the eastern Pacific basin
# Storms that attained Category4 status at one point but intensified into Category5 at a later time are not included.
2020s
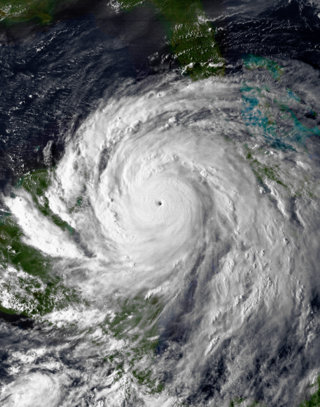
Hurricane Dora of 2023 is the strongest Category 4 Pacific hurricane of the decade so far by maximum sustained winds and tied with Hurricane Norma of 2023 as the most intense by minimum barometric pressure.
During the 2020s, there have been 14 Category4 hurricanes in the Pacific Ocean. A double dagger (‡) denotes that the storm temporarily weakened below Category4 intensity during the specified period of time. In terms of barometric pressure, the most intense Category4 Pacific hurricanes of the decade so far have been Hurricane Dora and Hurricane Norma of 2023, each with a minimum pressure of 939hPa (27.73inHg); by the metric of maximum sustained winds, the strongest Category4 Pacific hurricane of the decade to date is Hurricane Dora of 2023, peaking with sustained winds of 150mph (240km/h).
Of the 143Category4 hurricanes that have formed in the eastern and central Pacific basins, 33have made landfall. Of them, five made landfall at Category4 intensity, four at Category3, thirteen at Categories2 and 1, ten as tropical storms, and eight as tropical depressions. Several of these storms weakened slightly after attaining Category4 status as they approached land;[6][13] this is usually a result of dry air, shallower water due to shelving, cooler waters, or interaction with land.[99]
↑ Though Hurricane Juliette of 2001 made a second landfall in October, it did so after it re-generated. The landfall is included in the "September" total but not the "October" total.
↑ Richard J. Pasch (May 31, 2015). Hurricane Andres Public Advisory Number 16. National Hurricane Center (Report). Miami, Florida: National Oceanic and Atmospheric Administration. Archived from the original on June 3, 2015. Retrieved June 4, 2015.
↑ Dave Roberts (June 1, 2015). Hurricane Andres Discussion Number 18. National Hurricane Center (Report). Miami, Florida: National Oceanic and Atmospheric Administration. Archived from the original on June 3, 2015. Retrieved June 4, 2015.
↑ Dave Roberts (June 1, 2015). Hurricane Andres Public Advisory Number 19. National Hurricane Center (Report). Miami, Florida: National Oceanic and Atmospheric Administration. Archived from the original on June 3, 2015. Retrieved June 4, 2015.
↑ Richard J. Pasch and David P. Roberts (November 30, 2015). Hurricane Blanca(PDF) (Report). Tropical Cyclone Report. Miami, Florida: National Hurricane Center. Archived(PDF) from the original on December 8, 2015. Retrieved December 4, 2015.
↑ Richard J. Pasch and David P. Roberts (October 27, 2015). Hurricane Dolores(PDF) (Report). Tropical Cyclone Report. Miami, Florida: National Hurricane Center. Archived(PDF) from the original on December 8, 2015. Retrieved October 30, 2015.
↑ Richard J. Pasch and David P. Roberts (October 29, 2015). Hurricane Hilda(PDF) (Report). Tropical Cyclone Report. Miami, Florida: National Hurricane Center. Archived(PDF) from the original on November 23, 2015. Retrieved November 1, 2015.
↑ Richard J. Pasch and David P. Roberts (January 20, 2016). Hurricane Ignacio(PDF) (Report). Tropical Cyclone Report. Miami, Florida: National Hurricane Center. Archived(PDF) from the original on February 16, 2016. Retrieved January 23, 2016.
↑ Richard J. Pasch and David P. Roberts (January 29, 2016). Hurricane Sandra(PDF) (Report). Tropical Cyclone Report. Miami, Florida: National Hurricane Center. Archived(PDF) from the original on February 16, 2016. Retrieved February 3, 2016.
↑ John P. Cangialosi (December 3, 2018). Hurricane Olivia(PDF) (Report). Tropical Cyclone Report. Miami, Florida: National Hurricane Center. Archived(PDF) from the original on March 27, 2021. Retrieved December 7, 2018.
↑ Latto, Andy; Powell, Jeff (May 25, 2021). Hurricane Douglas(PDF) (Report). Miami, Florida: National Hurricane Center and Central Pacific Hurricane Center. Archived(PDF) from the original on April 16, 2022. Retrieved February 13, 2024.
↑ Pasch, Richard J.; Roberts, David P. (April 13, 2021). Hurricane Genevieve(PDF) (Report). Miami, Florida: National Hurricane Center. Archived(PDF) from the original on January 16, 2022. Retrieved February 13, 2024.
↑ Papin, Philippe P. (February 18, 2021). Hurricane Marie(PDF) (Report). Miami, Florida: National Hurricane Center. Archived(PDF) from the original on May 1, 2022. Retrieved February 13, 2024.
↑ Cangialosi, John P. (September 9, 2021). Hurricane Felicia(PDF) (Report). Miami, Florida: National Hurricane Center. Archived(PDF) from the original on August 28, 2022. Retrieved February 13, 2024.
↑ Reinhart, Brad J.; Wroe, Derek; Houston, Sam (May 6, 2022). Hurricane Linda(PDF) (Report). Miami, Florida: National Hurricane Center and Central Pacific Hurricane Center. Retrieved February 13, 2024.
↑ Bucci, Lisa (February 27, 2023). Hurricane Darby(PDF) (Report). Miami, Florida: National Hurricane Center. Archived(PDF) from the original on January 17, 2024. Retrieved February 13, 2024.
↑ Papin, Philippe P. (March 9, 2023). Hurricane Orlene(PDF) (Report). Miami, Florida: National Hurricane Center. Archived(PDF) from the original on July 13, 2023. Retrieved February 13, 2024.
↑ Berg, Robbie (February 15, 2023). Hurricane Roslyn(PDF) (Report). Miami, Florida: National Hurricane Center. Archived(PDF) from the original on October 9, 2023. Retrieved February 13, 2024.
↑ Bucci, Lisa (March 5, 2024). Hurricane Dora(PDF) (Report). Miami, Florida: National Hurricane Center. Archived(PDF) from the original on March 12, 2024. Retrieved March 5, 2024.
↑ Berg, Robbie (November 15, 2023). Hurricane Fernanda(PDF) (Report). Miami, Florida: National Hurricane Center. Archived(PDF) from the original on March 7, 2024. Retrieved February 13, 2024.
↑ Reinhart, Brad J. (February 12, 2024). Hurricane Hilary(PDF) (Report). Miami, Florida: National Hurricane Center. Archived(PDF) from the original on February 13, 2024. Retrieved February 13, 2024.
↑ Wore, Derek (September 12, 2018). Tropical Storm Olivia Discussion Number 49. Central Pacific Hurricane Center (Report). National Oceanic and Atmospheric Administration. Archived from the original on September 13, 2018. Retrieved September 13, 2018.
Hurricane Gilbert was the second most intense tropical cyclone on record in the Atlantic basin in terms of barometric pressure, only behind Hurricane Wilma in 2005. An extremely powerful tropical cyclone that formed during the 1988 Atlantic hurricane season, Gilbert peaked as a Category 5 hurricane that brought widespread destruction to the Caribbean and the Gulf of Mexico, and is tied with 1969's Hurricane Camille as the second-most intense tropical cyclone to make landfall in the Atlantic Ocean. Gilbert was also one of the largest tropical cyclones ever observed in the Atlantic basin. At one point, its tropical storm-force winds measured 575 mi (925 km) in diameter. In addition, Gilbert was the most intense tropical cyclone in recorded history to strike Mexico.
The 1993 Atlantic hurricane season was a below average Atlantic hurricane season that produced ten tropical cyclones, eight tropical storms, four hurricanes, and one major hurricane. It officially started on June 1 and ended on November 30, dates which conventionally delimit the period during which most tropical cyclones form in the Atlantic Ocean. The first tropical cyclone, Tropical Depression One, developed on May 31, while the final storm, Tropical Depression Ten, dissipated on September 30, well before the average dissipation date of a season's last tropical cyclone; this represented the earliest end to the hurricane season in ten years.
The 1991 Atlantic hurricane season was the first season since 1984 in which no hurricanes developed from tropical waves, which are the source for most North Atlantic tropical cyclones. The hurricane season officially began on June 1, and ended on November 30. It was the least active in four years due to higher than usual wind shear across the Atlantic Ocean. The first storm, Ana, developed on July 2 off the southeast United States and dissipated without causing significant effects. Two other tropical storms in the season – Danny and Erika – did not significantly affect land. Danny dissipated east of the Lesser Antilles, and Erika passed through the Azores before becoming extratropical. In addition, there were four non-developing tropical depressions. The second depression of the season struck Mexico with significant accompanying rains.
The 1994 Pacific hurricane season was the final season of the eastern north Pacific's consecutive active hurricane seasons that started in 1982. The season officially started on May 15, 1994, in the eastern Pacific, and on June 1, 1994, in the central Pacific, and lasted until November 30, 1994. These dates conventionally delimit the period of each year when most tropical cyclones form in the northeastern Pacific Ocean. The first tropical cyclone formed on June 18, while the last system dissipated on October 26. This season, twenty-two tropical cyclones formed in the north Pacific Ocean east of the dateline, with all but two becoming tropical storms or hurricanes. A total of 10 hurricanes occurred, including five major hurricanes. The above average activity in 1994 was attributed to the formation of the 1994–95 El Niño.
The 1993 Pacific hurricane season included more than double the average number of major hurricanes – Category 3 or stronger cyclones on the Saffir–Simpson scale. This activity was the result of an El Niño event, which is the main factor contributing to above-average activity across the Pacific basin. The season featured 15 named storms, 11 hurricanes, and 9 major hurricanes. While the number of named storms was near the long-term average, the number of hurricanes was above the average of 8, and the number of major hurricanes far exceeded the long-term average of 4. Seasonal activity began on May 17 and ended on November 8, within the confines of a traditional hurricane season which begins on May 15 in the East Pacific and June 1 in the Central Pacific. The season ends on November 30 in both basins. These dates conventionally delimit the period during each year when most tropical cyclones form.
The 1991 Pacific hurricane season was a near-average Pacific hurricane season. The worst storm this year was Tropical Storm Ignacio, which killed 23 people in Mexico and injured 40 others. Elsewhere, Hurricane Fefa caused flooding in Hawaii. Hurricane Kevin was the strongest system of the season and became the then longest-lasting hurricane in the eastern north Pacific basin at the time, and Hurricane Nora was the strongest November storm to that point. The season officially started on May 15, 1991, in the eastern Pacific, and on June 1, 1991, in the central Pacific. It lasted until November 30, 1991, in both basins. These dates conventionally delimit the period of each year when most tropical cyclones form in the northeastern Pacific Ocean.
Hurricane Ava was the earliest forming Category 5 hurricane on record in the East Pacific basin. The storm is also tied with 2006's Hurricane Ioke as the fifth-strongest Pacific hurricane on record. It was the first named storm of the 1973 Pacific hurricane season. Forming in early June, Hurricane Ava eventually reached Category 5 intensity on the Saffir–Simpson hurricane scale, the first Pacific hurricane to do so in June and the earliest ever in a season. Its central pressure made it the most intense known Pacific hurricane at the time. Despite its intensity, Ava stayed at sea without significant impact.
Hurricane Rosa was the only Pacific hurricane to make landfall during the above-average 1994 Pacific hurricane season. It killed at least 4 people in Mexico. Moisture from the hurricane was a factor in widespread flooding in the U.S. state of Texas that killed 22 people and caused hundreds of millions of dollars in damage in October 1994. The pre-Rosa tropical depression formed on October 8 before degenerating the next day. It reformed on October 10 and steadily strengthened as it approached Mexico. Ultimately peaking as a Category 2 hurricane on the Saffir-Simpson Hurricane Scale right before landfall, Rosa was the final hurricane, nineteenth tropical storm, and second-last tropical cyclone of the 1994 Pacific hurricane season.
Hurricane Winifred was the last tropical cyclone to make landfall in the record-breaking 1992 Pacific hurricane season. Impacting western Mexico, especially Colima and Michoacán, Hurricane Winifred brought heavy rain and destruction to the area. Rains flooded farms and roads, and caused more than $5 million in damage and a total of three people were killed.
Tropical cyclones in 2002 were spread out across seven different areas called basins. To date, 123 tropical cyclones formed in 2002. 80 tropical cyclones had been named by either a Regional Specialized Meteorological Center (RSMC) or a Tropical Cyclone Warning Center (TCWC). The strongest system was Cyclone Zoe, with a central pressure of 890 hectopascals (26 inHg). The costliest and deadliest tropical cyclone of the year was Typhoon Rusa, killing 233 in South Korea and causing $4.2 billion in damages. 26 Category 3 tropical cyclones, including eight Category 5 tropical cyclones formed in 2002. The accumulated cyclone energy (ACE) index for the 2002, as calculated by Colorado State University was 812 units.
During 1995, tropical cyclones formed within seven different bodies of water called basins. To date, 110 tropical cyclones formed, of which 74 were given names by various weather agencies. The strongest storm and the deadliest storm of the year was Typhoon Angela, which reached a minimum central pressure of 910 hPa (26.87 inHg) and caused a total of 936 deaths throughout the Philippines. The costliest storm of the year was Hurricane Opal, which caused $4.7 billion in damage throughout Central America and the Gulf Coast of the United States. The accumulated cyclone energy (ACE) index for the 1995, as calculated by Colorado State University was 779.3 units.
This page is based on this Wikipedia article Text is available under the CC BY-SA 4.0 license; additional terms may apply. Images, videos and audio are available under their respective licenses.


