Category 5 South Pacific severe tropical cyclones are tropical cyclones that reach Category 5 intensity on the Australian tropical cyclone intensity scale within the South Pacific basin. They are by definition the strongest tropical cyclones that can form on Earth. A total of 21 tropical cyclones have peaked at Category 5 strength in the South Pacific tropical cyclone basin, which is denoted as the part of the Pacific Ocean to the south of the equator and to the east of 160°E. 20 of these tropical cyclones have been classified as Category 5 on the Australian tropical cyclone intensity scale, while Severe Tropical Cyclone Anne was estimated to be equivalent to a Category 5 on the Saffir–Simpson hurricane wind scale.
The earliest tropical cyclone to be classified as a Category 5 severe tropical cyclone was Hina, which was classified as a Category 5 between March 6 - 7, 1985, as it moved through the Solomon Islands. The latest system to be classified as a Category 5 severe tropical cyclone was Cyclone Niran, which was classified on March 5, 2021, before it made landfall on New Caledonia.
The South Pacific tropical cyclone basin is located to the south of the Equator between 160°E and 120°W. [1] The basin is officially monitored by the Fiji Meteorological Service (FMS) and the New Zealand MetService who are the primary warning centres for the region. [1] [2] Other meteorological services such as the Australian Bureau of Meteorology (BoM), Météo-France (MF) as well as the United States Joint Typhoon Warning Center (JTWC) and the National Weather Service also monitor the basin. [1] [2] Within the basin, a Category 5 severe tropical cyclone is a tropical cyclone that has 10-minute maximum sustained wind speeds over 107 knots (198 km/h; 123 mph) or greater on the Australian tropical cyclone intensity scale. [1] [3] A named storm could also be classified as a Category 5 tropical cyclone if it is estimated, to have 1-minute mean maximum sustained wind speeds over 137 knots (254 km/h; 158 mph) on the Saffir–Simpson hurricane wind scale. [1] [4] Within the basin this scale is only officially used in American Samoa, however, systems are commonly compared to the SSHWS using 1-minute sustained windspeeds from the United States Joint Typhoon Warning Center. [1] [5] [6] On both scales, a Category 5 tropical cyclone is expected to cause widespread devastation, if it significantly impacts land at or near its peak intensity. [3] [4]
Before the formal start of the satellite era during the 1969-70 season, there was no way of determining how intense a tropical cyclone was unless it impacted land or either a ship or a plane happened to observe it. [7]
Over the years, the intensity estimates of tropical cyclones have been reanalysed for various reasons and were found to have been underestimated by the various warning centres. [2] [5]
There is not enough evidence available to make definitive conclusions about how climate change is impacting Category 5 severe tropical cyclones, however, tropical cyclones are generally expected to become stronger and more frequent in the future. [8]
Name | Duration | Peak intensity | Areas affected | Damage (USD) | Deaths | Refs | |
---|---|---|---|---|---|---|---|
Wind speed | Pressure | ||||||
Hina | March 10 - 19, 1985 | 220 km/h (140 mph) | 910 hPa (26.87 inHg) | Solomon Islands, Vanuatu, Fiji | >$3 million | 1 | [9] |
Fran | March 4 - 11, 1992 | 205 km/h (125 mph) | 920 hPa (27.17 inHg) | Wallis and Futuna, Fiji, Vanuatu New Caledonia, Queensland, New Zealand | Unknown | Unknown | [12] |
Ron | January 1 - 9, 1998 | 230 km/h (145 mph) | 900 hPa (26.58 inHg) | Samoan Islands, Wallis and Futuna, Tonga | None | [13] | |
Susan | December 20, 1997 – January 10, 1998 | 230 km/h (145 mph) | 900 hPa (26.58 inHg) | Solomon Islands, Vanuatu, Fiji | $100,000 | 1 | [14] |
Zoe | December 23 2002 - January 4, 2003 | 240 km/h (150 mph) | 890 hPa (26.28 inHg) | Solomon Islands, Vanuatu, Fiji | Severe | None | [17] |
Beni | January 19 - February 1, 2003 | 205 km/h (125 mph) | 920 hPa (27.17 inHg) | Solomon Islands, Vanuatu New Caledonia, Australia | $1 million | 1 | [18] |
Dovi | February 8 - 9, 2003 | 205 km/h (125 mph) | 920 hPa (27.17 inHg) | Niue, Cook Islands | Minimal | None | [19] |
Erica | March 12 - 14, 2003 | 215 km/h (130 mph) | 915 hPa (27.02 inHg) | Queensland, Solomon Islands Vanuatu, New Caledonia | $15 million | 2 | [21] |
Heta | January 5 - 6, 2004 | 215 km/h (130 mph) | 915 hPa (27.02 inHg) | Samoan Islands, Niue, Tonga, Wallis and Futuna | $225 million | 3 | [22] [23] |
Meena | February 1 - 11, 2005 | 215 km/h (130 mph) | 915 hPa (27.02 inHg) | Cook Islands | $20 million | None | [27] |
Olaf | February 10 - 20, 2005 | 215 km/h (130 mph) | 915 hPa (27.02 inHg) | Samoan Islands, Cook Islands | $10 million | None | [28] |
Percy | February 23 - March 5, 2005 | 230 km/h (145 mph) | 900 hPa (26.58 inHg) | Tokelau, Samoan Islands, Cook Islands | $25 million | None | [29] |
Ului | March 14, 2010 | 215 km/h (130 mph) | 915 hPa (27.02 inHg) | Solomon Islands, Vanuatu | Unknown | 1 | [30] |
Ian | January 11, 2014 | 205 km/h (125 mph) | 930 hPa (27.46 inHg) | Fiji, Tonga | $48 million | 1 | [32] |
Pam | March 12 - 14, 2015 | 250 km/h (155 mph) | 896 hPa (26.46 inHg) | Fiji, Kiribati, Solomon Islands, Tuvalu Vanuatu, New Caledonia, New Zealand | $360 million | 16 | [34] |
Winston | February 18 - 21, 2016 | 280 km/h (175 mph) | 884 hPa (26.10 inHg) | Vanuatu, Fiji, Tonga, Niue | $1.4 billion | 44 | [35] |
Donna | May 8, 2017 | 205 km/h (125 mph) | 937 hPa (27.67 inHg) | Melanesia, New Zealand | $10 million | 2 | [37] |
Gita | February 13 - 14, 2018 | 205 km/h (125 mph) | 927 hPa (27.37 inHg) | Solomon Islands, Vanuatu, Fiji, Niue Wallis and Futuna, Samoan Islands, Tonga | $221 million | 2 | [38] |
Harold | April 2 - 9, 2020 | 230 km/h (145 mph) | 920 hPa (27.17 inHg) | Solomon Islands, Vanuatu, Fiji, Tonga | Significant | 29 | [40] |
Yasa | December 11 – 19, 2020 | 230 km/h (145 mph) | 917 hPa (27.08 inHg) | Fiji, Tonga | Significant | 4 | [42] |
Niran | February 25 – March 8, 2021 | 205 km/h (125 mph) | 931 hPa (27.49 inHg) | Queensland, New Caledonia | Extensive | [44] | |
Kevin | February 27, 2023 – March 6, 2023 | 230 km/h (145 mph) | 913 hPa (26.96 inHg) | Solomon Islands, Vanuatu, New Caledonia | Extensive | [47] | |
Lola | October 23 – 27, 2023 | 215 km/h (130 mph) | 930 hPa (27.46 inHg) | Solomon Islands, Vanuatu, New Caledonia | Unknown | [48] |
In addition to the tropical cyclones listed above, Severe Tropical Cyclone Anne (1988) was estimated by the JTWC to have peaked with one-minute sustained wind speeds of 260 km/h (160 mph) for six hours on January 11, 1988. [49] This made it equivalent to a Category 5 hurricane on the SSHWS; however, the FMS estimated that the system had peaked with 10-minute sustained winds of 185 km/h (115 mph) based on the Dvorak technique, which made it a Category 4 severe tropical cyclone on the Australian scale. [49] [50] Elsewhere in the South Pacific Ocean, Severe Tropical Cyclones: Dominic (1982), Elinor (1983), Kathy (1984), Harry (1989), Aivu (1989), Rewa (1993-94), Theodore (1994), Monica (2006), Hamish (2009), Yasi (2011), Ita (2014), Marcia (2015), Jasper (2023) were each considered to be a Category 5 severe tropical cyclone by the BoM while located in the Australian region. [51] During a database repair project that took place between 2005 and 2007, the BoM discovered that Severe Tropical Cyclone Pam 1974 had been reanalysed at some point after 1979. [52] This reanalysis showed that Pam had moved into the Australian region as a category 5 severe tropical cyclone, however, during 2021 it was determined that the width of Pam's southern eyewall was too narrow at this time and the BoM downgraded it to a Category 4 severe tropical cyclone. [52]
During 2014, Meteo France's French Polynesian Meteorological Centre and RSMC La Reunion published the results of a reanalysis, they had undertaken into Severe Tropical Cyclone's Nisha-Orama and Veena of the 1982-83 season. [2] Within the reanalysis, they found that Nisha-Orama was the strongest tropical cyclone to impact French Polynesia on record and had peaked with 10-minute sustained wind speeds of 228 km/h (142 mph) and a minimum pressure of 898 hPa (26.52 inHg). [2] They also estimated that Veena had peaked with 10-minute sustained wind speeds of 211 km/h (131 mph) and a minimum pressure of 910 hPa (26.87 inHg). [2] During 2017, a study into extreme tropical cyclone activity in the southern Pacific Ocean was published in the Royal Meteorological Society's International Journal of Climatology. [5] Within the study, the authors reanalysed satellite images of several tropical cyclones between 1980 - 2016 using the 1984 Dvorak Technique and found that 18 tropical cyclones had reached Category 5 intensity on the Saffir-Simpson hurricane wind scale. [5] In particular the study estimated that Severe Tropical Cyclones: Nisha - Orama and Oscar of the 1982-83 season had peaked with 1-minute sustained wind speeds of 280 km/h (175 mph) and that Anne (1988) had peaked with 1-minute wind speeds of 285 km/h (180 mph). [5] They also estimated that Severe Tropical Cyclone Hina had peaked with 1-minute sustained wind speeds of 315 km/h (195 mph), which would make it one of the strongest tropical cyclones on record in the Southern Hemisphere. [5]
Off the 22 Category 5 severe tropical cyclones listed above, only Severe Tropical Cyclones: Fran, Beni, Erica, Ului, Pam, Winston, Harold, Yasa and Kevin are considered to have made landfall on a Pacific nation. Severe Tropical Cyclone's Pam, Winston, Harold and Yasa are the only systems to have made landfall while at Category 5 intensity and were considered to have caused widespread devastation to Fiji and Vanuatu.[ citation needed ] Erica directly impacted New Caledonia as a Category 5 severe tropical cyclone, however, it had markedly weakened, before it made landfall on New Caledonia's main island. [53] [54]
Severe Tropical Cyclone's Fran, Beni and Ului all made landfall on Queensland, Australia. In addition to these six systems making landfall, several systems have either threatened or passed very near to various smaller islands at their peak intensity. In particular, Fran passed in between the islands of Efate and Erromango in Vanuatu during March 9, 1992 while Susan threatened Vanuatu during January 5, 1998, but recurved in time to spare the island nation a direct hit. [55] [14] At around 18:00 UTC on January 6, 1998, Severe Tropical Cyclone Ron passed within 10 km (5 mi) of the Tongan island of Niuafo'ou. [14] Severe Tropical Cyclone Zoe passed near or over several of the Solomon Islands within Temotu Province during December 2002. [6]
During 2020, Cyclone Harold made landfall on northern Vanuatu as a Category 5 severe tropical cyclone, before later impacting Fiji and Tonga as a Category 4 severe tropical cyclone. [43] Later that year, Cyclone Yasa made landfall in Fiji as a Category 5 severe tropical cyclone with sustained winds of 240 km/h (150 mph) and momentary gusts of 345 km/h (215 mph). [43] Severe Tropical Cyclone Niran subsequently skirted the coast of New Caledonia as it weakened into a Category 3 Severe Tropical Cyclone. [46]
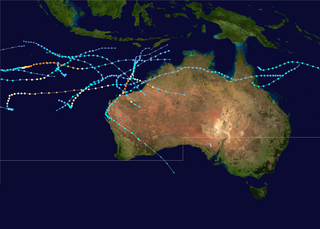
The 1999–2000 Australian region cyclone season was a slightly above average tropical cyclone season. It ran from 1 November 1999 to 30 April 2000. The regional tropical cyclone operational plan also defines a "tropical cyclone year" separately from a "tropical cyclone season", with the "tropical cyclone year" for this season lasting from 1 July 1999 to 30 June 2000.
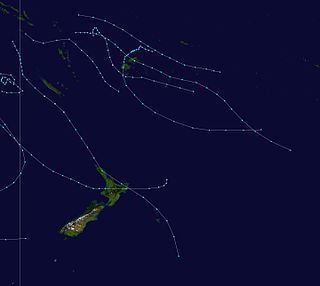
The 2002–03 South Pacific cyclone season was the most active and longest tropical cyclone season since 1997–98, with ten tropical cyclones occurring within the South Pacific basin between 160°E and 120°W. The season started earlier than normal, with two systems developing before the official start of the season on November 1, 2002, while the final system dissipated on June 9, 2003, after the season had officially ended on April 30. During the season, tropical cyclones were officially monitored by the Regional Specialized Meteorological Centre (RSMC) in Nadi, Fiji and the Tropical Cyclone Warning Centres in Brisbane, Australia and Wellington, New Zealand. The United States Armed Forces through the Joint Typhoon Warning Center (JTWC), also monitored the basin and issued unofficial warnings for American interests. RSMC Nadi attaches a number and an F suffix to tropical disturbances that occur within the basin, while the JTWC designates significant tropical cyclones with a number and a P suffix. RSMC Nadi, TCWC Wellington and TCWC Brisbane all use the Australian Tropical Cyclone Intensity Scale and estimate windspeeds over a ten-minute period, while the JTWC estimates sustained winds over a one-minute period, which are subsequently compared to the Saffir–Simpson Hurricane Scale (SSHS).
The 1988–89 South Pacific cyclone season was an active tropical cyclone season with an above average number of tropical cyclones observed.
The 1979–80 South Pacific cyclone season saw mostly weak systems.
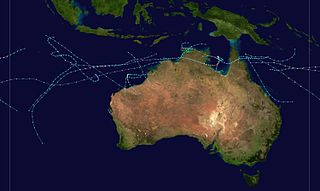
The 1984–85 Australian region cyclone season was one of the most active seasons on record. It officially started on 1 November 1984, and officially ended on 30 April 1985.
The 1990–91 South Pacific cyclone season was one of the least active tropical cyclone seasons on record, with only two tropical cyclones occurring within the South Pacific basin to the east of 160°E. The season officially ran from November 1, 1990 to April 30, 1991, with the first disturbance of the season forming on November 23, 1990, while the final disturbance dissipated on May 19, 1991. During the season there were no deaths recorded from any of the tropical cyclones while they were within the basin. However, six people were killed by Cyclone Joy, when it made landfall on Australia. As a result of the impacts caused by Joy and Sina, the names were retired from the tropical cyclone naming lists.
The 1994–95 South Pacific cyclone season was one of the least active South Pacific tropical cyclone seasons on record, with only four tropical cyclones officially occurring within the South Pacific Ocean basin between 160°E and 120°W. The season ran from November 1, 1994, until April 30, 1995, with the first disturbance of the season developing on November 12 and the last disturbance leaving the base on March 5. The most intense tropical cyclone during the season was Tropical Cyclone Violet, which briefly existed within the basin. After the season, the name William was retired from the tropical cyclone naming lists.
The 1982–83 South Pacific cyclone season was one of the most active and longest South Pacific tropical cyclone seasons on record, with 16 tropical cyclones occurring within the South Pacific basin between 160°E and 120°W. During the season tropical cyclones were monitored by the meteorological services of Australia, Fiji, French Polynesia and New Zealand. The United States Armed Forces through the Joint Typhoon Warning Center (JTWC) and Naval Pacific Meteorology and Oceanography Center (NPMOC), also monitored the basin and issued unofficial warnings for American interests. The first tropical cyclone of the season developed a day before the season officially began on October 30, while the last tropical cyclone of the season dissipated on May 16. Most of the activity during the season occurred within the central and eastern parts of the basin with French Polynesia affected by several systems.
Severe Tropical Cyclone Kina was at the time the costliest storm to impact Fiji on record. Total losses from Kina are estimated to be near $F170 million ($US110 million). The system was first noted as a tropical depression, to the east of the Solomon Islands on 23 December. Over the next few days the system moved south-eastwards and gradually developed further, before it was named Kina, after it had developed into a tropical cyclone on 26 December.
The 1984–85 South Pacific cyclone season was an above-average tropical cyclone season, with nine tropical cyclones occurring within the basin between 160°E and 120°W. The season ran from November 1, 1984, to April 30, 1985, with tropical cyclones officially monitored by the Fiji Meteorological Service (FMS), Australian Bureau of Meteorology (BoM) and New Zealand's MetService. The United States Joint Typhoon Warning Center (JTWC) and other national meteorological services including Météo-France and NOAA also monitored the basin during the season. During the season there was nine tropical cyclones occurring within the basin, including three that moved into the basin from the Australian region. The BoM, MetService and RSMC Nadi all estimated sustained wind speeds over a period of 10-minutes, which are subsequently compared to the Australian tropical cyclone intensity scale, while the JTWC estimated sustained winds over a 1-minute period, which are subsequently compared to the Saffir–Simpson hurricane wind scale (SSHWS).
{{cite web}}
: CS1 maint: archived copy as title (link)