Cumulative track map of all North Indian Ocean cyclones from 1970 to 2005
In the Indian Ocean north of the equator, tropical cyclones can form throughout the year on either side of the Indian subcontinent, although most frequently between April and June, and between October and December.
The North Indian Ocean is the least active official basin, contributing only seven percent of the world's tropical cyclones. However the basin has produced some of the deadliest cyclones in the world, since they strike over very densely populated areas.[1] The Regional Specialized Meteorological Centre (RSMC) is the India Meteorological Department (IMD) and it is responsible to monitor the basin, issues warning and name the storms.[2]
Sub-basins
Very severe cyclonic storms Luban (left) and Titli (right) over the Arabian Sea and the Bay of Bengal in October 2018
The Bay of Bengal, located in the northeast of the Indian Ocean. The basin is abbreviated BOB by the India Meteorological Department (IMD).[4] The United States's Joint Typhoon Warning Center unofficially designates as B to classify storms formed in the Bay of Bengal.[5] The Bay of Bengal's coast is shared among India, Bangladesh, Myanmar, Sri Lanka and western part of Thailand.[6] This sub-basin is the most active and produces some of the deadliest cyclones of all time.[7] The most intense cyclone in the bay was the 1999 Odisha cyclone.[8]
The Arabian Sea is a sea located in the northwest of the Indian Ocean. Tropical cyclones in the basin are abbreviated ARB by the India Meteorological Department (IMD).[4] The United States's Joint Typhoon Warning Center unofficially designates as A to classify storms formed in the Arabian Sea.[9] The Arabian Sea's coast is shared among Pakistan, India, Yemen, Oman, UAE, Iran, Sri Lanka, Maldives and Somalia.[10]Monsoons are characteristic of the Arabian Sea and responsible for the yearly cycling of its waters. In summer, strong winds blow from the southwest to the northeast, bringing rain to the Indian subcontinent. Cyclones are less frequent in the Arabian Sea, but the basin can produce strong tropical cyclones.[10]Cyclone Gonu was the strongest and the costliest recorded tropical cyclone in the basin.[11]
History of the basin
The systematic scientific studies of tropical systems in the Bay of Bengal and Arabian Sea was started during the 19th century by Henry Piddington.[12] Piddington utilised meteorological logs of vessels that navigated the seas and published a series of memoirs, in the Journal of the Asiatic Society of Bengal between 1839 and 1858.[12] These memoirs gave accounts and tracks of individual storms in the Bay of Bengal and the Arabian Sea.[12]
During the 2004 post monsoon season the IMD started to name tropical cyclones within the basin, with the first one named Cyclone Onil during September 2004.[13] During 2015 a modification to the intensity scale took place, with the IMD and WMO calling a system with 3-minute maximum sustained wind speeds between 90 knots (165km/h; 105mph) and 120 knots (220km/h; 140mph) an extremely severe cyclonic storm.[14]
A study analysing the spring season of tropical cyclones in the Bay of Bengal found increases in both pre-monsoon precipitation and tropical cyclone intensity as a result of enhanced large-scale monsoon circulation after 1979. The deepened monsoon trough in the Bay of Bengal not only affects cyclone frequency and timing, but also acts to direct more cyclones towards Myanmar. Increased anthropogenic aerosols likely contributed to such a regional climate change.[15]
Climatology
Formation and frequency
On average only five to six tropical cyclones form in the basin each year. Tropical cyclones form in the months of March to June and October to December, with peaks at May and November. Most of these storms form in the Bay of Bengal: either in the southeastern Bay of Bengal, in the Andaman Sea, or as a remnant of a typhoon from the South China Sea, and a few in the Arabian Sea.[8] High sea surface temperatures and humidity makes the bays more favourable to tropical cyclone development.[16] There are many tropical cyclones in the West Pacific; this may be another reason for increased[clarification needed] tropical cyclogenesis in the Bay, as it shares a fair portion of the increased quota of ACE. Meanwhile, the storms in the Arabian Sea mostly form over south-eastern part of the Arabian Sea or a remnant of a tropical cyclone from the Bay of Bengal, however the frequency of cyclogenesis in the Arabian Sea is generally less, due to cooler sea surface temperature and high wind shear.[8] However a strong positive Indian Ocean Dipole may cause an increase of tropical cyclogenesis than usual[clarification needed] which was seen in the 2019 season.[17] Very few tropical cyclones develop in the months of June to September (Monsoon months) because of high vertical wind shear. These storms form in the Bay of Bengal and peak as depressions or deep depressions before making landfall in Odisha or West Bengal. Another reason is the low life span in the sea[clarification needed] which also avoids the intensification of these low-pressure systems.[8]
Movement
Most of the storms move in a north-westerly direction and starts curving either towards southwest or northeast. There's a higher frequency of recurving towards northeast rather going southwest. In the Arabian Sea these storms mostly move in north-westerly direction targeting the Arabian Peninsula, however in some case these storm moves north-eastwards after crossing the 15°Nlatitude and strikes the Gujarati coast. In the Bay of Bengal, storms generally moves north-westwards until reaching the east coast and then moves north-eastwards.[18]
Intensification
Intensification probability is maximum in the months of April, May and November in case of a depression becoming a cyclonic storm and severe cyclonic storm. More than half of the depressions intensify into a storm and a quarter intensify into a cyclone in these months.[19]
Landfall
In the Arabian Sea, most storms dissipate offshore without making landfall, but a significant number of tropical cyclones also impact the west coast, particularly the states of Gujarat and Maharashtra. The remaining 11 percent makes landfall in either the Arabian Peninsula, Horn of Africa or Pakistan.[20] In rare cases, some storms make landfall in Iran, like Cyclone Gonu did in 2007.[21] Other than Gonu, two storms: Cyclone Yemyin and Kyarr made some or major impact in Iran.[22][23]
In the Bay of Bengal, most of the storms strikes either the Indian states of Odisha or West Bengal and a significant number of storms hit the states of Andhra Pradesh and Tamil Nadu. 30 percent of the cyclones strike the countries of Bangladesh, Sri Lanka and Myanmar while the remaining 13 percent just dissipates off shore without making landfall.[20]
After a series of devastating cyclones in 2018, rising number of cyclones in the Arabian Sea in 2019 and a rising trend of rapid intensification in 2020 and 2021, many climatologists agree that climate change have caused these activities. On average, five cyclonic storms occur every year in the Arabian Sea. However, in 2019 eight cyclonic storms formed, becoming the record highest number of tropical cyclones in the sub-basin, which was tied with the 1902 season.[24][25] Research has found that in recent decades the sea surface temperatures has risen up by 1.2–1.4°C (2.2–2.5°F) in the Arabian Sea.[25] During Cyclone Amphan’s rapid intensification, sea surface temperatures were as high as 33°C (91°F) in the Bay of Bengal, and parts of the Arabian Sea reached 32°C (90°F) before the formation of Cyclone Nisarga.[26] According to the Union Ministry of Earth and Science, the frequency of very severe cyclonic storms has risen up by one per decade in last two decades, despite the decrease of the overall tropical cyclone frequency in the same period.[25] Higher temperatures caused the cyclones to become more powerful and lead to tropical cyclone formation faster. Rising sea level also caused higher storm surge.[26] Researchers also predict that cyclones will be deadlier and stronger as the trend of warming sea surface temperatures continue. Rising sea levels also may cause severe flooding, strong storm surge and inundation of coastal towns.[26]
Seasons
Historical storm formation by month between 1990 and 2020
First super cyclonic storm in the Bay of Bengal since 1999 Featured one of the costliest cyclones ever recorded in the basin, Amphan Second-costliest North Indian cyclone season on record
The first cyclonic storm didn't develop until October 3. Deadliest North Indian Ocean cyclone season since 2008 Featured Senyar, one of only two tropical cyclones on record to exist in the Malacca Strait, as well as the costliest cyclone in the basin on record. Costliest North Indian cyclone season on record
Total
62
35
24
16
9
5
1
Amphan
4,648
$53.38 billion
Records
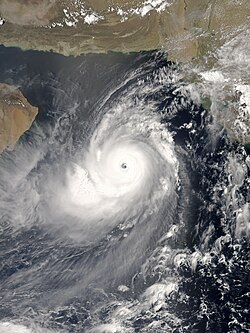
The most intense tropical cyclone of the basin was the 1999 Odisha Cyclone. It was the strongest tropical cyclone to hit the Indian state of Odisha. The maximum recorded wind speed was 260km/h (160mph) with minimum barometric pressure of 912mbar (26.93inHg).[31]
The costliest tropical cyclone in the Indian Ocean Basin was Cyclone Senyar, which struck the Malay Peninsula and Sumatra on 27 November 2025. The recorded damage cost was US$19.8 billion beating the previous record of 2020's Cyclone Amphan which caused US$15.5 billion.[32]
The smallest tropical cyclone was Cyclone Ogni, which struck the Andhra Pradesh coast on October 30, 2006. The cyclone's diameter was only 100km (62mi).[35]
↑India Meteorological Department (1936). "Annual Summary— Storms & Depressions"(PDF). India Weather Review. National Oceanic and Atmospheric Administration. Archived from the original(PDF) on 2019-06-14. Retrieved September 2, 2024.
This page is based on this Wikipedia article Text is available under the CC BY-SA 4.0 license; additional terms may apply. Images, videos and audio are available under their respective licenses.