2006 North Indian Ocean cyclone season

Last updated
2006 North Indian Ocean cyclone season
2006 North Indian Ocean cyclone season summary map.png
Season summary map
Seasonal boundaries
First system formedJanuary 13, 2006
Last system dissipatedOctober 30, 2006
(Officially)
December 7, 2006 (Unofficially)
Strongest storm
Name Mala
  Maximum winds185 km/h (115 mph)
(3-minute sustained)
  Lowest pressure954 hPa (mbar)
Seasonal statistics
Depressions12, 1 unofficial
Deep depressions6, 1 unofficial
Cyclonic storms3
Severe cyclonic storms2
Very severe cyclonic storms1
Extremely severe cyclonic storms1
Total fatalities623 total
Total damageAt least $6.7 million (2006 USD)
Related articles
North Indian Ocean tropical cyclone seasons
2004, 2005, 2006, 2007, 2008

The 2006 North Indian Ocean cyclone season had no bounds, but cyclones tend to form between April and December, with peaks in May and November. These dates conventionally delimit the period of each year when most tropical cyclones form in the northern Indian Ocean.

Contents

The scope of this basin is north of the Equator and west of the Malay Peninsula. The IMD and JTWC monitor this basin. This basin is divided in two seas by India, the Bay of Bengal and Arabian Sea, abbreviated BOB and ARB, respectively.

Although an inactive year, 2006 had more of note than previous years like 2005 or 2004. Cyclone Mala caused severe damage and killed 22 when it hit Burma as a cat. 3. An unnamed depression killed over 100 in India, and cyclonic storm Ogni caused minor effects in India as well. Additionally, the remnants of Typhoon Durian crossed the Malay Peninsula causing minor effects, but was a rare basin-crosser in this area.

Season summary

Cyclone Mala2006 North Indian Ocean cyclone season

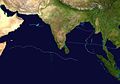
Overall activity across the North Indian Ocean during 2006 was slightly below-average, with 12 depressions, 3 cyclonic storms, and 1 very severe cyclonic storm. An average season, according to the IMD, consists of 15 depressions and 5–6 cyclonic storms. [1] In addition to the storms monitored by the IMD, the JTWC also tracked the remnants of Typhoon Durian across the Malay Peninsula into the Andaman Sea as a tropical depression in early December. [2] The majority of storms formed within the Bay of Bengal, with only two existing in the Arabian Sea. Activity peaked during the summer due to an active southwest monsoon. [1] [3]

Starting in May, the seasonal monsoon developed over the Bay of Bengal and advanced northwestward over India where it propagated through September. During this period the system spawned numerous disturbances, nine of which became tropical cyclones. All but one of these systems formed in the northern Bay of Bengal and struck Odisha before spreading rain across large portions of India. The outlier was Severe Cyclonic Storm Mukda in late September which remained virtually stationary its entire existence to the southwest of Gujarat. [3] The combined effects of the eight other depressions along with the monsoon itself caused disastrous flooding throughout India. By early August, nearly 500,000 people were evacuated in Mumbai due to rising waters. [4] The collective effects of the depressions alone resulted in at least 562 fatalities with hundreds more attributed to the monsoon rains. [1] More than 1 million people across Odisha were left homeless from the storms. [5]

During periods of cyclonic activity, rainfall associated with the monsoon was above-average as a whole. Departures from average reached 13.8%, 26.2%, 28.1%, 9.8%, and 11.5% for the periods of July 5–12 (BOB 02), August 2–9 (BOB 03), August 9–16 (BOB 04), September 20–27 (Land 01 and Mukda), and September 27–October 5 (BOB 08), respectively. [1] [3] In contrast to the notable activity of the monsoon in respect to tropical cyclone formation, rainfall from the monsoon across India was predominantly below-average due to poor distribution of rain. Of the four broadly defined regions of India used by the IMD, only Central India experienced above-average rainfall, possibly due to the multiple cyclones that passed through the region. This area received an average of 1,152.2 mm (45.36 in) of rain between June and September, while the average is 993.9 mm (39.13 in). In addition, five sub-divisions (the Andaman and Nicobar Islands, Arunachal Pradesh, Assam and Meghalaya, west Uttar Pradesh, and Haryana) experienced drought conditions. [3]

Systems

Deep Depression ARB 01

Deep depression (IMD)
Tropical storm (SSHWS)
ARB 01 2006-01-14 0815Z.jpg   Cyclone 01A 2006 track.png
DurationJanuary 13 – January 14
Peak intensity55 km/h (35 mph) (3-min) 1004  hPa  (mbar)

The first system of the year was the seventh storm to form in the northern Indian Ocean since September 2005, and a rare January system. It originated from an area of convection south of Sri Lanka, located in an area of low wind shear. The thunderstorms increased as outflow improved. [6] On January 13, the IMD classified the system as a depression south of the southernmost point of India. The system moved west-northwestward into the southeastern Arabian Sea. [7] Late that day, the JTWC classified the system as Tropical Cyclone 01A. [6] Early on January 14, the IMD upgraded the system to a deep depression, estimating peak 3 minute winds of 55 km/h (35 mph). [7] The JTWC estimated stronger winds of 85 km/h (55 mph), or tropical storm status. [8] Subsequently, the circulation became disorganized and convection dwindled due to increased wind shear, although its outskirts brought light rainfall to southwest India. Around 00:00  UTC on January 15, the system degenerated into a remnant low. [7] [6] The remnants continued westward across the Arabian Sea, dissipating completely on January 19. [8]

Extremely Severe Cyclonic Storm Mala

Extremely severe cyclonic storm (IMD)
Category 4 tropical cyclone (SSHWS)
Cyclone Mala.JPG   Mala 2006 track.png
DurationApril 25 – April 29
Peak intensity185 km/h (115 mph) (3-min) 954  hPa  (mbar)

In mid-April, an area of disturbed weather formed over the southern Bay of Bengal and nearby Andaman Sea. Over a period of several days, the system became increasingly organized and was classified as a depression on April 24. Situated within a region of weak steering currents, the storm slowly intensified as it drifted in a general northward direction. It attained gale-force winds and was named Mala the next day. Conditions for strengthening improved markedly on April 27 and Mala subsequently underwent rapid intensification. Subsequently, the cyclone attained its peak intensity. Early on April 28, the cyclone had estimated winds of 185 km/h (115 mph) and a barometric pressure of 954 mbar (hPa; 28.17  inHg). [9] The JTWC considered Mala to have been slightly stronger, classifying it as a Category 4-equivalent cyclone. [10] Steady weakening ensued thereafter and the storm made landfall in Myanmar's Rakhine State on April 29. Rapid dissipation took place after it made landfall and Mala was last noted early the next morning. [9]

In contrast to Mala's intensity, damage was relatively minimal across Myanmar due to adequate early warnings, while timely and effective evacuations minimized loss of life along the coast. [11] The greatest damage resulted from a thunderstorm near Yangon on April 28 that spawned a possible tornado in an industrial zone. A total of 586 homes were damaged there. [12] Just outside the city in the Hinthada District, a flash flood killed at least 18 people. [11] Overall, the storm claimed 37 lives in the country and left US$6.7 million in damage. [13] [14] [15] In the wake of Mala, the Red Cross distributed relief aid to affected residents while local officials set up shelters to house those left homeless. [16] Government and social organizations donated 5.4 million kyat (US$4,320) in cash to survivors in the Ayeyarwady Region. [17] [18]

Deep Depression BOB 02

Deep depression (IMD)
Tropical storm (SSHWS)
Tropical Storm 03B 2006.jpg   Cyclone 03B 2006 track.png
DurationJuly 2 – July 5
Peak intensity55 km/h (35 mph) (3-min) 982  hPa  (mbar)

In late June, an area of disturbed weather persisted over the northern Bay of Bengal, unusually far south for a monsoonal system for this time of year. Convergence from the monsoon enhanced convection to the southwest of a developing low-pressure area; however, strong wind shear was expected to prevent tropical cyclogenesis. However, the system rapidly organized into a deep depression by July 2, at which time it was situated 240 km (150 mi) south of Calcutta, India. [19] At 1200 UTC, the JTWC classified the cyclone as a tropical storm with one-minute sustained winds of 65 km/h (40 mph). [20] This marked only the second time since 1981 that the JTWC had monitored a July storm with gale-force winds in the basin. [19] Weak steering currents prompted the a slow, westward track and just three hours later, the cyclone made landfall between Paradeep and Chandabali in Odisha. [21] A pressure of 982 mb (hPa; 29.00 inHg), the lowest in relation to the storm, was measured in Bhubaneswar as the deep depression moved through. [19] Once onshore, steady weakening took place and the depression ultimately degenerated into a remnant low on July 5 over Vidarbha. [21]

Owing to the cyclone's monsoonal nature, it produced heavy rains across a large swath of India and encompassed both coastlines. The heaviest rains fell in Odisha and Gujarat, with many areas receiving over 300 mm (12 in). A two-day total of 630 mm (25 in) was measured in the Nabarangpur district and many nearby areas reported over 500 mm (20 in). Ahwa, Gujarat, recorded the greatest single-day total of 390 mm (15 in), and received at least 540 mm (21 in) during the entire event. The hardest hit areas were Odisha and Vidarbha, where 36 and 41 people were killed, respectively. [21] At least five of the deaths were from fishermen who drowned offshore while the others resulted from landslides or building collapses. [22] In the nearby states, Andhra Pradesh, Jharkhand, Karnataka, a further 30 people were killed collectively from flooding and mudslides. The normally slow-moving Saglana River burst its banks in Bhavnagar, Gujarat, and left most of the city submerged. Several homes collapsed and power supply became erratic. At least two people lost their lives in the city. [23] A further 24 people were killed in the Navsari district after two rivers flooded surrounding areas. [24]

Depression BOB 07

Depression (IMD)
BOB 07 2006-09-04 0507Z.jpg   BOB07 2006 track.png
DurationSeptember 3 – September 4
Peak intensity45 km/h (30 mph) (3-min) 992  hPa  (mbar)

A low-pressure area formed over northwest Bay of Bengal on 2 September. It concentrated into a depression the next day and crossed the north Orissa coast near Chandbali in the early morning of 4 September. Govindpur in Orissa recorded 150 mm of rainfall on 4 September. [25]

Land Depression 01

Depression (IMD)
LAND 01 2006-09-22 0456Z.jpg   LAND01 2006 track.png
DurationSeptember 21 – September 24
Peak intensity45 km/h (30 mph) (3-min) 996  hPa  (mbar)

The India Meteorological Department upgraded a well-marked low-pressure area near Jamshedpur, India to a land depression with a minimum central pressure of 996hPa and maximum sustained winds of 25 knots (46 km/h) on September 21. [26] The United States Naval Research Laboratory previously monitored the system as an area of interest before it moved inland near the border of India and Bangladesh. The depression degenerated into a low-pressure area on September 24 and dissipated later that day. Torrential downpours caused flooding that killed more than 170 people and left around 375,000 homeless in eastern India and Bangladesh. Tantloi in West Bengal received 370 mm of rainfall in 48 hours between 22 and 23 September. [27]

Severe Cyclonic Storm Mukda

Severe cyclonic storm (IMD)
Tropical storm (SSHWS)
SCS Mukda 2006.jpg   Mudka 2006 track.png
DurationSeptember 21 – September 24
Peak intensity100 km/h (65 mph) (3-min) 988  hPa  (mbar)

An area of convection persisted west of India on September 18 within a broad trough. Low wind shear allowed for gradual organization as the system moved westward. The thunderstorms organized about an exposed circulation. [28] Early on September 21, the IMD classified it as a depression about 450 km (280 mi) southwest of Porbandar, Gujarat. [7] Around the same time, the JTWC began issuing warnings on the system as Tropical Cyclone 04A. [28] The system remained nearly stationary and quickly organized. By 12:00 UTC on September 22, the IMD had upgraded it to a severe cyclonic storm, giving it the name Mukda. Three hours later, the agency estimated peak 3 minute winds of 100 km/h (60 mph). [7] By that time, Mukda had developed an eye-feature in the center of the convection, although it failed to organize further. [28]

The storm initially drifted toward Gujarat, bringing isolated heavy rainfall along the coastline; Upleta received 170 mm (6.7 in) during the storm's passage. However, Mukda steadily weakened while remaining nearly stationary. Late on September 24, the system degenerated into a remnant low. [7] The remnants turned westward, maintaining a distinct circulation and occasionally redeveloping thunderstorms, but failing to reorganize. [28]

Depression BOB 08

Depression (IMD)
Tropical storm (SSHWS)
Tropical Cyclone 05B 28 sept 2006 0725Z.jpg   Cyclone 05B 2006 track.png
DurationSeptember 28 – September 30
Peak intensity45 km/h (30 mph) (3-min) 1002  hPa  (mbar)

Tropical Cyclone 05B formed on September 28 approximately 250 nautical miles (460 km) south of Kolkata, India. It made landfall on September 29 near Gopalpur, Odisha before dissipating overland. Mahendragarh in Orissa received 170 mm of rainfall on 30 September. [29]

Cyclonic Storm Ogni

Cyclonic storm (IMD)
Tropical storm (SSHWS)
Ogni 2006-10-29 0515Z.jpg   Ogni 2006 track.png
DurationOctober 29 – October 30
Peak intensity65 km/h (40 mph) (3-min) 998  hPa  (mbar)

On October 27, an area of convection formed west of Sri Lanka, spawning a circulation in the Palk Strait on the next day. [30] With low to moderate wind shear, the system's convection organized and developed outflow. [30] Early on October 29, a depression developed just east of India's southeast coast. It quickly intensified while moving parallel to the coastline, becoming Cyclonic Storm Ogni later that day with peak 3 minute winds of 65 km/h (40 mph). [7] Conditions favored development, with the exception of proximity to land. The JTWC issued a Tropical Cyclone Formation Alert on October 29, and although at the time they did not classify the system, [30] the agency upgraded the system to Tropical Cyclone 06B in post-season analysis, estimating winds of 100 km/h (60 mph). [31] The convection organized around the center, [30] and developed banding features, although Ogni weakened slightly to deep depression status on October 30. Soon after, it moved ashore Andhra Pradesh between Bapatla and Ongole. Later that day, Ogni degenerated into a remnant low. [7]

A small system only 100 km (60 mi) in diameter, [7] Ogni was the smallest storm on record in the basin from 1891 to 2007. [32] The storm dropped heavy rainfall in southeastern India, peaking at 770 mm (30 in) in Avanigadda, Andhra Pradesh. About 900 villages were flooded in the state, with around 100,000 houses damaged or destroyed. [7] Thousands of residents rode out floods on the roofs of their houses [33] and 95,928 people had to evacuate to hundreds of emergency camps. The storm also disrupted power supplies and cut off roads. [34] Ogni's rainfall damaged 199,986 acres (80,931 ha) of crop fields and killed 361,553 farm animals. Throughout Andhra Pradesh, Ogni killed 24 people, [7] mostly on rice or shrimp farms. [33] Damage totaled ₹2.1 billion (INR, US$47 million). [7]

Other systems

A deep depression off the coast of Odisha in August BOB 03 2006-08-02 0735Z.jpg
A deep depression off the coast of Odisha in August

During August 2006, a series of depressions formed in the Bay of Bengal, [7] despite August typically being a climatologically quiet month.

The first originated out of an area of convection that persisted on August 1. A circulation exited from land into the northern portion of the bay, and despite high wind shear it developed into a depression on August 2 just 100 km (65 mi) offshore Chandabali. [35] The system moved west-southwestward and quickly intensified into a deep depression, reaching winds of 55 km/h (35 mph) according to the IMD. Early on August 3, the system moved ashore Odisha between Puri and Gopalpur. It progressed inland and weakened, degenerating into a remnant low-pressure area on August 5. [7]

About a week later, a low-pressure area formed on August 11 in the northern Bay of Bengal. By the next day, it organized into a depression, and quickly made landfall on Odisha near Balasore. The depression degenerated into a remnant low on August 13. [7]

Another depression developed on August 16 in the same region, moving ashore later that day near Chandabali. It moved northwestward due to a ridge to the north, weakening into a remnant low on August 18 over Madhya Pradesh. [7]

On August 29, the final of the four depressions formed near the Odisha coast, quickly moving ashore near Paradip. Like the preceding storm, it moved northwestward, dissipating on September 1 over Madhya Pradesh. [7]

The series of depressions produced heavy rainfall in Odisha and Andhra Pradesh. Notably high daily rainfall totals included 320 mm (13 in) on August 4 in Pottangi, 380 mm (15 in) on August 14 at a station in Madhya Pradesh, 240 mm (9.4 in) on August 19 in Ratlam, and 320 mm (13 in) at two stations in Odisha on August 30. Collectively, the depressions killed 387 people, with the first deep depression alone responsible for 251 fatalities. The deaths occurred in Odisha, Andhra Pradesh, Madhya Pradesh, Chhattisgarh, Vidarbha, and Marathawada. [7]

On December 6, the JTWC tracked the remnants of Typhoon Durian across Thailand into the Andaman Sea as a tropical depression. The system degenerated into a remnant low on the next day and continued across the Bay of Bengal, dissipating on December 9. [36] The IMD did not track the system. [7]

Season effects

This is a table of all storms in the 2006 North Indian Ocean cyclone season. It mentions all of the season's storms and their names, durations, peak intensities (according to the IMD storm scale), landfall(s) – denoted by areas in parentheses – damages, and death totals. Damage and death totals include the damage and deaths caused when that storm was a precursor wave or extratropical low, and all of the damage figures are in 2006 USD.

NameDatesPeak intensityAreas affectedDamage
(USD)
DeathsRefs
Category Wind speedPressure
ARB 01January 13–14Deep Depression55 km/h (35 mph)1,004 hPa (29.65 inHg) Kerala, Lakshadweep None0
Mala April 25–29Extremely Severe Cyclonic Storm185 km/h (115 mph)954 hPa (28.17 inHg) Andaman Islands, Myanmar (Rakhine State), Northern Thailand $6.7 million37
BOB 02July 2–5Deep Depression55 km/h (35 mph)982 hPa (29.00 inHg) East India (Odisha)Unknown133
BOB 03August 2–5Deep Depression55 km/h (35 mph)986 hPa (29.12 inHg)East India (Odisha)Unknown251
BOB 04August 12–13Depression45 km/h (30 mph)992 hPa (29.29 inHg)East India (Odisha)Unknown78
BOB 05August 16–18Depression45 km/h (30 mph)988 hPa (29.18 inHg)East India (Odisha)Unknown49
BOB 06August 29 – September 1Depression45 km/h (30 mph)990 hPa (29.23 inHg)East India (Odisha)Unknown9
BOB 07September 3–4Depression45 km/h (30 mph)992 hPa (29.29 inHg)East India (Odisha)Unknown0
Land 01September 21–24Depression45 km/h (30 mph)996 hPa (29.41 inHg)East India, Bangladesh Unknown98
MukdaSeptember 21–24Severe Cyclonic Storm100 km/h (60 mph)988 hPa (29.18 inHg) Gujarat Unknown0
BOB 08September 28–30Depression45 km/h (30 mph)1,002 hPa (29.59 inHg)East India (Odisha)Unknown0
OgniOctober 29–30Cyclonic Storm65 km/h (40 mph)998 hPa (29.47 inHg) South India (Andhra Pradesh), Sri Lanka $353 million35 [37] [38] [39]
Season aggregates
13 systemsJanuary 13 – December 7185 km/h (115 mph)954 hPa (28.17 inHg)>$360 million690

See also

Related Research Articles

<span class="mw-page-title-main">2005 North Indian Ocean cyclone season</span> Cyclone season in the North Indian ocean

The 2005 North Indian Ocean cyclone season caused much devastation and many deaths in Southern India despite the storms’ weakness. The basin covers the Indian Ocean north of the equator as well as inland areas, sub-divided by the Arabian Sea and the Bay of Bengal. Although the season began early with two systems in January, the bulk of activity was confined from September to December. The official India Meteorological Department tracked 12 depressions in the basin, and the unofficial Joint Typhoon Warning Center (JTWC) monitored two additional storms. Three systems intensified into a cyclonic storm, which have sustained winds of at least 63 km/h (39 mph), at which point the IMD named them.

<span class="mw-page-title-main">1992 North Indian Ocean cyclone season</span>

The 1992 North Indian Ocean cyclone season was unofficially the most active year on record for the basin, with 10 tropical storms developing, according to the Joint Typhoon Warning Center (JTWC). There are two main seas in the North Indian Ocean – the Bay of Bengal to the east of the Indian subcontinent – and the Arabian Sea to the west of India. The official Regional Specialized Meteorological Centre in this basin is the India Meteorological Department (IMD), while the JTWC releases unofficial advisories. An average of four to six storms form in the North Indian Ocean every season with peaks in May and November. Cyclones occurring between the meridians 45°E and 100°E are included in the season by the IMD.

<span class="mw-page-title-main">2004 North Indian Ocean cyclone season</span> North Indian Ocean tropical cyclone season

The 2004 North Indian Ocean cyclone season was the first in which tropical cyclones were officially named in the basin. Cyclone Onil, which struck India and Pakistan, was named in late September. The final storm, Cyclone Agni, was also named, and crossed into the southern hemisphere shortly before dissipation. This storm became notable during its origins and became one of the storms closest to the equator. The season was fairly active, with ten depressions forming from May to November. The India Meteorological Department designated four of these as cyclonic storms, which have maximum sustained winds of at least 65 km/h (40 mph) averaged over three minutes. The Joint Typhoon Warning Center also issued warnings for five of the storms on an unofficial basis.

<span class="mw-page-title-main">2003 North Indian Ocean cyclone season</span> North Indian Ocean tropical cyclone season

The 2003 North Indian Ocean cyclone season was the last season that tropical cyclones were not publicly labeled by India Meteorological Department (IMD). Also was mostly focused in the Bay of Bengal, where six of the seven depressions developed. The remaining system was a tropical cyclone that developed in the Arabian Sea in November, which was also the only system that did not affect land. There were three cyclonic storms, which was below the average of 4–6. Only one storm formed before the start of the monsoon season in June, although it was also the most notable. On May 10, a depression formed in the central Bay of Bengal, and within a few days became a very severe cyclonic storm. After it stalled, it drew moisture from the southwest to produce severe flooding across Sri Lanka, killing 254 people and becoming the worst floods there since 1947. Damage on the island totaled $135 million (2003 USD). The storm eventually made landfall in Myanmar on May 19. It is possible that the storm contributed to a deadly heat wave in India due to shifting air currents.

<span class="mw-page-title-main">2001 North Indian Ocean cyclone season</span> Cyclone season in the North Indian ocean

The 2001 North Indian Ocean cyclone season was fairly quiet, although activity was evenly spread between the Arabian Sea and the Bay of Bengal. There were six depressions tracked by the India Meteorological Department (IMD), which is the official Regional Specialized Meteorological Center for the northern Indian Ocean. The agency also tracked four cyclonic storms, which have maximum winds of at least 65 km/h (40 mph) sustained over 3 minutes. The American-based Joint Typhoon Warning Center (JTWC) tracked an additional storm – Tropical Storm Vamei – which crossed over from the South China Sea at a record-low latitude.

<span class="mw-page-title-main">2000 North Indian Ocean cyclone season</span> Cyclone season in the North Indian ocean

The 2000 North Indian Ocean cyclone season was fairly quiet compared to its predecessor, with all of the activity originating in the Bay of Bengal. The basin comprises the Indian Ocean north of the equator, with warnings issued by the India Meteorological Department (IMD) in New Delhi. There were six depressions throughout the year, of which five intensified into cyclonic storms – tropical cyclones with winds of 65 mph (105 km/h) sustained over 3 minutes. Two of the storms strengthened into a Very Severe Cyclonic Storm, which has winds of at least 120 km/h (75 mph), equivalent to a minimal hurricane. The Joint Typhoon Warning Center (JTWC) also tracked storms in the basin on an unofficial basis, estimating winds sustained over 1 minute.

<span class="mw-page-title-main">1995 North Indian Ocean cyclone season</span> Cyclone season 1995 in the North Indian ocean

The 1995 North Indian Ocean cyclone season was below-average and was primarily confined to the autumn months, with the exception of three short-lived deep depressions in May. There were eight depressions in the basin, which is Indian Ocean north of the equator. The basin is subdivided between the Bay of Bengal and the Arabian Sea on the east and west coasts of India, respectively. Storms were tracked by the India Meteorological Department (IMD), which is the basin's Regional Specialized Meteorological Center, as well as the American-based Joint Typhoon Warning Center (JTWC) on an unofficial basis.

<span class="mw-page-title-main">1996 North Indian Ocean cyclone season</span> Cyclone season in the North Indian Ocean in 1996

The 1996 North Indian Ocean cyclone season featured several deadly tropical cyclones, with over 2,000 people killed during the year. The India Meteorological Department (IMD) – the Regional Specialized Meteorological Center for the northern Indian Ocean as recognized by the World Meteorological Organization – issued warnings for nine tropical cyclones in the region. Storms were also tracked on an unofficial basis by the American-based Joint Typhoon Warning Center, which observed one additional storm. The basin is split between the Bay of Bengal off the east coast of India and the Arabian Sea off the west coast. During the year, the activity was affected by the monsoon season, with most storms forming in June or after October.

<span class="mw-page-title-main">1990 North Indian Ocean cyclone season</span>

The 1990 North Indian Ocean cyclone season featured a below average total of twelve cyclonic disturbances and one of the most intense tropical cyclones in the basin on record. During the season the systems were primarily monitored by the India Meteorological Department, while other warning centres such as the United States Joint Typhoon Warning Center also monitored the area. During the season, there were at least 1,577 deaths, while the systems caused over US$693 million in damages. The most significant system was the 1990 Andhra Pradesh cyclone, which was the most intense, damaging, and the deadliest system of the season.

<span class="mw-page-title-main">1993 North Indian Ocean cyclone season</span> Cyclone season in the North Indian Ocean in 1993

The 1993 North Indian Ocean cyclone season was the least active on record in the basin, with only four tropical disturbances. There are two main seas in the North Indian Ocean – the Bay of Bengal to the east of the Indian subcontinent and the Arabian Sea to the west. The India Meteorological Department (IMD) issued advisories for the systems in its official capacity as the local Regional Specialized Meteorological Center, while the Joint Typhoon Warning Center also issued advisories for two of the storms on an unofficial basis. Of the five disturbances tracked by the IMD, two intensified into cyclonic storms.

<span class="mw-page-title-main">1994 North Indian Ocean cyclone season</span>

The 1994 North Indian Ocean cyclone season was a below-average year in which eight tropical cyclones affected seven countries bordering the North Indian Ocean. The India Meteorological Department tracks all tropical cyclones in the basin, north of the equator. The first system developed on March 21 in the Bay of Bengal, the first March storm in the basin since 1938. The second storm was the most powerful cyclone of the season, attaining maximum sustained winds of 215 km/h (135 mph) in the northern Bay of Bengal. Making landfall near the border of Bangladesh and Myanmar, the cyclone killed 350 people and left US$125 million in damage.

<span class="mw-page-title-main">2013 North Indian Ocean cyclone season</span> North Indian Ocean tropical cyclone season

The 2013 North Indian Ocean cyclone season was an event in the annual cycle of tropical cyclone formation, in which tropical cyclones formed in the North Indian Ocean and Arabian Sea. The season had no official bounds, but cyclones typically formed between May and December, with the peak from October to November. These dates conventionally delimit the period of each year when most tropical cyclones form in the northern Indian Ocean.

<span class="mw-page-title-main">2014 North Indian Ocean cyclone season</span> North Indian Ocean tropical cyclone season

The 2014 North Indian Ocean cyclone season was an event in the annual cycle of tropical cyclone formation. The season included two very severe cyclonic storms, both in October, and one other named cyclonic storm, classified according to the tropical cyclone intensity scale of the India Meteorological Department. Cyclone Hudhud is estimated to have caused US$3.58 billion in damage across eastern India, and more than 120 deaths.

<span class="mw-page-title-main">2015 North Indian Ocean cyclone season</span> North Indian Ocean tropical cyclone season

The 2015 North Indian Ocean cyclone season was an event in the annual cycle of tropical cyclone formation. The North Indian Ocean cyclone season has no official bounds, but cyclones tend to form between months of April and December, with the peak from May to November. These dates conventionally delimit the period of each year when most tropical cyclones form in the northern Indian Ocean.

<span class="mw-page-title-main">2016 North Indian Ocean cyclone season</span> North Indian Ocean tropical cyclone season

The 2016 North Indian Ocean cyclone season was an event in the annual cycle of tropical cyclone formation. It was the deadliest season since 2010, killing more than 400 people. The season was an average one, seeing four named storms, with one further intensifying into a very severe cyclonic storm. The first named storm, Roanu, developed on 19 May while the season's last named storm, Vardah, dissipated on 18 December. The North Indian Ocean cyclone season has no official bounds, but cyclones tend to form between April and December, with the two peaks in May and November. These dates conventionally delimit the period of each year when most tropical cyclones form in the northern Indian Ocean.

<span class="mw-page-title-main">2017 North Indian Ocean cyclone season</span> North Indian Ocean tropical cyclone season

The 2017 North Indian Ocean cyclone season was a below average yet deadly season in the annual cycle of tropical cyclone formation. This season produced only three named storms, of which one only intensified into a very severe cyclonic storm. The North Indian Ocean cyclone season has no official bounds but cyclones tend to form between April and December with the two peaks in May and November. These dates conventionally delimit the period of each year when most tropical cyclones form in the northern Indian Ocean. The season began with the formation Cyclone Maarutha on April 15 and ended with the dissipation of a deep depression on December 9.

<span class="mw-page-title-main">2018 North Indian Ocean cyclone season</span> North Indian Ocean tropical cyclone season

The 2018 North Indian Ocean cyclone season was one of the most active North Indian Ocean cyclone seasons since 1992, with the formation of fourteen depressions and seven cyclones. The North Indian Ocean cyclone season has no official bounds, but cyclones tend to form between April and December, with the two peaks in May and November. These dates conventionally delimit the period of each year when most tropical cyclones form in the northern Indian Ocean.

<span class="mw-page-title-main">Cyclone Maarutha</span>

Cyclonic Storm Maarutha was the first tropical cyclone to make landfall in Myanmar in April. The first tropical cyclone and named storm of the 2017 North Indian Ocean cyclone season, Maarutha was a relatively short-lived and weak system, nonetheless causing notable damage in Myanmar. Maarutha formed from an area of low pressure over the southern Bay of Bengal on April 15. The next morning, RSMC New Delhi upgraded the low-pressure area to a Depression and designated it as BOB 01.

<span class="mw-page-title-main">2021 North Indian Ocean cyclone season</span> North Indian Ocean tropical cyclone season

The 2021 North Indian Ocean cyclone season was an event in the annual cycle of tropical cyclone formation. The North Indian Ocean cyclone season has no official bounds, but cyclones tend to form between April and December, peaking between May and November. These dates conventionally delimit the period of each year when most tropical cyclones form in the northern Indian Ocean. The season began on April 2, when a depression designated as BOB 01 was formed in the north Andaman Sea and quickly made landfall in Myanmar. The basin remained quiet for over a month before Cyclone Tauktae formed. It rapidly intensified into an extremely severe cyclonic storm before making landfall in Gujarat, become the strongest storm ever to strike that state since the 1998 Gujarat cyclone. Later that month, BOB 02 formed and later strengthened into Cyclone Yaas. Yaas rapidly intensified into a very severe cyclonic storm before making landfall in northwestern Odisha. The season's strongest tropical cyclone was Cyclone Tauktae, with maximum wind speeds of 185 km/h (115 mph) and a minimum barometric pressure of 950 hPa (28.05 inHg).

<span class="mw-page-title-main">2022 North Indian Ocean cyclone season</span> Tropical cyclone season

The 2022 North Indian Ocean cyclone season was an event in the annual cycle of tropical cyclone formation. It was an above-average season in terms of depressions and average in terms of deep depressions, but slightly below-average in terms of cyclonic storms. It was also the least deadly North Indian Ocean cyclone season since 1988, according to official data. The North Indian Ocean cyclone season has no official bounds, but cyclones tend to form between April and December, with the peak from May to November. These dates conventionally delimit the period of each year when most tropical cyclones form in the northern Indian Ocean.

References

  1. 1 2 3 4 Report on Cyclonic Disturbances Over North Indian Ocean During 2006 (PDF) (Report). India Meteorological Department. January 2007. Archived from the original (PDF) on April 12, 2013. Retrieved May 18, 2014.
  2. "Super Typhoon 24W (Durian) Best Track". Joint Typhoon Warning Center. United States Navy. 2007. Archived from the original (.TXT) on October 17, 2014. Retrieved May 18, 2014.
  3. 1 2 3 4 "Southwest Monsoon 2006 End-of-Season Report". India Meteorological Department. 2006. Archived from the original on July 11, 2010. Retrieved May 18, 2014.
  4. "Half a million homeless in India floods, Mumbai hit". ReliefWeb. Reuters. August 6, 2006. Retrieved May 18, 2014.
  5. "One million made homeless by floods in India – Concern responds". Concern Worldwide. ReliefWeb. September 6, 2006. Retrieved May 18, 2014.
  6. 1 2 3 Gary Padgett (2006). "Monthly Tropical Weather Summary for January 2006" . Retrieved 2015-07-23.
  7. 1 2 3 4 5 6 7 8 9 10 11 12 13 14 15 16 17 18 19 Report on Cyclonic Disturbances Over North Indian Ocean During 2006 (PDF) (Report). India Meteorological Department. 2007. Archived from the original (PDF) on 2013-04-12. Retrieved 2015-07-23.
  8. 1 2 Kenneth R. Knapp; Michael C. Kruk; David H. Levinson; Howard J. Diamond; Charles J. Neumann (2010). 2006 Missing (2006012N03081). The International Best Track Archive for Climate Stewardship (IBTrACS): Unifying tropical cyclone best track data (Report). Bulletin of the American Meteorological Society. Archived from the original on 2016-03-05. Retrieved 2015-07-23.
  9. 1 2 "Very severe cyclonic storm "Mala" over the Bay of Bengal 25–29 April 2006" (PDF). Report on Cyclonic Disturbances Over North Indian Ocean During 2006 (Report). India Meteorological Department. January 2007. pp. 22–26. Archived from the original (PDF) on 12 April 2013. Retrieved 19 May 2014.
  10. "Tropical Cyclone 02B (Mala) Best Track" (.TXT). Joint Typhoon Warning Center. United States Navy. 2007. Retrieved May 19, 2014.
  11. 1 2 Myanmar: Cyclone Mala Final Report for DREF Bulletin no. MDRMM01 (PDF). International Federation of Red Cross and Red Crescent Societies (Report). ReliefWeb. February 15, 2007. Retrieved May 6, 2014.
  12. "Cyclone Mala kills two in Burma". The Nation. Yangon, Myanmar. Associated Press. May 1, 2006. p. 4A. Retrieved May 6, 2014.
  13. "Myanmar: 2006 Progress Report" (PDF). International Federation of Red Cross And Red Crescent Societies. ReliefWeb. December 31, 2006. Retrieved May 8, 2014.
  14. Ministry of Social Welfare, Relief and Resettlement and the Ministry of Education (2008). "Natural Disasters in Myanmar". Guidance on Mainstreaming Disaster Risk Reduction in the Education Sector, Myanmar – Rural Settings (PDF). Myanmar Information Management Unit. p. 16. Retrieved May 7, 2014.
  15. Tint Zaw and Mu Mu Than (March 2010). "Climate Change Impacts to the Water Environment and Adaptation Options" (PDF). Union of Myanmar Ministry of Agriculture and Irrigation. Water Environment Partnership in Asia. p. 9. Retrieved May 7, 2014.
  16. "Myanmar: Cyclone Mala Information Bulletin No. 1". International Federation of Red Cross And Red Crescent Societies. ReliefWeb. May 3, 2006. Retrieved May 6, 2014.
  17. "Myanmar: Commander, Minister donate relief supplies to cyclone victims in Ayeyawady Division". Government of Myanmar. ReliefWeb. May 1, 2006. Retrieved May 6, 2014.
  18. "Myanmar: Relief provided to cyclone victims". Government of Myanmar. ReliefWeb. May 3, 2006. Retrieved May 6, 2014.
  19. 1 2 3 Gary Padgett and Kevin Boyle (October 3, 2006). "July 2006". Monthly Global Tropical Cyclone Summary (Report). Australia Severe Weather. Retrieved May 18, 2014.
  20. "Tropical Cyclone 03B Best Track" (.TXT). Joint Typhoon Warning Center. United States Navy. 2007. Retrieved May 18, 2014.
  21. 1 2 3 "Deep depression over Bay of Bengal July 2–5, 2006" (PDF). Report on Cyclonic Disturbances Over North Indian Ocean During 2006 (Report). India Meteorological Department. January 2007. pp. 27–33. Archived from the original (PDF) on April 12, 2013. Retrieved May 18, 2014.
  22. "Indian rains take heavy toll". Bombay, India. United Press International. July 6, 2006.  via Lexis Nexis (subscription required)
  23. "Monsoon rains cause flood, destruction in Gujarat". Hindustan Times. Bhavnagar, Gujarat. July 6, 2006.  via Lexis Nexis (subscription required)
  24. "Rains Claim 24 More Lives In India, Nationwide Toll Rises To 274". Qatar News Agency. Doha, Qatar. July 6, 2006.  via Lexis Nexis (subscription required)
  25. "Archived copy" (PDF). Archived from the original (PDF) on 2013-04-12. Retrieved 2013-12-15.{{cite web}}: CS1 maint: archived copy as title (link)
  26. "Final Report" (PDF). www.wmo.ch. Archived from the original (PDF) on March 27, 2009.
  27. "Archived copy" (PDF). Archived from the original (PDF) on 2013-04-12. Retrieved 2013-12-15.{{cite web}}: CS1 maint: archived copy as title (link)
  28. 1 2 3 4 Gary Padgett (2007). "Monthly Tropical Weather Summary for September 2006" . Retrieved 2015-07-24.
  29. "Archived copy" (PDF). Archived from the original (PDF) on 2013-04-12. Retrieved 2013-12-15.{{cite web}}: CS1 maint: archived copy as title (link)
  30. 1 2 3 4 Gary Padgett (2007). "Monthly Tropical Weather Summary for October 2006" . Retrieved 2015-07-24.
  31. Joint Typhoon Warning Center. Annual Tropical Cyclone Report (PDF) (Report). United States Navy. Retrieved 2015-07-24.
  32. "Frequently Asked Questions: Which are the largest and smallest tropical cyclones on record?". India Meteorological Department. 2013. Archived from the original on 2015-05-21. Retrieved 2015-07-24.
  33. 1 2 "Thousands Evacuated, 23 Dead as Storm Lashes India". ReliefWeb. Reuters. 2006-11-01. Retrieved 2015-07-24.
  34. "India: Situation Report Floods in Andhra Pradesh 03 Nov 2006". United Nations Development Programme. ReliefWeb. 2006-11-03. Retrieved 2015-07-24.
  35. Gary Padgett (2006). "Monthly Tropical Weather Summary for November 2006" . Retrieved 2015-07-31.
  36. "Best Track of Typhoon Durian (24W)". Joint Typhoon Warning Center. Archived from the original on 2016-03-04. Retrieved 2015-07-26.
  37. "Cyclonic storm "Ogni" over the Bay of Bengal October 29–30, 2006" (PDF). Report on Cyclonic Disturbances Over North Indian Ocean During 2006 (Report). India Meteorological Department. January 2007. pp. 78–83. Archived from the original (PDF) on April 12, 2013. Retrieved May 18, 2014.
  38. "'Ogni' crop damage runs up to 1,600 cr". The Hindu. November 8, 2006. Retrieved May 19, 2014.
  39. "35 killed in AP cyclone Ogni". CNN IBN. Associated Press. November 6, 2006. Archived from the original on May 19, 2014. Retrieved May 19, 2014.