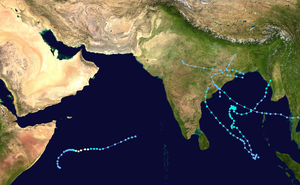
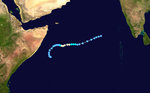
The 2003 North Indian Ocean cyclone season was the last season that tropical cyclones were not publicly labeled by India Meteorological Department (IMD). It was the third consecutive below average season. Also was mostly focused in the Bay of Bengal, where six of the seven depressionsdeveloped. The remaining system was a tropical cyclone that developed in the Arabian Sea in November, which was also the only system that did not affect land. There were three cyclonic storms, which was below the average of 4–6. Only one storm formed before the start of the monsoon season in June, although it was also the most notable. On May10, a depression formed in the central Bay of Bengal, and within a few days became a very severe cyclonic storm. After it stalled, it drew moisture from the southwest to produce severe flooding across Sri Lanka, killing 254people and becoming the worst floods there since 1947. Damage on the island totaled $135million (2003USD). The storm eventually made landfall in Myanmar on May19. It is possible that the storm contributed to a deadly heat wave in India due to shifting air currents.
In late July, a monsoon depression moved across much of India, and another monsoon disturbance persisted off the coast of Pakistan. The interaction between the two systems resulted in heavy rainfall across the region, flooding dozens of villages. Monsoonal rainfall killed 285people between Pakistan and India in the summer of 2003. In late August, another monsoon depression moved across northeastern India. A depression that struck Andhra Pradesh in India killed 21people in early October. Later that month, a tropical depression crossed Thailand from the western Pacific Ocean, contributing to ongoing flooding that killed 19. Once in the Indian Ocean, this system struck southeastern India without causing much damage. The last system of the year was a cyclonic storm that struck southeastern India in December, killing 81people and causing $28million in damage (2003USD).
Season summary
There were seven depressions throughout the season, of which three attained cyclonic storm status. One of the cyclonic storms formed before the start of the monsoon season, two depressions formed during the monsoon season from June to September, and the remaining systems formed after September.[1] The number of depressions was similar or greater than that of the previous three years.[2] However, the total of 3cyclonic storms was below the average of 5.4.[3]
In May2004, seven of the eight members of the World Meteorological Organization panel on tropical cyclones for the North Indian Ocean met in Colombo, Sri Lanka to review the season. During the meeting, the panel announced the first list of tropical cyclone names to be used in the basin for the following season. The panel noted the increasing frequency of deadly natural disasters in the region, such as the floods that affected Sri Lanka in May 2003 from a cyclone. One of the panel's goals was increased coordination between the countries in the region. The India Meteorological Department (IMD) in New Delhi served as the official Regional Specialized Meteorological Center,[2] although the Joint Typhoon Warning Center also issued warnings for the region in an unofficial capacity.[4] The IMD utilized satellite data from EUMETSAT to track cyclones, as well as radars from Bangladesh, Sri Lanka, and India.[2]
There were several other monsoon disturbances that affected various countries in the region, including Bangladesh, Pakistan, and Oman.[2] On July27, during the monsoon season, an area of convection exited from the coast of Pakistan. On the next day, the thunderstorms organized around the center, prompting the Pakistan Meteorological Department to classify the system as a monsoon depression. The IMD operationally classified the system as a depression on July29,[5] although it was dropped during the agency's annual report.[1] The system weakened into a remnant low on July30.[5] The system drew moisture from another depression that had moved across India from the Bay of Bengal, bringing three days of heavy rainfall to Karachi, Pakistan.[6]Badin in southeastern Pakistan recorded 292mm (11.5in) of rainfall in 24hours. The rainfall extended into northwestern India, and in Gujarat, a station received more than its annual rainfall during the deluge. Flooding from the heavy rainfall destroyed widespread crops and flooded dozens of villages, and ongoing rains persisted throughout the summer, killing 285people in the two countries.[7]
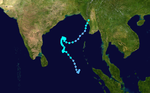
The first storm of the season originated from the monsoon trough, developing into a depression on May10 in the Bay of Bengal. Initially favorable conditions allowed the system to steadily intensify while moving northwestward, reaching peak maximum sustained winds of 140km/h (85mph) on May13. This made it a very severe cyclonic storm according to the IMD. The storm later drifted northward and later to the east in the central Bay of Bengal, although increased wind shear induced weakening into a deep depression. The system eventually began a steady northeast track, bringing it ashore in western Myanmar on May19 as a re-intensified cyclonic storm. It dissipated shortly thereafter over land, and was no longer observable on satellite imagery by May20.[1][8][9]
Early and later in its duration, the storm brought rainfall to the Andaman and Nicobar Islands.[1] Although the storm never passed within 700km (430mi) of the island,[10] the cyclone produced torrential rainfall across southwest Sri Lanka after it stalled in the central Bay of Bengal. The storm drew moisture from the southwest that coalesced in the mountainous portion of the island.[10] A station at Ratnapura recorded 366.1mm (14.41in) of rainfall in 18hours on May17, including 99.8mm (3.93in) in one hour. This followed a period of regular rainfall in the first 15days of May across the region.[11] The rains caused flooding and landslides in southwestern Sri Lanka that destroyed 24,750homes and damaged 32,426others,[12] leaving about 800,000people homeless.[13] Overall damage totaled about $29million (2003USD),[2] mostly to roads and buildings,[11] and there were 254deaths.[14] This made it the worst floods on the island since 1947.[15] The storm also drew moisture away from India, which possibly contributed to a heat wave that killed 1,200people,[1][16] and dropped heavy rainfall in Myanmar.[17]
A low pressure area persisted over the northern Bay of Bengal on July22, eventually organizing into a depression on July25 about 160km (99mi) south of Kolkata. Moving northwestward, the system quickly intensified into a deep depression,[1] with peak winds estimated at 55km/h (35mph). Late on July25, the system made landfall north of Balasore in Odisha state.[18] It progressed inland across India, weakening to depression status but remaining a distinct system. On July28, the depression degenerated into a remnant low over Rajasthan in northwestern India, later merging with a heat low. Rainfall associated with the system mostly occurred in the southwestern periphery, with a peak of 250mm (9.8in) at Kendrapara; there was little damage.[1] Rainfall also spread into Bangladesh.[2]
On August27, a low-pressure area organized into a depression about 230km (140mi) south of Kolkata. The system largely consisted of a circulation without much organized convection. It moved to the west-northwest and failed to intensify, moving ashore near Chandabali, Odisha on August28. Once over land, the depression stalled, before dissipating on August29. Rainfall from the storm peaked at 200mm (7.9in) at Kantamal in Odisha, and there were no reports of damage.[1] The system was largely connected with the monsoon, resulting in an increase in rainfall over northeastern India.[19]
A low-pressure area persisted on October4 in the western Bay of Bengal, off the east coast of Tamil Nadu. Two days later, the system organized into a depression and moved northward. Early on October7, the depression made landfall at Kalingapatnam, Andhra Pradesh. After moving slowly northwestward over land, the system turned to the northeast, degenerating into a remnant low on October10 over West Bengal.[1] The depression dropped heavy rainfall along its path, peaking at 380mm (15in) in Chandabali, Odisha. Kolkata received 267mm (10.5in), and rainfall spread as far northeast as Assam.[20] The rains caused widespread flooding across southeastern India, inundating 20villages and covering 16,000hectares (39,000acres) of rice paddies. A tornado spawned by the depression injured 11people and damaged several houses in Murshidabad. Across its track, the depression killed 13people in West Bengal and another eight in Andhra Pradesh.[1]
On October21, an area of convection formed in the Gulf of Thailand in the western Pacific Ocean. With low wind shear, the thunderstorms organized around the circulation, prompting the JTWC to initiate advisories on Tropical Depression 23W. While drifting northward, the system failed to organize further. Later, a ridge steered the depression to the west, bringing it ashore Thailand on October24 near Hua Hin District. The next day, the circulation entered the Bay of Bengal after weakening over land, passing near the Andaman and Nicobar Islands.[20] On October26, the IMD began classifying the system as a depression.[1] The convection gradually reorganized as the system turned to the northwest, prompting the JTWC to upgrade it to a minimal tropical storm on October27.[20] On the same day, the IMD upgraded it to deep depression status. The system made landfall between Visakhapatnam and Kalingapatnam in Andhra Pradesh on October28, and dissipated the next day.[1]
While crossing Thailand, the depression produced heavy rainfall reaching 127.7mm (5.03in) at Hua Hin over a 24‑hour period. Ongoing monsoonal flooding in the country forced thousands of people to evacuate their houses.[20] About 22,000cattle were killed, and large areas of farmlands were inundated. Officials opened the Kaeng Krajan Dam to prevent it from being destroyed by the floods.[7] Damage from the depression alone was estimated at ฿1billion baht ($25million 2003USD).[2] The monsoonal rains in October and November 2003 in the country killed 19people.[7] In India, the depression dropped locally heavy rainfall, reaching 120mm (4.7in) in Dummugudem. There was little damage in the country.[1]
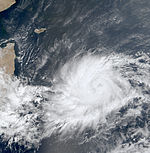
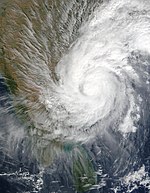
The lone system in the Arabian Sea in the season originated from a trough.[1] On November10, an area of convection formed off the western coast of India. With little wind shear, the system organized further as it moved west-southwestward due to a ridge to the north.[21] On November12, the system developed into a depression and quickly intensified into a deep depression.[1] That day, the JTWC classified the system as Tropical Cyclone 02A,[21] and it intensified into a cyclonic storm on November13.[1] The storm was located at an unusually low latitude of 6°N.[2] After an eye developed in the center of the convection, the JTWC upgraded the storm to the equivalent of a minimal hurricane,[21] estimating peak winds of 150km/h (95mph) on November14. By contrast, the IMD estimated peak winds of 100km/h (60mph),[22] making the system a severe cyclonic storm.[1] Subsequently, drier air weakened the storm, causing the convection to decrease.[21] By November15, the storm had weakened to depression status while approaching Somalia.[1] That day, the JTWC discontinued advisories while the storm was about 520km (320mi) east of the Somalia coastline.[21] On November16, the depression degenerated into a remnant low, and subsequently dissipated.[1]
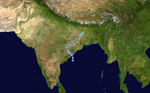
On December10, an area of convection with an associated circulation persisted about 740km (460mi) west of the northern tip of Sumatra, as part of a trough in the region and enhanced by the monsoon. A steady decline in the wind shear allowed the thunderstorms to organize,[23] and a depression formed on December11.[1] On the next day, the JTWC initiated advisories on Tropical Cyclone 03B. The storm moved generally northwestward, steered by a ridge to the north.[23] The IMD upgraded the system to a deep depression and later cyclonic storm on December13, and further to a severe cyclonic storm a day later. The agency estimated peak winds of 100km/h (60mph), noting spiral convection organizing around the beginnings of an eye feature.[1] The storm also developed well-defined outflow due to an approaching trough from the west. At around 14:30UTC on December15, the storm made landfall near False Divi Point in southeastern India,[23] along the coast of Andhra Pradesh. After turning to the northeast over land, the system rapidly weakened, degenerating into a remnant low on December16.[1]
Before the storm made landfall, officials evacuated about 20,000people.[24] As the storm moved ashore in India, it produced heavy rainfall that reached 190mm (7.5in) at Repalle, Andhra Pradesh. Light rains fell in neighboring Tamil Nadu. The rains deluged 61,898.5ha (152,955 acres) of fields in Andhra Pradesh. The storm damaged or destroyed 9,090houses,[1] and downed several trees and power lines. Local news reports indicated that the storm produced 10m (33ft) waves as it moved ashore,[23] which damaged a ship and forced its crew to be rescued by the Indian Coast Guard.[1] In Andhra Pradesh, the storm killed 83people and resulted in $28million (2003USD) in damage.[1][25] After the storm, the government provided ₹50,000 rupees (US$1,111) to the family of every storm victim.[24]
1 2 3 4 5 6 7 8 Thirty-First Session Final Report(PDF) (Report). WMO/ESCAP Panel on Tropical Cyclones. United Nations Office for Disaster Risk Reduction. 2004. Archived(PDF) from the original on 2012-08-05. Retrieved 2014-05-03.
↑ Kenneth R. Knapp; Michael C. Kruk; David H. Levinson; Howard J. Diamond; Charles J. Neumann (2010). 2003 Missing (2003129N05091). The International Best Track Archive for Climate Stewardship (IBTrACS): Unifying tropical cyclone best track data (Report). Bulletin of the American Meteorological Society. Archived from the original on 2016-03-05. Retrieved 2014-04-20.
1 2 Lareef Zubair; Upamala Tcnnakonc; Zcenas Yahiya; Janaki Chandimala; M.R.A. Siraj. "What led to the May 2003 Floods?"(PDF). Journal of the Institute of Engineers, Sri Lanka. 36 (3): 51–52. Archived from the original(PDF) on 2014-05-08. Retrieved 2014-04-21.
1 2 Junichi Yoshitani; Norimichi Takemoto; Tarek Merabtene (2007). Factor Analysis of Water-related Disasters in Sri Lanka(PDF). The International Centre for Water Hazard and Risk Management (Report). Public Works Research Institute. pp.52, 57, 59–61, 67, 103, 111. ISSN0386-5878. Retrieved 2014-04-28.
↑ Kenneth R. Knapp; Michael C. Kruk; David H. Levinson; Howard J. Diamond; Charles J. Neumann (2010). 2003 Missing (2003129N05091). The International Best Track Archive for Climate Stewardship (IBTrACS): Unifying tropical cyclone best track data (Report). Bulletin of the American Meteorological Society. Archived from the original on 2016-03-05. Retrieved 2014-05-01.
This page is based on this Wikipedia article Text is available under the CC BY-SA 4.0 license; additional terms may apply. Images, videos and audio are available under their respective licenses.