Maximum sustained wind

Last updated
Saffir–Simpson scale, 1-minute maximum sustained winds
Category m/s knots mph km/h
5≥ 70 ≥ 137≥ 157≥ 252
458–70113–136130–156209–251
350–5896–112111–129178–208
243–4983–9596–110154–177
133–4264–8274–95119–153
TS18–3234–6339–7363–118
TD≤ 17≤ 33≤ 38≤ 62

The maximum sustained wind associated with a tropical cyclone is a common indicator of the intensity of the storm. Within a mature tropical cyclone, it is found within the eyewall at a distance defined as the radius of maximum wind, or RMW. Unlike gusts, the value of these winds are determined via their sampling and averaging the sampled results over a period of time. Wind measuring has been standardized globally to reflect the winds at 10 metres (33 ft) above mean sea level, [nb 1] and the maximum sustained wind represents the highest average wind over either a one-minute (US) or ten-minute time span (see the definition, below), anywhere within the tropical cyclone. Surface winds are highly variable due to friction between the atmosphere and the Earth's surface, as well as near hills and mountains over land.

Contents

Over the ocean, satellite imagery determines the value of the maximum sustained winds within a tropical cyclone. Land, ship, aircraft reconnaissance observations, and radar imagery can also estimate this quantity, when available. This value helps determine damage expected from a tropical cyclone, through use of such scales as the Saffir–Simpson scale.

Definition

The maximum sustained wind normally occurs at a distance from the center known as the radius of maximum wind, within a mature tropical cyclone's eyewall, before winds decrease at farther distances away from a tropical cyclone's center. [2] Most weather agencies use the definition for sustained winds recommended by the World Meteorological Organization (WMO), which specifies measuring winds at a height of 10 metres (33 ft) for 10 minutes, and then taking the average. However, the United States National Weather Service defines sustained winds within tropical cyclones by averaging winds over a period of one minute, measured at the same 10 metres (33 ft) height. [3] This is an important distinction, as the value of the highest one-minute sustained wind is about 14% greater than a ten-minute sustained wind over the same period. [4]

Determination of value

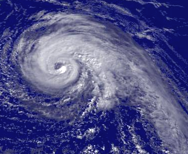
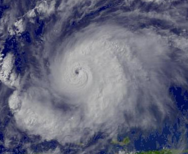
In most tropical cyclone basins, use of the satellite-based Dvorak technique is the primary method used to determine a tropical cyclone's maximum sustained winds. [5] The extent of spiral banding and difference in temperature between the eye and eyewall is used within the technique to assign a maximum sustained wind and pressure. [6] Central pressure values for their centers of low pressure are approximate. The intensity of example hurricanes is derived from both the time of landfall and the maximum intensity. [7] The tracking of individual clouds on minutely satellite imagery could be used in the future in estimating surface winds speeds for tropical cyclones. [8]

Ship and land observations are also used, when available. In the Atlantic as well as the Central and Eastern Pacific basins, reconnaissance aircraft are still utilized to fly through tropical cyclones to determine flight level winds, which can then be adjusted to provide a fairly reliable estimate of maximum sustained winds. A reduction of 10 percent of the winds sampled at flight level is used to estimate the maximum sustained winds near the surface, which has been determined during the past decade through the use of GPS dropwindsondes. [9] Doppler weather radar can be used in the same manner to determine surface winds with tropical cyclones near land. [10]

Satellite Images of Selected Tropical Cyclones and Associated T-Number from Dvorak technique
Wilma-17-1315z-T30-discussion1500z.png Dennis-06-1445z-T40-discussion1500z.png Jeanne-22-1945z-T50-discussion2100z.png Emily-14-1915z-T60-discussion15-0300z.png
Tropical Storm Wilma at T3.0 Tropical Storm Dennis at T4.0 Hurricane Jeanne at T5.0 Hurricane Emily at T6.0

Variation

Friction between the atmosphere and the Earth's surface causes a 20% reduction in the wind at the surface of the Earth. [11] Surface roughness also leads to significant variation of wind speeds. Over land, winds maximize at hill or mountain crests, while sheltering leads to lower wind speeds in valleys and lee slopes. [12] Compared to over water, maximum sustained winds over land average 8% lower. [13] More especially, over a city or rough terrain, the wind gradient effect could cause a reduction of 40% to 50% of the geostrophic wind speed aloft; while over open water or ice, the reduction is between 10% and 30%. [9] [14] [15]

Relationship to tropical cyclone strength scales

In most basins, maximum sustained winds are used to define their category. In the Atlantic and northeast Pacific oceans, the Saffir–Simpson scale is used. This scale can be used to determine possible storm surge and damage impact on land. In most basins, the category of the tropical cyclone (for example, tropical depression, tropical storm, hurricane/typhoon, super typhoon, depression, deep depression, intense tropical cyclone) is determined from the cyclone's maximum sustained wind over one minute. Only in Australia is this quantity not used to define the tropical cyclone's category; in that basin, maximum sustained wind speed is measured over 10 minutes.

Notes

  1. The Saffir–Simpson scale uses an elevation of 10 m (33 ft) above mean sea level. [1]

Related Research Articles

The Saffir–Simpson hurricane wind scale (SSHWS) classifies hurricanes—which in the Western Hemisphere are tropical cyclones that exceed the intensities of tropical depressions and tropical storms—into five categories distinguished by the intensities of their sustained winds. This measuring system was formerly known as the Saffir–Simpson hurricane scale, or SSHS.

<span class="mw-page-title-main">Rainband</span> Cloud and precipitation structure

A rainband is a cloud and precipitation structure associated with an area of rainfall which is significantly elongated. Rainbands can be stratiform or convective, and are generated by differences in temperature. When noted on weather radar imagery, this precipitation elongation is referred to as banded structure. Rainbands within tropical cyclones are curved in orientation. Rainbands of tropical cyclones contain showers and thunderstorms that, together with the eyewall and the eye, constitute a hurricane or tropical storm. The extent of rainbands around a tropical cyclone can help determine the cyclone's intensity.

<span class="mw-page-title-main">Tropical cyclone scales</span> Scales of the intensity of tropical cyclones

Tropical cyclones are ranked on one of five tropical cyclone intensity scales, according to their maximum sustained winds and which tropical cyclone basins they are located in. Only a few scales of classifications are used officially by the meteorological agencies monitoring the tropical cyclones, but other scales also exist, such as accumulated cyclone energy, the Power Dissipation Index, the Integrated Kinetic Energy Index, and the Hurricane Severity Index.

<span class="mw-page-title-main">Eye (cyclone)</span> Central area of calm weather in a tropical cyclone

The eye is a region of mostly calm weather at the center of a tropical cyclone. The eye of a storm is a roughly circular area, typically 30–65 kilometers in diameter. It is surrounded by the eyewall, a ring of towering thunderstorms where the most severe weather and highest winds of the cyclone occur. The cyclone's lowest barometric pressure occurs in the eye and can be as much as 15 percent lower than the pressure outside the storm.

<span class="mw-page-title-main">Dvorak technique</span> Subjective technique to estimate tropical cyclone intensity

The Dvorak technique is a widely used system to estimate tropical cyclone intensity based solely on visible and infrared satellite images. Within the Dvorak satellite strength estimate for tropical cyclones, there are several visual patterns that a cyclone may take on which define the upper and lower bounds on its intensity. The primary patterns used are curved band pattern (T1.0-T4.5), shear pattern (T1.5–T3.5), central dense overcast (CDO) pattern (T2.5–T5.0), central cold cover (CCC) pattern, banding eye pattern (T4.0–T4.5), and eye pattern (T4.5–T8.0).

<span class="mw-page-title-main">Central dense overcast</span> Large central area of thunderstorms surrounding its circulation center

The central dense overcast, or CDO, of a tropical cyclone or strong subtropical cyclone is the large central area of thunderstorms surrounding its circulation center, caused by the formation of its eyewall. It can be round, angular, oval, or irregular in shape. This feature shows up in tropical cyclones of tropical storm or hurricane strength. How far the center is embedded within the CDO, and the temperature difference between the cloud tops within the CDO and the cyclone's eye, can help determine a tropical cyclone's intensity with the Dvorak technique. Locating the center within the CDO can be a problem with strong tropical storms and minimal hurricanes as its location can be obscured by the CDO's high cloud canopy. This center location problem can be resolved through the use of microwave satellite imagery.

<span class="mw-page-title-main">Tropical cyclone windspeed climatology</span>

Tropical cyclone windspeed climatology is the study of wind distribution among tropical cyclones, a significant threat to land and people. Since records began in 1851, winds from hurricanes, typhoons and cyclones have been responsible for fatalities and damage in every basin. Major hurricanes usually cause the most wind damage. Hurricane Andrew for example caused $45 billion(2005 USD) in damage, most of it wind damage.

<span class="mw-page-title-main">Tropical cyclone observation</span>

Tropical cyclone observation has been carried out over the past couple of centuries in various ways. The passage of typhoons, hurricanes, as well as other tropical cyclones have been detected by word of mouth from sailors recently coming to port or by radio transmissions from ships at sea, from sediment deposits in near shore estuaries, to the wiping out of cities near the coastline. Since World War II, advances in technology have included using planes to survey the ocean basins, satellites to monitor the world's oceans from outer space using a variety of methods, radars to monitor their progress near the coastline, and recently the introduction of unmanned aerial vehicles to penetrate storms. Recent studies have concentrated on studying hurricane impacts lying within rocks or near shore lake sediments, which are branches of a new field known as paleotempestology. This article details the various methods employed in the creation of the hurricane database, as well as reconstructions necessary for reanalysis of past storms used in projects such as the Atlantic hurricane reanalysis.

<span class="mw-page-title-main">Hurricane Adolph</span> Category 4 Pacific hurricane in 2001

Hurricane Adolph was the first and one of only two East Pacific hurricanes in May to reach Category 4 strength on the Saffir-Simpson Hurricane Scale since record keeping began in the East Pacific, with the other being Amanda of 2014. Adolph was the first depression of the season, forming on May 25; it became a hurricane three days later. After rapidly intensifying, Adolph became the most powerful storm in terms of maximum sustained winds this season, along with Hurricane Juliette. The storm briefly threatened land before dissipating on June 1, after moving over colder waters.

<span class="mw-page-title-main">Hurricane Guillermo (1997)</span> Category 5 Pacific hurricane in 1997

Hurricane Guillermo was the ninth-most intense Pacific hurricane on record, attaining peak winds of 160 mph (260 km/h) and a barometric pressure of 919 hPa (27.14 inHg). Forming out of a tropical wave on July 30, 1997, roughly 345 mi (555 km) south of Salina Cruz, Mexico, Guillermo tracked in a steady west-northwestward direction while intensifying. The system reached hurricane status by August 1 before undergoing rapid intensification the following day. At the end of this phase, the storm attained its peak intensity as a powerful Category 5 hurricane. The storm began to weaken during the afternoon of August 5 and was downgraded to a tropical storm on August 8. Once entering the Central Pacific Hurricane Center's area of responsibility, Guillermo briefly weakened to a tropical depression before re-attaining tropical storm status. On August 15, the storm reached an unusually high latitude of 41.8°N before transitioning into an extratropical cyclone. The remnants persisted for more than a week as they tracked towards the northeast and later south and east before being absorbed by a larger extratropical system off the coast of California on August 24.

<span class="mw-page-title-main">Hurricane Fausto (2002)</span> Category 4 Pacific hurricane in 2002

Hurricane Fausto was a long-lived tropical cyclone that formed during the 2002 Pacific hurricane season, and later regenerated at an unusually high latitude over the north-central Pacific Ocean. Fausto was the eighth tropical cyclone, sixth named storm, fourth hurricane, and third major hurricane of the annual season. The storm developed on August 21 from a tropical wave that had crossed the Atlantic, and entered the Pacific on August 17. Becoming a tropical depression, the system intensified, and quickly became Tropical Storm Fausto early on August 22. Fausto rapidly intensified, and was already a hurricane on that same day as becoming a tropical storm. Rapid intensification continued, and the tropical cyclone ultimately peaked as a strong Category 4 hurricane on the Saffir–Simpson hurricane scale. At that time, the winds 145 mph (233 km/h). Fausto began to gradually weaken after attaining peak intensity on August 24, and was eventually downgraded to a tropical storm two days later. Weakening continued, and Fausto degenerated into a remnant low on August 28 while well northeast of Hawaii.

<span class="mw-page-title-main">Hurricane Norbert (2008)</span> Category 4 Pacific hurricane in 2008

Hurricane Norbert is tied with Hurricane Jimena as the strongest tropical cyclone to strike the west coast of Baja California Sur in recorded history. The fifteenth named storm, seventh hurricane, and second major hurricane of the 2008 hurricane season, Norbert originated as a tropical depression from a tropical wave south of Acapulco on October 3. Strong wind shear initially prevented much development, but the cyclone encountered a more favorable environment as it moved westward. On October 5, the National Hurricane Center (NHC) upgraded the depression to Tropical Storm Norbert, and the system intensified further to attain hurricane intensity by October 6. After undergoing a period of rapid deepening, Norbert reached its peak intensity as a Category 4 on the Saffir–Simpson hurricane wind scale, with maximum sustained winds of 135 mph (217 km/h) and a minimum barometric pressure of 945 mbar. As the cyclone rounded the western periphery of a subtropical ridge over Mexico, it began an eyewall replacement cycle which led to steady weakening. Completing this cycle and briefly reintensifying into a major hurricane, a Category 3 or higher on the Saffir–Simpson hurricane wind scale, Norbert moved ashore Baja California Sur as a Category 2 hurricane late on October 11. After a second landfall at a weaker intensity the following day, the system quickly weakened over land and dissipated that afternoon.

<span class="mw-page-title-main">Meteorological history of Hurricane Andrew</span>

The meteorological history of Hurricane Andrew, the strongest tropical cyclone of the 1992 Atlantic hurricane season, lasted from mid to late August 1992. The hurricane developed from a tropical wave that moved off the coast of Africa on August 14. Tracking westward due to a ridge, favorable conditions allowed it to develop into Tropical Depression Three on August 16 in the deep tropical Atlantic Ocean. The cyclone gradually intensified, becoming a tropical storm on August 17. However, wind shear soon impacted the storm, causing significant increases in barometric pressure and nearly destroying its low-level circulation by August 20. Wind shear sharply decreased starting on August 21, and with warm sea surface temperatures, Andrew began rapid deepening, starting on the following day. By August 23, Andrew peaked as a Category 5 hurricane on the Saffir–Simpson hurricane wind scale while approaching The Bahamas.

<span class="mw-page-title-main">Glossary of tropical cyclone terms</span>

The following is a glossary of tropical cyclone terms.

<span class="mw-page-title-main">1984–85 South Pacific cyclone season</span> Tropical cyclone season

The 1984–85 South Pacific cyclone season was an above-average tropical cyclone season, with nine tropical cyclones occurring within the basin between 160°E and 120°W. The season ran from November 1, 1984, to April 30, 1985, with tropical cyclones officially monitored by the Fiji Meteorological Service (FMS), Australian Bureau of Meteorology (BoM) and New Zealand's MetService. The United States Joint Typhoon Warning Center (JTWC) and other national meteorological services including Météo-France and NOAA also monitored the basin during the season. During the season there was nine tropical cyclones occurring within the basin, including three that moved into the basin from the Australian region. The BoM, MetService and RSMC Nadi all estimated sustained wind speeds over a period of 10-minutes, which are subsequently compared to the Australian tropical cyclone intensity scale, while the JTWC estimated sustained winds over a 1-minute period, which are subsequently compared to the Saffir–Simpson hurricane wind scale (SSHWS).

<span class="mw-page-title-main">Cyclone Ernie</span> Category 5 Australian region cyclone in 2017

Severe Tropical Cyclone Ernie was one of the quickest strengthening tropical cyclones on record. Ernie was the first Category 5 severe tropical cyclone in the Australian region since Cyclone Marcia in 2015, and also the strongest tropical cyclone in the Australian region since Cyclone Ita in 2014. Ernie developed from a tropical low into a cyclone south of Indonesia in the northeast Indian Ocean on 6 April 2017, and proceeded to intensify extremely rapidly to a Category 5 severe tropical cyclone. A few days later, on 10 April, the system was downgraded below cyclone intensity following a period of rapid weakening, located southwest of its original position. Ernie had no known impacts on any land areas.

<span class="mw-page-title-main">Tropical cyclones in 2013</span>

Throughout 2013, 139 tropical cyclones formed in seven different areas called basins. Of these, 67 have been named by various weather agencies when they attained maximum sustained winds of 35 knots. The strongest and deadliest tropical cyclone of the year was Typhoon Haiyan, which was estimated to have a minimum barometric pressure of 895 hPa (26.43 inHg) and caused at least 6,300 deaths in the Philippines. The costliest tropical cyclone of the year was Hurricane Manuel, which was responsible for at least $4.2 billion worth of damages in Mexico. 21 major tropical cyclones formed in 2013, including five Category 5 tropical cyclones. The accumulated cyclone energy (ACE) index for the 2013, as calculated by Colorado State University was 618.5 units.

References

  1. Simiu, Emil; Vickery, Peter; Kareem, Ahsan (July 2007). "Relation Between Saffir-Simpson Hurricane Scale Wind Speeds and Peak 3-s Gust Speeds Over Open Terrain". Journal of Structural Engineering . Technical Notes. Reston, Virginia. 133 (7): 1043. doi: 10.1061/(ASCE)0733-9445(2007)133:7(1043) .
  2. Brian W. Blanchard and S. A. Hsu. ON THE RADIAL VARIATION OF THE TANGENTIAL WIND SPEED OUTSIDE THE RADIUS OF MAXIMUM WIND DURING HURRICANE WILMA (2005). Archived 2012-09-05 at the Wayback Machine Retrieved on 2008-07-04.
  3. Tropical Cyclone Weather Services Program (June 1, 2006). "Tropical cyclone definitions" (PDF). National Weather Service . Retrieved 2006-11-30.
  4. United States Navy: "SECTION 2. INTENSITY OBSERVATION AND FORECAST ERRORS". Archived from the original on 2007-09-16. Retrieved 2008-07-04.{{cite web}}: CS1 maint: bot: original URL status unknown (link) Retrieved on 2018-10-07.
  5. "Objective Dvorak Technique". University of Wisconsin–Madison . Retrieved 2006-05-29.
  6. Chris Landsea (June 8, 2010). Subject: H1) What is the Dvorak technique and how is it used? Atlantic Oceanographic and Meteorological Laboratory. Retrieved on 2011-01-14.
  7. National Hurricane Center (June 22, 2006). "Saffir-Simpson Hurricane Scale Information". National Oceanic and Atmospheric Administration . Retrieved 2007-02-25.
  8. A. F. Hasler, K. Palaniappan, C. Kambhammetu, P. Black, E. Uhlhorn, and D. Chesters. High-Resolution Wind Fields within the Inner Core and Eye of a Mature Tropical Cyclone from GOES 1-min Images. Retrieved on 2008-07-04.
  9. 1 2 Franklin, James L., Michael L. Black, and Krystal Valde. GPS dropwindsonde wind profiles in hurricanes and their operational implications. Retrieved on 2008-07-04.
  10. J. TUTTLE and R. GALL. A single-radar technique for estimating the winds in tropical cyclones. Retrieved on 2008-06-12.
  11. Haby, Jeff. "The Importance of Friction". theweatherprediction.com.
  12. Mapping of Topographic Effects on Maximum Sustained Surface Wind Speeds in Landfalling Hurricanes. Retrieved on 2008-07-04.
  13. Peter Black. Subject: Re: Offshore vs nearshore sonde composite. Retrieved on 2008-07-04.
  14. Harrison, Roy (1999). Understanding Our Environment . Cambridge: Royal Society of Chemistry. pp.  11. ISBN   0-85404-584-8.
  15. Thompson, Russell (1998). Atmospheric Processes and Systems . New York: Routledge. pp.  102–103. ISBN   0-415-17145-8.