Atlantic tropical storm and hurricane frequency, by month
The Atlantic hurricane season is the period in a year, from June 1 to November 30, when tropical or subtropical cyclones are most likely to form in the North Atlantic Ocean. These dates, adopted by convention, encompass the period in each year when most tropical cyclogenesis occurs in the basin. Even so, subtropical or tropical cyclogenesis is possible at any time of the year, and often does occur.[2]
Worldwide, a season's climatological peak activity takes place in late summer, when the difference between air temperature and sea surface temperatures is the greatest. Peak activity in an Atlantic hurricane season happens from late August to September, with a midpoint on September 10.[3][4]
Atlantic tropical and subtropical cyclones that reach tropical storm intensity are named from a predetermined list. On average, 14 named storms occur each season, with an average of 7 becoming hurricanes and 3 becoming major hurricanes, Category 3 or higher on the Saffir–Simpson scale. The most active season on record was 2020, with 30 named tropical cyclones formed through the season. Despite this, the 2005 season had more hurricanes, developing a record of 15 such storms. The least active season was 1914, with only one known tropical cyclone developing during that year.[5]
The timing of the hurricane season was an important factor for maritime trade and naval activities.
The understanding that Atlantic hurricanes are most commonplace during a certain period of the year has been long recognized. Historical delineations of the Atlantic hurricane season varied but generally covered some part of the estival (summer) and autumnal months.[6] Some early descriptions of the season's bounds theorized that the timing of the full moon or the moon's phases as a whole could be used to more precisely delineate the hurricane season.[6][7] In the second volume of Voyages and Descriptions (published in 1700), English explorer and naturalist William Dampier observed that hurricanes in the Caribbean Sea were expected in July, August, and September.[8] Mariners in the 18th century generally regarded the period from July to the end of October as the "hurricane season" based on the frequency of storms striking the Caribbean islands and the trajectories of ships traversing the Atlantic.[7][9]
The hurricane season was also an important influence on European naval operations within the West Indies, forcing the movement of materiel to be expedited before its onset or delayed until its end.[10][11][12] English admiral Edward Vernon described the "hurricane months" of August and September within the West Indies as a particularly vulnerable time for maritime logistics; Vernon argued that the most optimal time for a fleet to be dispatched from Great Britain to attack Spanish assets in the Americas was August or September, in part because such ships would more likely avoid hurricanes by the time they reached the West Indies.[13]
American geographer Jedidiah Morse defined the hurricane season as the months of August, September, and October in his treatise The American Universal Geography.[14] American meteorologist William Charles Redfield defined the hurricane season as lasting from July15 to October15, citing the timeframe during which some insurance underwriters raised premiums in response to the increased likelihood of hurricanes.[6][15] Based on a catalog of 355storms between 1493–1855 in the North Atlantic compiled by M. André Poëy, W. H. Rosser described the months of July, August, September, and October as comprising the "true hurricane season of the West Indies" in his 1876book The Law of Storms Considered Practically.[16]
Still, the hurricane season will not allow itself to be 'cribbed, cabined and confined' within the limits of three short months, and skips along whenever its blithe fancy takes it, having a way of turning up at the most unexpected seasons...
In the early 1900s, the hurricane season served as the time in which U.S. Weather Bureau observations in the Caribbean were taken more frequently.
The concept of the hurricane season took on a more practical significance in forecasting operations as the United States Weather Bureau began to extend its weather prediction efforts and data collection into the tropics. In 1882, the bureau briefly considered an effort to adopt special hurricane signals between July and October20 to emphasize the danger of such storms during that period, but dropped the effort due to a lack of funding.[17] When the U.S. Weather Bureau built a network of weather observatories in the Caribbean in 1898, these sites telegraphed weather observations at 8a.m. daily to the bureau's regional headquarters in Havana, Cuba, during the hurricane season; this season was defined as lasting from the beginning of June through October.[18][19][20]
By 1907, these stations in the West Indies operated within a hurricane season defined as beginning on June15 and ending on November15.[21] The starting date of these regular reports was moved back to June1 by 1915.[22] In 1917, an increase in funding for the U.S. Weather Bureau's observing networks in the Caribbean region led to these stations reporting twice daily during a hurricane season expanded to cover the June1 to November30 period.[23][24] This delineation was maintained when the bureau, in cooperation with United Fruit Company, began to broadcast special weather bulletins for Caribbean shipping during the hurricane season in 1922, providing information on active hurricanes and warnings twice daily.[25]
The basic concept of an official hurricane season began during 1935,[26] when dedicated wire circuits known as hurricane circuits began to be set up along the Gulf and Atlantic coasts,[27] a process completed by 1955.[28] It was originally the time frame when the tropics were monitored routinely for tropical cyclone activity, and was originally defined as from June 15 through October 31.[29] Over the years, the beginning date was shifted back to June 1, while the end date was shifted to November 15,[27] before settling at November 30 by 1965.[30][31] This was when hurricane reconnaissance planes were sent out to fly across the Atlantic and Gulf of Mexico on a routine basis to look for potential tropical cyclones, in the years before the continuous weather satellite era.[29]
Since regular satellite surveillance began, hurricane hunter aircraft fly only into storm areas which are first spotted by satellite imagery.[32] The six-month official hurricane season established in 1965 by the National Hurricane Center (NHC) remains the current delineation of the Atlantic hurricane season.[33] These bounds contain over 97percent of Atlantic tropical cyclone activity. While this definition was chosen in part to make it easier for the public to remember the timing of hurricanes, storms have often formed outside the official seasonal bounds.[34][35]
Following several consecutive years of Atlantic tropical cyclones developing before the official June1 start date, the World Meteorological Organization recommended in 2021 that the NHC assess moving the start date to May15.[36] In response, the NHC formed a team to develop quantiative criteria to evaluate extending the seasonal bounds.[37][38] The agency's routine tropical weather outlooks, historically issued during the hurricane season beginning on June1, were instead started on May15 beginning in 2021.[39]
During the hurricane season, the National Hurricane Center routinely issues their Tropical Weather Outlook product, which identifies areas of concern within the tropics which could develop into tropical cyclones. If systems occur outside the defined hurricane season, special Tropical Weather Outlooks will be issued.[40] Routine coordination occurs at 1700 UTC each day between the Weather Prediction Center and National Hurricane Center to identify systems for the pressure maps three to seven days into the future within the tropics, and points for existing tropical cyclones six to seven days into the future.[41] Possible tropical cyclones are depicted with a closed isobar, while systems with less certainty to develop are depicted as "spot lows" with no isobar surrounding them.
The North Atlantic hurricane database, or HURDAT, is the database for all tropical storms and hurricanes for the Atlantic Ocean, Gulf of Mexico and Caribbean Sea, including those that have made landfall in the United States. The original database of six-hourly positions and intensities was put together in the 1960s in support of the Apollo space program to help provide statistical track forecast guidance. In the intervening years, this database–which is now freely and easily accessible on the Internet from the National Hurricane Center's (NHC) webpage–has been utilized for a wide variety of uses: climatic change studies, seasonal forecasting, risk assessment for county emergency managers, analysis of potential losses for insurance and business interests, intensity forecasting techniques and verification of official and various model predictions of track and intensity.
HURDAT was not designed with all of these uses in mind when it was first put together and not all of them may be appropriate given its original motivation. HURDAT contains numerous systematic as well as some random errors in the database. Analysis techniques have changed over the years at NHC as their understanding of tropical cyclones has developed, leading to biases in the historical database. Another difficulty in applying the hurricane database to studies concerned with landfalling events is the lack of exact location, time and intensity at hurricane landfall.
HURDAT is regularly updated annually to reflect the previous season's activity. The older portion of the database has been regularly revised since 2001. The first time in 2001 led to the addition of tropical cyclone tracks for the years 1851 to 1885. The second time was in October 2002 when Hurricane Andrew (August 1992) was upgraded to a Category 5. Recent efforts into uncovering undocumented historical hurricanes in the late 19th and 20th centuries by various researchers have greatly increased our knowledge of these past events.[42]
Tropical storms from 1851 to 1970 have been reanalyzed. In November 2019, a re-analysis of tropical storms from 1961 to 1965 were completed and integrated into the HURDAT database. In January 2022, a re-analysis of tropical storms from 1966 to 1970 was completed and integrated into the HURDAT database.[42] Possible changes for the years 1971 onward are not yet incorporated into the HURDAT database. Due to these issues, a re-analysis of the Atlantic hurricane database is being attempted that will be completed in three years.
In addition to the groundbreaking work by José Fernández Partagás, additional analyses, digitization and quality control of the data was carried out by researchers at the NOAA Hurricane Research Division funded by the NOAA Office of Global Programs.[43]
The National Hurricane Center's Best Track Change Committee has approved changes for a few recent cyclones, such as Hurricane Andrew. Official changes to the Atlantic hurricane database are approved by the National Hurricane Center Best Track Change Committee.
A 2011 study analyzing one of the main sources of hurricanes–the African easterly wave (AEW)–found that the change in AEWs is closely linked to increased activity of intense hurricanes in the North Atlantic. The synoptic concurrence of AEWs in driving the dynamics of the Sahel greening also appears to increase tropical cyclogenesis over the North Atlantic.[44]
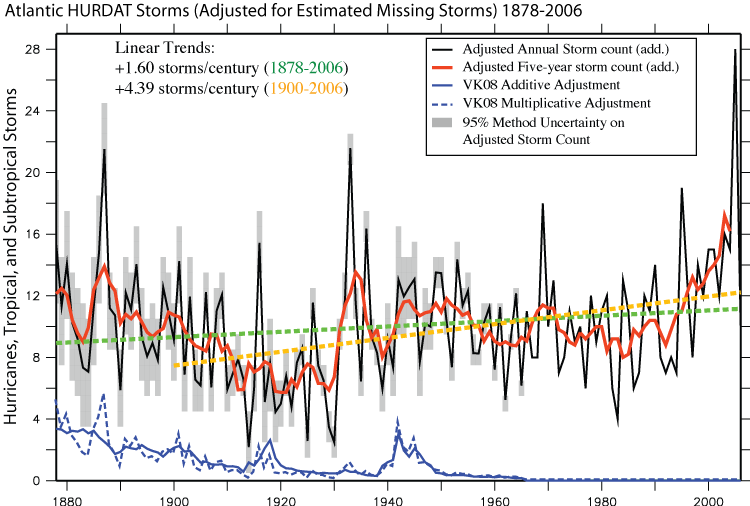
Tropical cyclone count adjusted for lack of observation prior to 1965.
The 20-year average of the number of annual Category 4 and 5 hurricanes in the Atlantic region has approximately doubled since the year 2000.[45]
Category 5 hurricanes have become much more common in recent decades.[46]
The number of $1 billion Atlantic hurricanes almost doubled from the 1980s to the 2010s, and inflation-adjusted costs have increased more than elevenfold.[47] The increases have been attributed to climate change and to greater numbers of people moving to coastal areas.[47]
Accumulated cyclone energy (ACE)—a measure based on maximum sustained winds—over a 30-year period along with 2024's profile as a particular example.[48]
↑"Hurricanes Frequently Asked Questions". AOML.NOAA.gov. Atlantic Oceanographic and Meteorological Laboratory / National Oceanic and Atmospheric Administration. June 1, 2023. Archived from the original on July 4, 2024. (click on "What is the Total Number of Hurricanes and Average Number of Hurricanes in Each Month?")
123"Observations on Hurricanes". The Seaman's Practical Guide, for Barbadoes and the Leeward Islands; with Observations on the Islands From Blanco to the Rocas, on the Coast of La Guayra. London: Smith, Elder & Co. 1832. p.15.
↑Dampier, William (1700). "Chapter VI: Of Storms". Voyages and Descriptions. Vol.2 (2nded.). London. p.68.
↑Long, Edward (1784). "General Description of Jamaica". The History of Jamaica, or, General Survey of the Antient and Modern State. Vol.1. London: T. Lowndes. p.364.
↑Beatson, Robert (1790). Naval and Military Memoirs of Great Britain, From the Year 1727, to the Present Time. Vol.3. London: J. Strachan. p.171.
↑"The political History of Europe, for the Year 1782, Chapter IX". The Gentleman's and London Magazine, for January 1785. John Exshaw. January 1785. p.650.
↑Campbell, John (1785). Lives of the British Admirals: Containing a New and Accurate Naval History, From the Earliest Periods. Vol.4. London. p.212.
↑Vernon, Edward (1740). Britain's Mistakes in the Commencement and Conduct of the Present War. London: T. Cooper. p.18.
↑Morse, Jedidiah (1819). "West-Indies". The American Universal Geography. Vol.1 (7thed.). Charlestown, Boston, Massachusetts: S. Etheridge. p.706.
↑"Theory of Storms". The North American Review (Literature Review). 58 (123): 339. April 1844. JSTOR25099713.
↑Rosser, W. H. (1876). "Hurricane Seasons and Storm Paths". The Law of Storms Considered Practically. London: Charles Wilson. p.90.
↑"Hurricane Signals". Report of the Commissioner of Navigation (Report). Washington, D. C.: Government Printing Office. 1885. p.166.
↑Pietruska, Jamie L. (2016). "Hurricanes, Crops, and Capital: The Meteorological Infrastructure of American Empire in the West Indies". The Journal of the Gilded Age and Progressive Era. 15 (4). Cambridge University Press: 418–445. doi:10.1017/S1537781416000256. S2CID164639962.
↑Hayes, M. W. (1902). "Value of the Climate and Crop and Storm Warning Services of the Weather Bureau to the Industries of Cuba and Other Islands of the West Indies". In Alexander, William H. (ed.). Hurricanes: Especially Those of Porto Rico and St. Kitts. p.58 – via Google Books.
↑Moore, Willis L. (1908). "List of Observing Stations and Changes Therin During 1906". Report of the Chief of the Weather Bureau 1906–1907. Washington, D. C.: United States Weather Bureau. p.7 – via Google Books.
This page is based on this Wikipedia article Text is available under the CC BY-SA 4.0 license; additional terms may apply. Images, videos and audio are available under their respective licenses.


