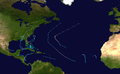
The 1994 Atlantic hurricane season was the final season in the most recent negative Atlantic multidecadal oscillation period ("low-activity era" or "cold phase") of tropical cyclone formation within the basin. The season produced seven named tropical cyclones and three hurricanes, a total well below the seasonal average. The season officially started on June1 and ended on November30, dates which conventionally limit the period each year when most tropical cyclones tend to form in the Atlantic Ocean. The first tropical cyclone, Tropical Storm Alberto, developed on June 30, while the last storm, Hurricane Gordon, dissipated on November21. The season was unusual in that it produced no major hurricanes, which are those of Category3 status or higher on the Saffir–Simpson hurricane scale. The most intense hurricane, Hurricane Florence, peaked as a Category 2 storm with winds of 110mph (180km/h).
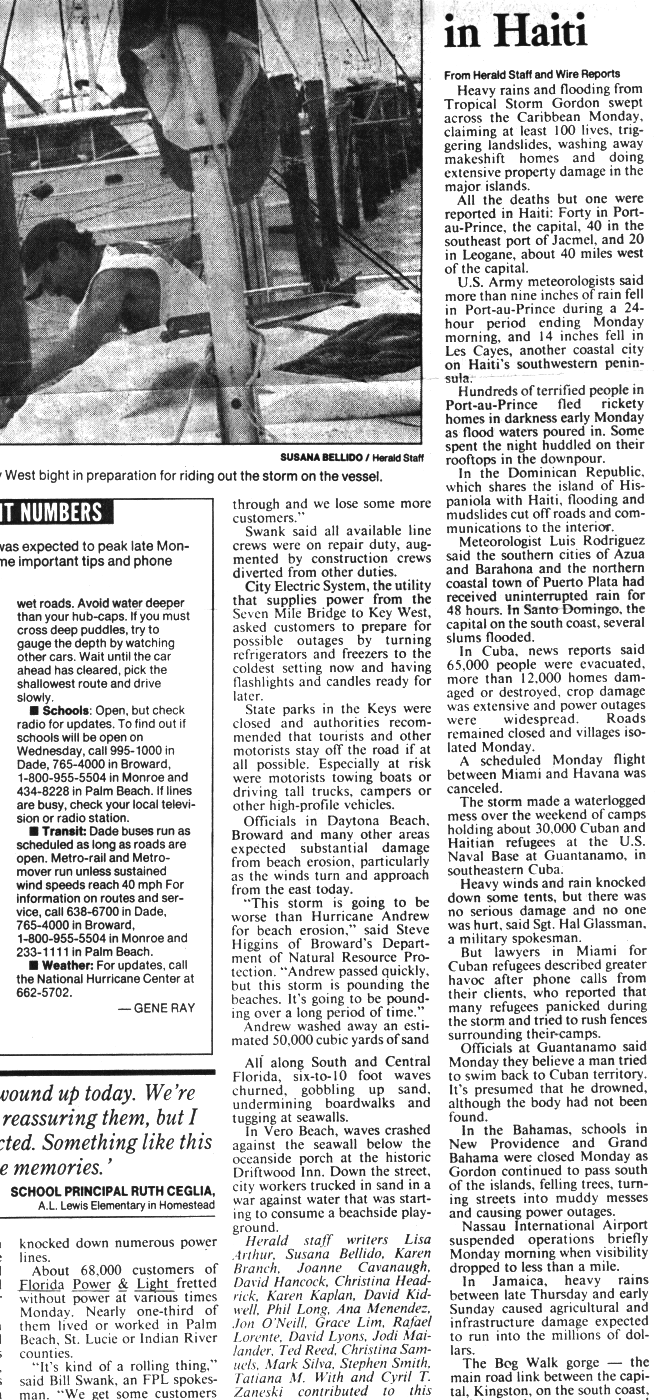
Alberto produced significant rainfall and flooding in the Southeastern United States, damaging or destroying over 18,000 homes. In August, Tropical Storm Beryl produced heavy rainfall in Florida, Georgia, South Carolina, and North Carolina, with moderate to heavy rainfall throughout several other states. Beryl caused numerous injuries, many of which occurred from a tornado associated with the tropical storm. Tropical Storm Debby killed nine people in the Caribbean in September. Hurricane Gordon was the most significant storm of the season, causing damage from Costa Rica to North Carolina among its six landfalls. Extreme flooding and mudslides from Gordon caused approximately 1,122fatalities in Haiti—almost 97% of deaths this season were due to Gordon. Gordon was also one of the longest-lived Atlantic hurricanes on record at the time. In addition, a nor'easter in December may have had tropical characteristics, though due to the uncertainty, it was not classified as a tropical system.
The season caused 1,197deaths and around $1.81billion (1994 USD), mostly because of Gordon and Alberto.
Seasonal forecasts
Predictions of tropical activity in the 1994 season
Forecasts of hurricane activity are issued before each hurricane season by noted hurricane experts such as William M. Gray and his associates at Colorado State University (CSU). A normal season, as defined by the National Oceanic and Atmospheric Administration, has 12.1named storms, with 6.4reaching hurricane strength, and 2.7major hurricanes.[1] On November19, 1993, CSU predicted that the 1994season would feature 13named storms, 5hurricanes, and 2major hurricanes, citing expectations of a dissipating El Niño and a lessening of a drought in the Sahel, but also noting that an easterly quasi-biennial oscillation could inhibit tropical cyclogenesis.[3] The Weather Research Center (WRC)'s early 1994forecast called for 7named storms and 4hurricanes.[4] CSU updated their predictions on March11, decreasing the number of named storms to 10 and hurricanes to 6 but increasing the number of major hurricanes to 3.[5]
After the season began, CSU issued another projection on June5: 9named storms, 5hurricanes, and 1major hurricane. This decrease in anticipated activity occurred because El Niño dissipated slower than expected, unfavorable east-west pressure and temperature gradient estimates over west Africa, and unconducive sea-level pressure and zonal wind anomalies values over the Caribbean Sea.[6] These conditions, as well as below-average rainfall over west Africa, led CSU to lower the number of expected named storms and hurricanes to 7 and 4, respectively, in their final seasonal forecast on August4.[7]
The season officially began on June1, and ended on November30. These dates conventionally delimit the period of each year when the majority of tropical cyclones tend to form in the Atlantic Ocean.[8] In terms of tropical cyclone activity, the season was below average, with only seven named storms, three hurricanes, and no major hurricanes. Only four other seasons since the start of the satellite era—1968, 1972, 1986, and 2013—did not feature a major hurricane.[9] The 1994season is the most recent negative Atlantic multidecadal oscillation period ("low-activity era" or "cold phase") of tropical cyclone formation. within the basin.[10] No storms of hurricane intensity formed within the months of September and October for the first time since reliable records began in the 1940s. However, the month of November did feature two hurricane formations, the first time that occurred since 1980.[11] The low seasonal activity is attributed to the presence of El Niño, which is a global coupled ocean-atmosphere phenomenon.[12] The 1994 El Niño began in mid-spring that year, though ended in late summer several weeks before the hurricane season ended.[13][14] Although strong wind shear prevailed over the tropics, the National Hurricane Center noted that this factor "does not in itself easily explain the dearth of activity during these climatologically most active months." due to being confined to a smaller-than-average area. Additionally, abnormally high surface pressures persisted from Africa to the Caribbean, particularly south of 20°N, which tends to reduce the formation of tropical cyclones.[11] Collectively, the cyclones of the 1994Atlantic hurricane season caused at least $1.81billion in damage and 1,197deaths.[15]
Tropical cyclogenesis began on June30, when Tropical Storm Alberto formed near the western tip of Cuba. After striking Florida on July3, Alberto dissipated over Alabama four days later. Another tropical depression developed later that month, which made landfall in South Carolina on July20 and dissipated over North Carolina the next day. Three systems formed in August, Tropical Storm Beryl, Hurricane Chris, and Tropical Depression Five. September featured five cyclones, although they included two tropical storms, Debby and Ernesto, and three tropical depressions. No activity occurred in October.[9] However, the Weather Prediction Center noted that a subtropical storm may have existed early that month and crossed the Southeastern United States.[16] Two storms formed in November, hurricanes Florence and Gordon. The former peaked as a Category2 hurricane with maximum sustained winds of 110mph (175km/h) and a minimum atmospheric pressure of 972mbar (28.7inHg), making it the most intense cyclone of the season. Gordon dissipated over South Carolina on November21, ending activity.[9]
The season's activity was reflected in a low cumulative accumulated cyclone energy (ACE) rating of 32. ACE is, broadly speaking, a measure of the power of the hurricane multiplied by the length of time it existed, so storms that last a long time, as well as particularly strong hurricanes, have high ACEs. ACE is only calculated for full advisories on tropical systems at or exceeding 34 knots (39mph; 63km/h) or tropical storm strength.[17]
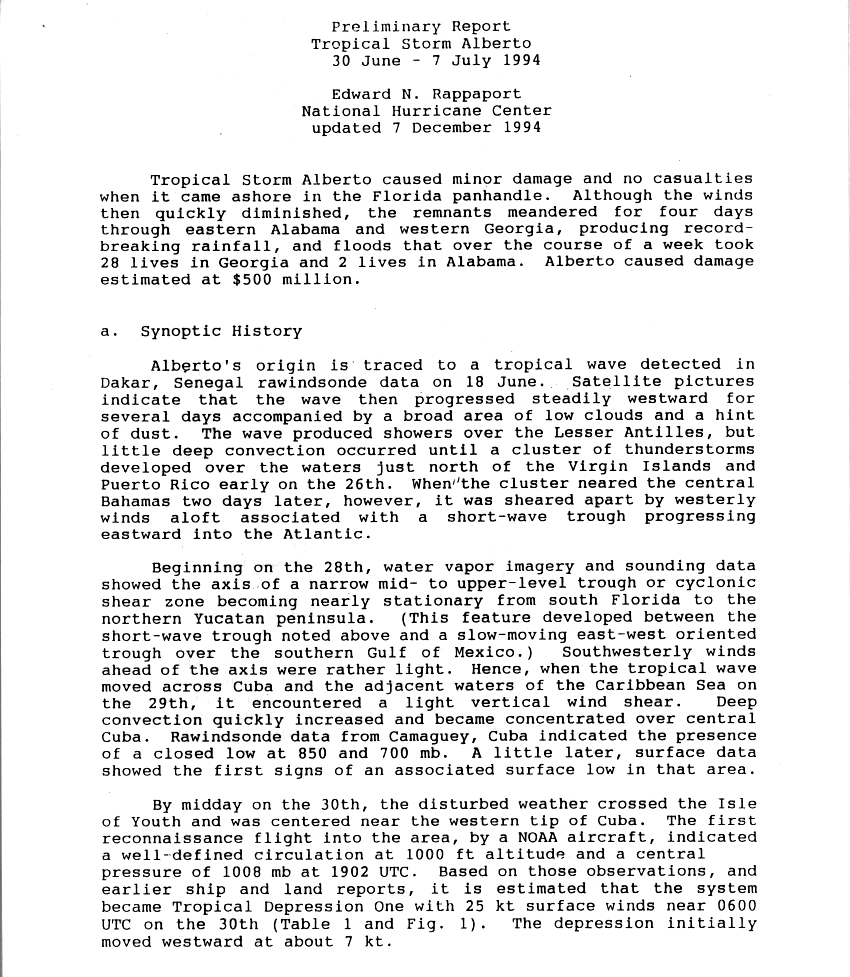
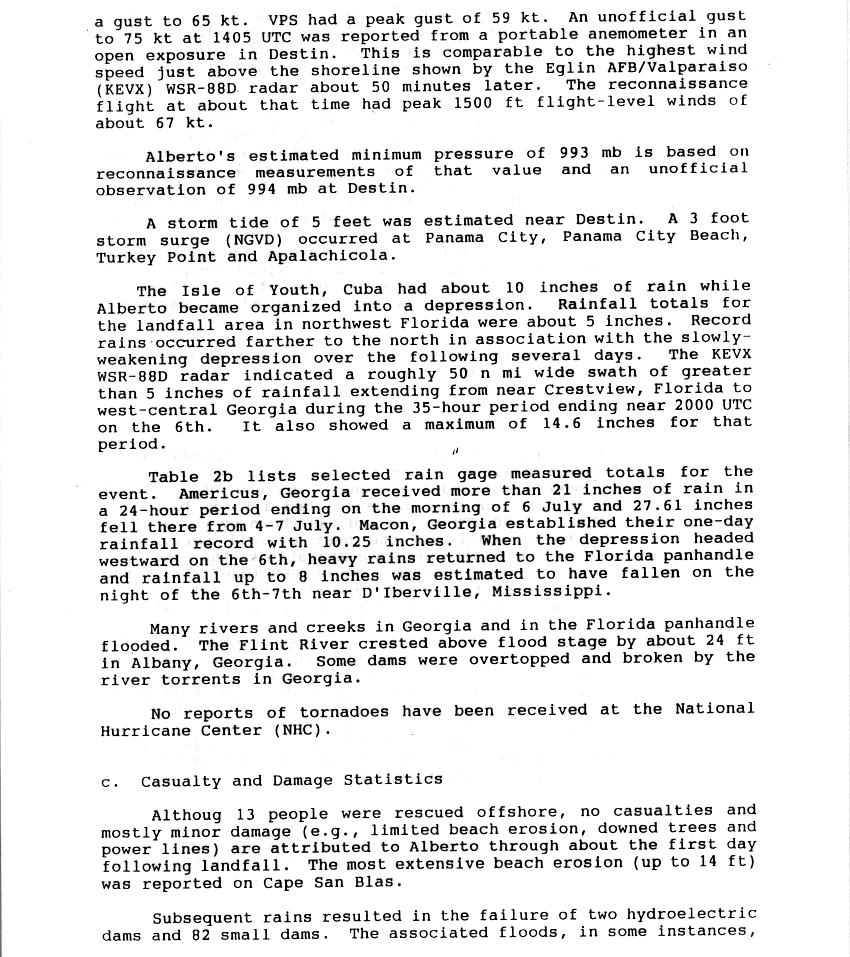
The first storm of the season formed on June 30 near the western tip of Cuba.[18] Initially tracking westward, the depression turned towards the north, though it remained poorly defined. Early on July2, the depression organized into Tropical Storm Alberto. Alberto peaked as a tropical storm with maximum sustained winds of 65mph (100km/h) and a minimum atmospheric pressure of 993mbar (29.3inHg), and made landfall near Destin, Florida, on July3. The storm quickly weakened to a tropical depression over Alabama as it continued to the northeast, but retained a well-organized circulation. High pressures built to its north and east, causing the remnant tropical depression to stall over northwestern Georgia. It began a westward drift and dissipated over central Alabama on July7.[19]
Early in its duration, the storm dropped up to 10in (250mm) of rain over parts of Cuba.[20] In the United States, Alberto triggered some of the worst flooding ever observed across portions of Georgia, Alabama, and Florida.[11] As a result of the storm's slow motion, 27in (690mm) of rain fell in some locations.[21] Due to flash flooding, 33 deaths were reported, with 31in Georgia and 2in Alabama. Approximately 50,000people evacuated their homes, while over 18,000dwellings were damaged or destroyed, and in excess of 1,000roads sustained damage. About 900,000 acres (360,000ha) of crops were affected by the storm, and 218dams failed.[22] Total damage from the storm amounted to $1.03billion.[23] The flooding from Alberto is considered one the worst natural disasters in Georgia's history.[24]
The origins of the depression were from a broad upper-level trough that extended northeastward from the Bahamas. An area of convection developed near the Bahamas, spawning a low-pressure area on July19. The next day, the system organized into Tropical Depression Two,[25] after confirmation from the Hurricane Hunters.[26] Upon developing, the depression was poorly organized, with most of the thunderstorms located south of the center. On July20, convection increased near the center; however, the depression struck near Georgetown, South Carolina, at 14:00UTC with winds of 35mph (55km/h) and a minimum pressure of 1,015mbar (30.0inHg). Moving northwestward, the cyclone dissipated on July21 near Charlotte, North Carolina,[25] while the remnant low tracked northeastward until becoming unidentifiable on July22 while entering Nova Scotia.[27]
The depression was never forecast to attain tropical storm status. Officials issued flash flood watches for portions of the southeastern United States.[25] Light rains fell throughout the Southeastern United States, the Mid-Atlantic, and parts of New England,[27] peaking at 6.84in (174mm) in Hamlet, North Carolina.[27] It was the first tropical system to make landfall in South Carolina since Hurricane Hugo.[28]
After a slow start to the season, a large upper-level low pressure area organized into a tropical depression roughly 120mi (190km) south of Pensacola, Florida, on August14.[29] The center moved slowly and erratically in response to an approaching trough, and after moving towards the north, the depression intensified into Tropical Storm Beryl on August15. Early the next day, Beryl made landfall near Panama City, Florida, with winds of 60mph (95km/h) and a minimum pressure of 999mbar (29.5inHg). The cyclone quickly weakened to a tropical depression later on August16 and accelerated towards the north-northeast. Beryl was last identifiable in Connecticut on August19, when a frontal trough absorbed it.[30]
Beryl produced sustained winds of 53mph (85km/h) and a wind gust of 64mph (103km/h),[30] damaging some roofs and toppling trees, signs, and power lines, causing about 20,000customers to lose electricity.[31]:22 Heavy rainfall in Florida, Georgia, South Carolina, and North Carolina, with moderate to heavy rainfall throughout several other states. Several rivers from Florida to New York approached or exceeded flood stage.[32] Six people died due to Beryl, all from drowning, three in Florida,[31]:23 two in New York,[31]:55 and one in Georgia.[31]:29 Additionally, several injuries were reported, including 37 due to an associated F3 tornado that touched down in Lexington, South Carolina. Damage in Florida, New York, South Carolina, and Virginia was estimated at $73million,[32] while two tornadoes in Georgia caused a combined $1.2million in damage.[31]:27
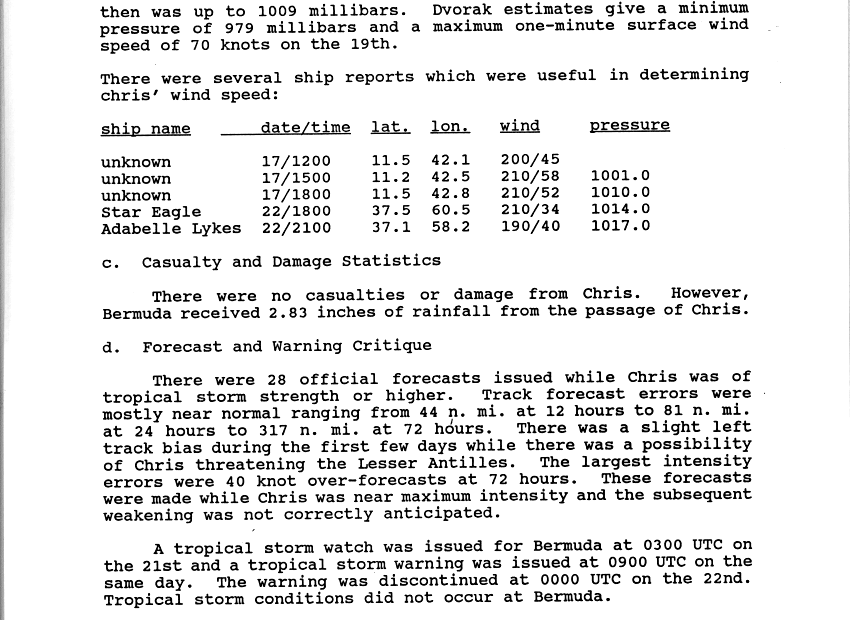
A tropical wave emerged into the Atlantic from the west coast of Africa on August 11 and tracked westward. The associated disturbance organized and was declared a tropical depression on August16 about 1,020mi (1,640km) west of the Cabo Verde Islands. The depression intensified into Tropical Storm Chris on August17, and the next day it acquired hurricane intensity. Early on August19, Chris peaked with winds of 80mph (130km/h) and a minimum pressure of 979mbar (28.9inHg), before increasing wind shear caused the cyclone to weaken. The storm turned northward along the western periphery of a subtropical high pressure ridge and remained away from land, passing to the east of Bermuda on August21. The island observed 2.83in (72mm) of rain.[33] Chris accelerated northeastward ahead of an approaching cold front and merged with an extratropicalbaroclinic zone roughly 145mi (235km) southeast of Cape Race, Newfoundland.[34]
A tropical wave that was first noted on August17 tracked westward. Convective associated with the wave did not organize until it reached the western Caribbean on August26. After the wave crossed the Yucatán Peninsula, a reconnaissance aircraft indicated that a tropical depression formed over Bay of Campeche. Moving west-northwestward, the system remained below tropical storm status, peaking with winds of 35mph (55km/h) and a minimum pressure of 1,005mbar (29.7inHg). Early on August31, the depression made landfall in Tamaulipas near Tampico.[35] Mexico was affected by rainfall from Tropical Depression Five, which peaked at 16.18in (411mm) in Aldama, Tamaulipas,[36] while associated moisture from the cyclone affected San Antonio, Texas.[37]
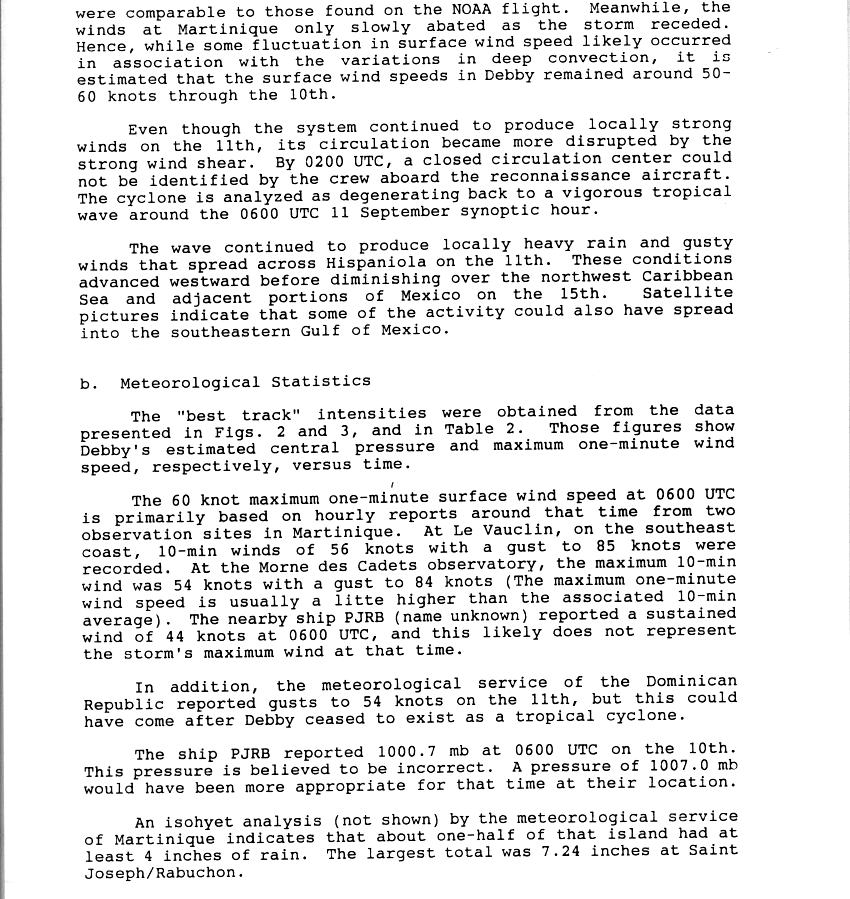
A tropical depression developed from another tropical wave on September9 approximately 175mi (280km) east of Barbados. Surface observations and ship reports suggested that it developed into Tropical Storm Debby on September10, despite poor organization evidenced by satellite imagery. A few hours after striking Saint Lucia that day, Debby entered the Caribbean and peaked with winds of 70mph (110km/h) and a minimum pressure of 1,006mbar (29.7inHg). However, Debby soon encountered wind shear, which limited the storm's intensity and organization.[38] Wind shear caused the system to deteriorate, and the circulation degenerated into a tropical wave on September11 about 170mi (275km) south of Puerto Rico. The remnants continued westward and were last noted over the western Caribbean and adjacent areas of Mexico on September15.[39]
Tropical Storm Debby killed four people and injured24 on Saint Lucia. Heavy rainfall caused flooding and mudslides, which washed away hillside shacks, eight bridges, and parts of roads. Flood waters were chest-high in some locations, and the storm's winds damaged banana plantations.[40] Mudslides caused by the storm blocked roads, and water supply was disrupted.[41] On Martinique, one person drowned and some towns were flooded. Downed trees made roads impassable, and up to 20,000 people on the island lost power. Three deaths occurred in the Dominican Republic, and a fisherman drowned off of Puerto Rico. Throughout the areas affected by Debby, it is estimated that hundreds of people were homeless.[40] Overall, Debby caused nine deaths and about $115million in damage.[40][42][43]
A tropical wave exited Africa on September18 with an area of organized deep convection. The wave was in a series of strong waves that exited Africa later than the climatological peak of the season. Dvorak classifications began on September21, and later that day the system developed into Tropical Depression Seven about 500mi (805km) southwest of Cabo Verde.[44] Wind shear was marginally favorable for development, and the depression intensified into Tropical Storm Ernesto on September22. The next morning, the storm attained its peak intensity, with winds of 60mph (95km/h) and a minimum atmospheric pressure of 997mbar (29.4inHg).[44]
After peaking, Ernesto entered an area of increasing wind shear and stronger upper-tropospheric flow, resulting in a steady weakening trend. After most of the convection diminished over the center, the storm weakened to a tropical depression on September24. Subsequently, it decelerated and turned to a west-northwest drift.[44] The last public advisory was issued on Tropical Depression Ernesto at 2100 UTC September 25,[45] although it did not dissipate until early the next day,[44] about 450mi (725km) west of Cabo Verde. The remnants continued generally westward, occasionally redeveloping deep convection but never regenerating into a tropical cyclone. The remnants were no longer identifiable by September29.[46]
The eighth depression of the season formed with little convection on September 19 in the southwestern Caribbean. The area of convection lasted for several days moving from northwestern direction to the northeastern. The wave was estimated to have strengthened into Tropical Depression Eight on September24 roughly 10mi (15km) north of northeastern Honduras. An Air Force aircraft found a poorly organized circulation later that day.[47] The depression moved west at 7 to 10mph (11 to 16km/h). Just before landfall in Belize near Maya Beach Village on September25, the cyclone reached its peak intensity of 35mph (55km/h) and 1,004mbar (29.6inHg). The depression dissipated the next day over Guatemala, although its remnants partially contributed to the development of Tropical Depression Ten.[47] The storm dropped heavy precipitation over Belize, Guatemala, Honduras, and eastern Mexico.[48][49]
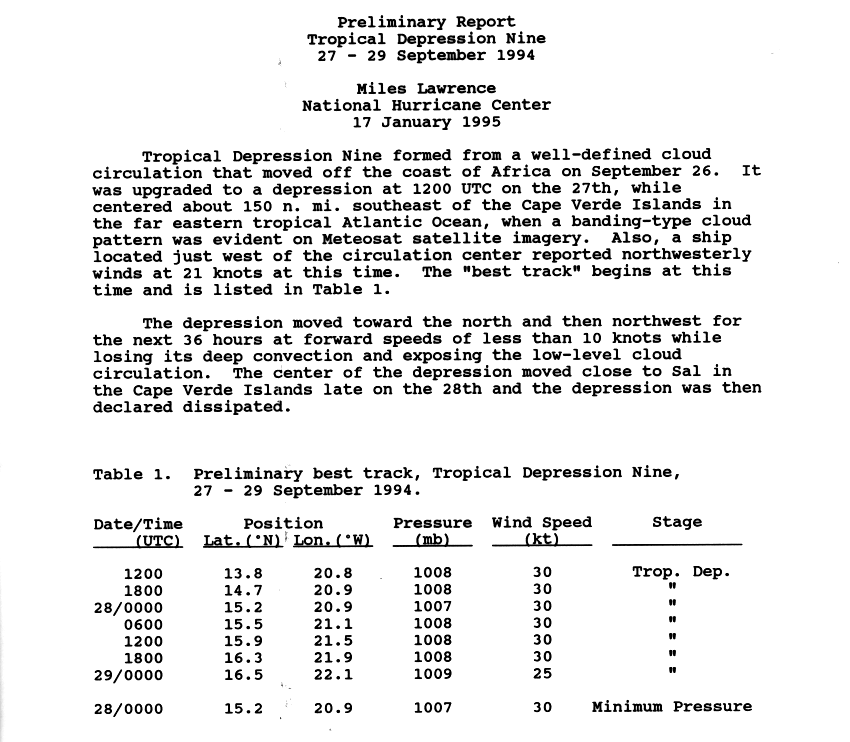
Tropical Depression Nine originated from a well-defined cloud circulation that moved off the coast of Africa on September26. The circulation was upgraded to the ninth depression of the 1994season, 175mi (280km) southeast of Cabo Verde the next day at 12:00UTC when banding cloud patterns became evident on satellite imagery. The depression moved toward the north-northwest at 12mph (19km/h) or less, reaching peak intensity early on September28 with winds of 35mph (55km/h) and a minimum pressure of 1,007mbar (29.7inHg). However, the low-level circulation soon became exposed and the depression lost much of its deep convection later that day. The NHC declared the system dissipated early on September29 near Sal in the Cabo Verde Islands.[50]
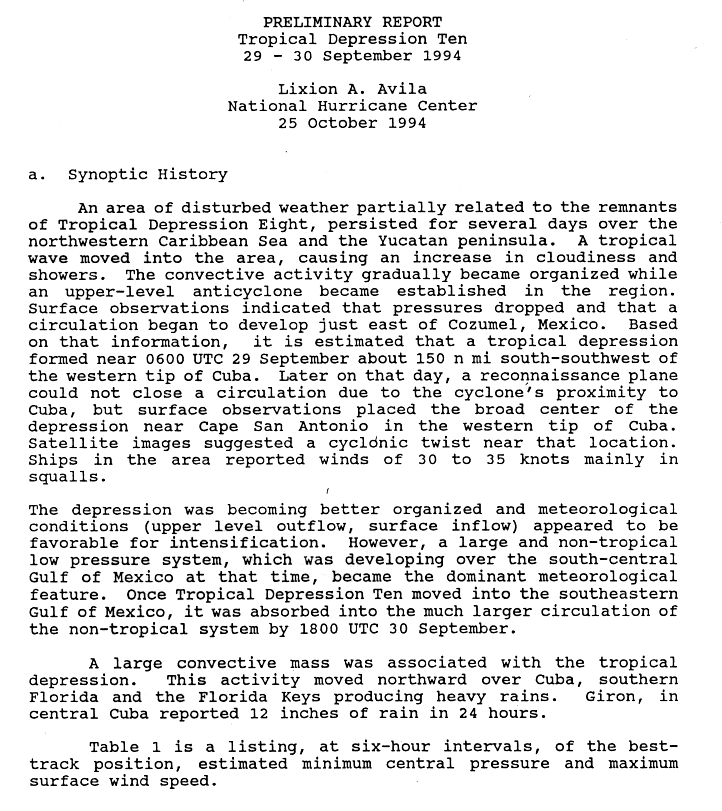
The remnants of Tropical Depression Eight persisted over the northwestern Caribbean in late September. Convection increased and organized after a tropical wave reached the area. A circulation soon developed within the low-pressure area. It was estimated that Tropical Depression Ten formed on September 29 at 0600 UTC. A reconnaissance aircraft did not indicate a closed circulation due to the proximity with Cuba, which caused difficulties with satellite intensity estimates. The system was relatively disorganized, partially moving ashore in western Cuba near Cabo San Antonio. The depression entered the Gulf of Mexico early on September 30 as it turned to the northwest and peaked with winds of 35mph (55 km/h) and a minimum pressure of 1,004mbar (29.6inHg). Several hours later, the depression was absorbed by a larger non-tropical system roughly 160mi (255km) northwest of Santa Lucía in Pinar del Río Province.[51]
The National Hurricane Center (NHC) initially predicted that the depression would rapidly develop into a tropical storm.[52] The depression dropped heavy rainfall in Cuba, reaching 12in (300mm) in a 24-hour period in Giron.[53] Precipitation also reached southern Florida,[54] resulting in flash flood watches being issued for several counties.[55]Key West recorded almost 9in (230mm) of rain in a 48-hour period, flooding businesses, sidewalks, and streets.[56]
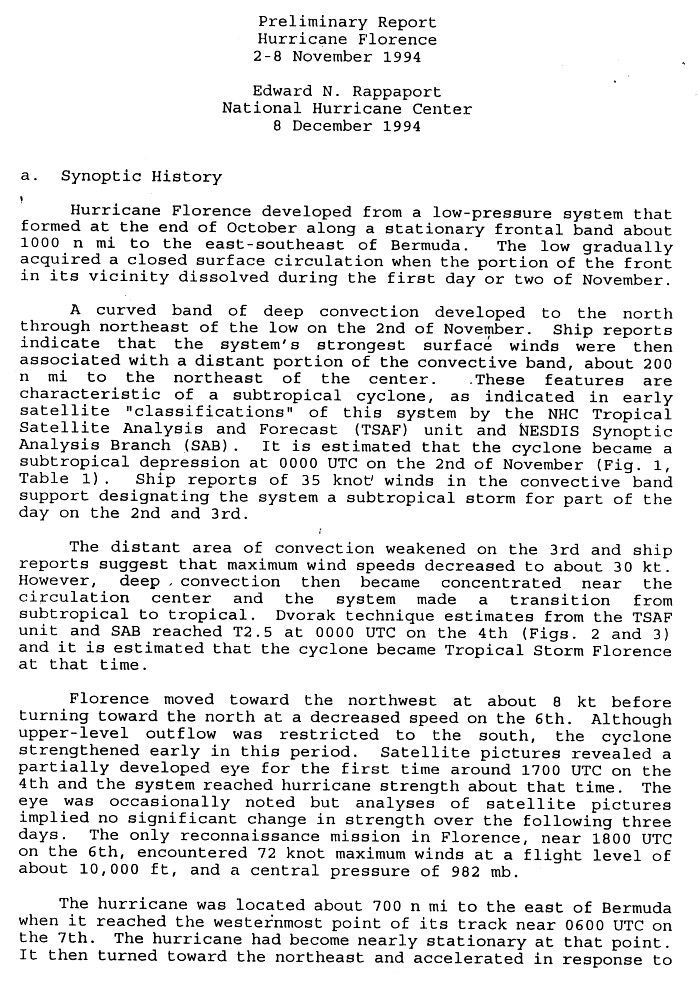
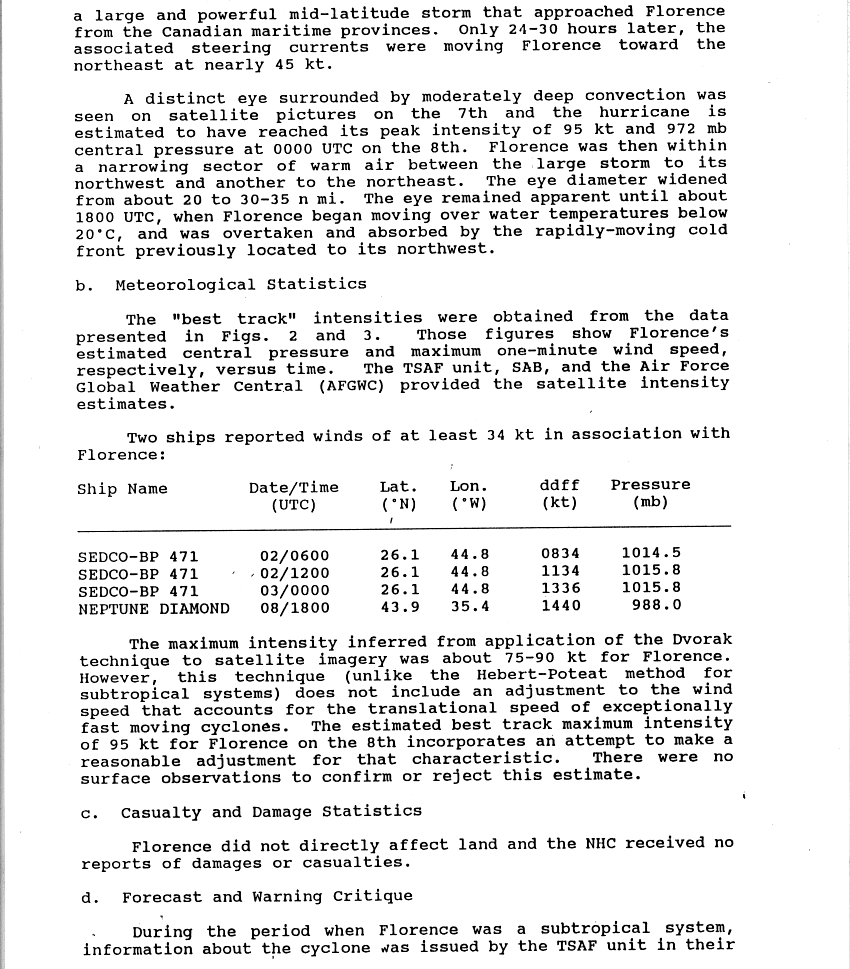
An area of low pressure developed along a stationary front east-southeast of Bermuda. The low detached from the front and the system was classified as a subtropical depression on November2 about 1,015mi (1,633km) east-northeast of the Leeward Islands. The system strengthened into a subtropical storm, but the storm weakened to a subtropical depression the next day. By the afternoon, the subtropical system transitioned into a tropical cyclone and was reclassified as a tropical depression.[57][58] The system turned northwestward and strengthened into a Tropical Storm Florence early on November4,[59] several hours before reaching hurricane intensity.[60] The storm maintained its intensity while slowly turning northward.[61] By November 7, the storm began strengthening while turning and accelerating northeast.[62] Operationally, Florence was reported to have reached Category 3 major hurricane status, but post-season analysis determined that the storm peaked as a Category2 hurricane with winds of 110mph (175km/h) and a minimum pressure of 972mbar (28.7inHg).[63] By November 8, Florence weakened slightly to Category 1 status, about six hours before being absorbed by another extratropical cyclone roughly 410mi (660km) northwest of the Azores.[64][65]
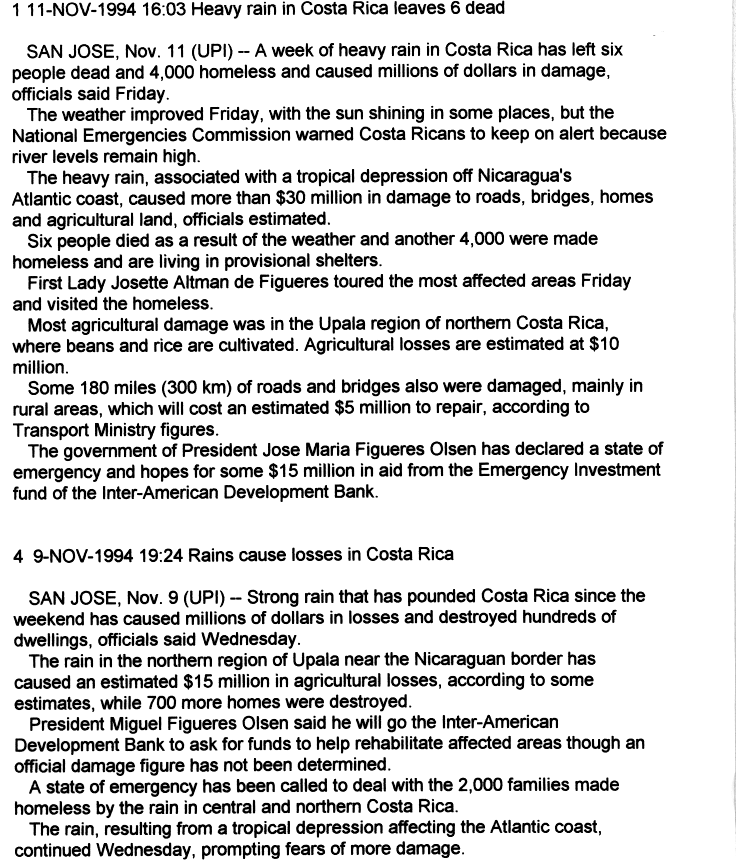
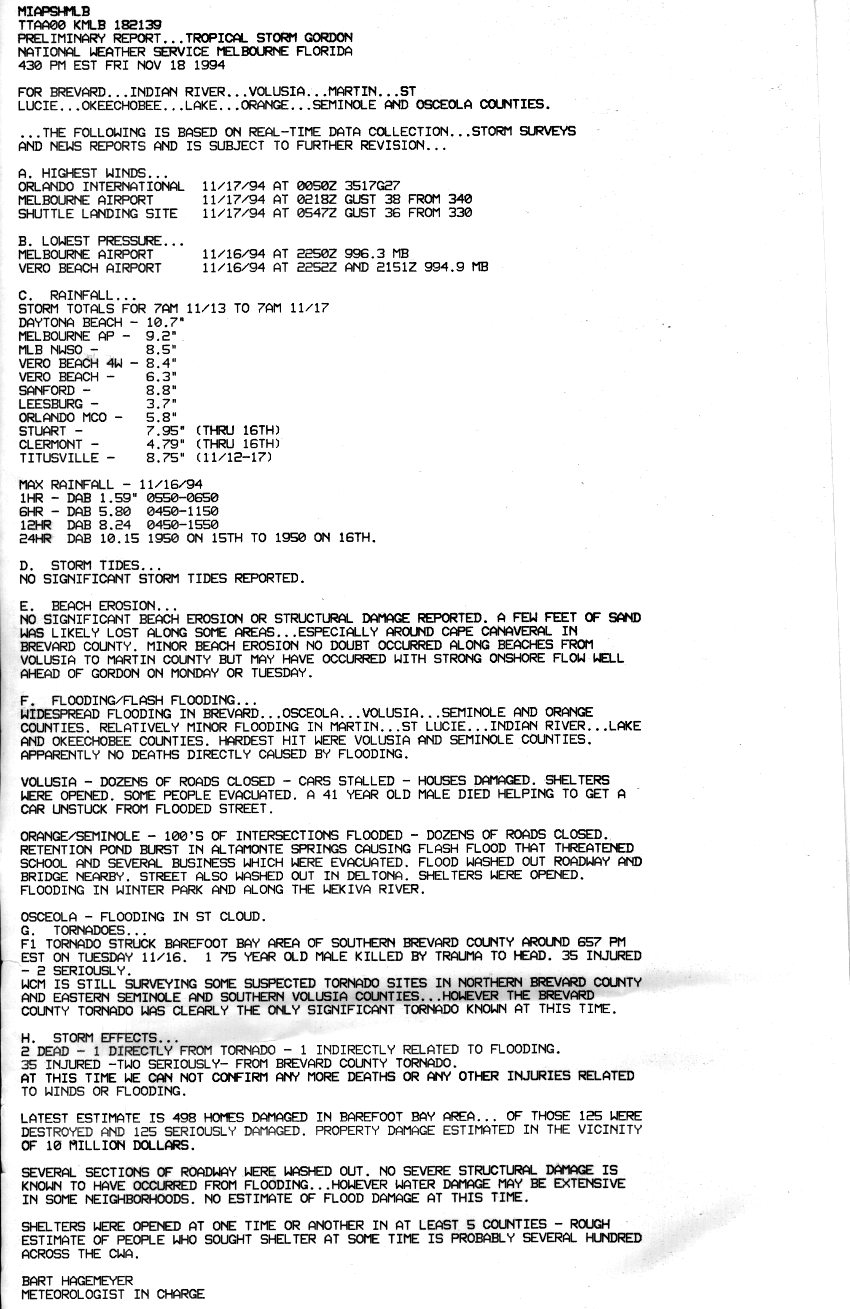
A series of tropical waves consolidated into a tropical depression near Nicaragua in the southwestern Caribbean on November8. The depression drifted generally northward and strengthened into Tropical Storm Gordon on November10, but wind shear prevented much further strengthening, despite warm seas. After turning eastward and then northeastward, Gordon struck eastern Jamaica and eastern Cuba on November13. Gorden then turned northwest, crossing the Florida Keys on November15, where it interacted with a cyclone in the upper troposphere and a series of cyclonic lows, which lent the storm some subtropical characteristics. After a few days as an unusual hybrid of a tropical and a subtropical system in the Gulf of Mexico, the storm re-claimed its tropical storm status and struck southwest Florida on November16. Emerging into the Atlantic, Gordon strengthened to a Category1 hurricane late the next day and peaked with winds of 85mph (140km/h) and a minimum pressure of 980mbar (29inHg) early on November18. Gordon briefly approached North Carolina but then headed south, weakening to a tropical depression before making its sixth and final landfall on Florida's east coast on November21, several hours before dissipating over South Carolina.[66]
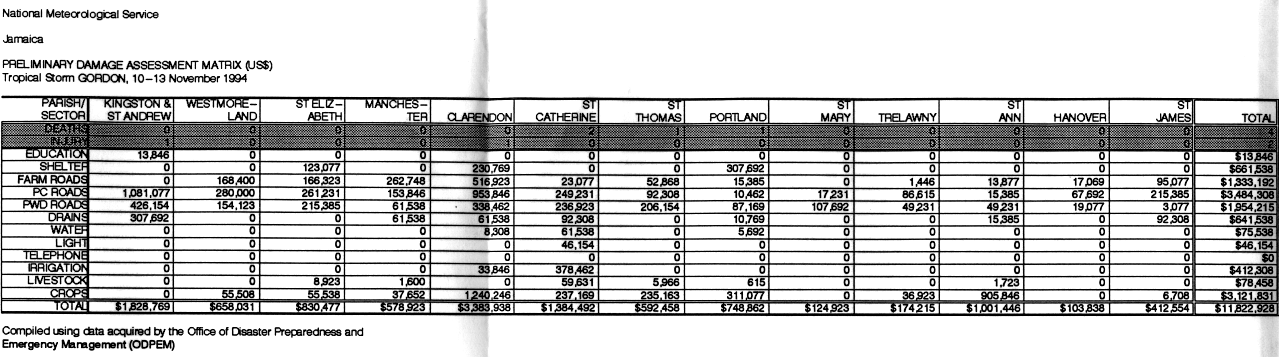
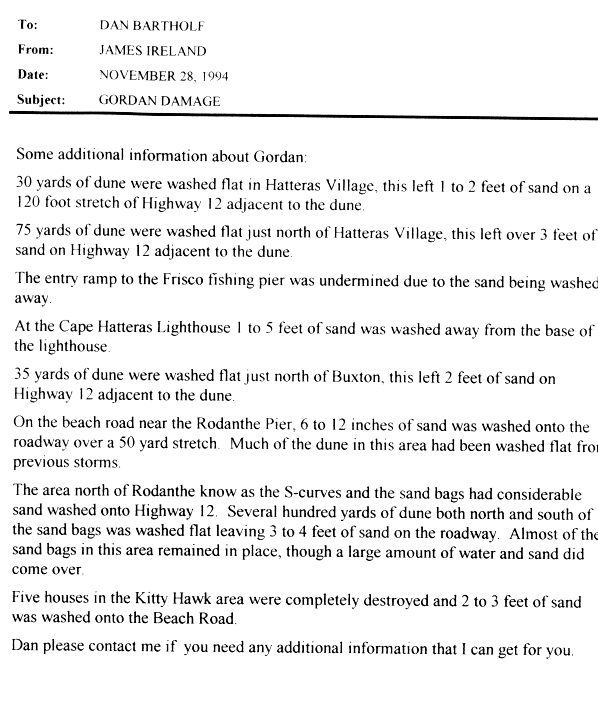
Flooding in Costa Rica from Gordon demolished about 700homes and inflicted about $30million in damage.[67][68] In Jamaica, Gordon caused roughly $11.8million in damage.[69] A prolonged southwesterly flow produced 14in (360mm) of rainfall in a 24‑hour period in Haiti,[70] resulting in numerous mudslides and major flooding that damaged around 10,800dwellings, with another 3,500destroyed.[71] The storm wrought 1,122deaths and $50million in damage in the country.[66][72] Gordon damaged or destroyed 5,906homes in Cuba and inflicted about $102million in damage.[72][73] In Florida, the storm damage totaling about $400million, much of it to the agricultural industry,[74] although 1,236buildings were flooded in Volusia County.[75] North Carolina experienced high waves from Gordon, eroding beaches and destroying five residences.[76] Overall, the cyclone caused roughly $594million and killed 30people outside of Haiti, with 11in Florida, 6in Costa Rica, 5in the Dominican Republic, 4in Jamaica, and 2each in Cuba and Panama.[67][69][72][74][77]
Other systems
Rainfall from the cyclone
On September 30, a weak and broad frontal low absorbed the remnants of Tropical Depression Ten in the southeastern Gulf of Mexico.[51] The Weather Prediction Center identified the system as a possible subtropical storm, purported to have developed on October1. The system moved across Florida and the Southeastern United States on October2 and October3; when it reached the Atlantic Coast, it became an extratropical frontal wave.[16] The NHC could not confirm whether the system had developed subtropical characteristics.[9] Heavy rains fell over parts of the Florida Panhandle, Georgia, and South Carolina.[16] In Florida, rough seas left minor coastal flooding and beach erosion, while also necessitating the rescue of 18people from capsizing vessels. At least four tornadoes occurred in the state, Damage to homes occurred near Callahan and near Shady Grove. Rainfall led to flooding in low-lying areas and along some roads, leaving about $1million in damage.[78] Heavy precipitation over southern Georgia inundated portions of several roads and streets. Additionally, an F2 tornado in St. Marys destroyed ten homes and overturned five mobile homes.[78] In South Carolina, up to 11.24in (285mm) of rain fell at Hilton Head Island,[16] damaging over 147dwellings, at least 45vehicles, 37roads, 36businesses, and 6public buildings in Beaufort County alone. Heavy rains and rough seas also caused damaging flooding in Charleston County.[78]
After the season had officially ended, a Late December nor'easter developed from an area of low pressure in the southeast Gulf of Mexico. As the system entered the warm Gulf Stream waters of the Atlantic, it began to rapidly intensify, and also began exhibiting signs of tropical development, including the formation of an eye. It attained a pressure of 970mbar (29inHg) on December23 and24, and after moving northward, it came ashore near New York City on Christmas Eve. However, due to the uncertain nature of the storm, the NHC did not classify it as a tropical cyclone.[79][80]
The following list of names was used for named storms that formed in the north Atlantic in 1994.[81] This is the same list used for the 1988 season,[82] except for Gordon and Joyce, which replaced Gilbert and Joan after that season.[83] A storm was named Gordon for the first time in 1994.[84] No names were retired from this list following the season,[83] thus it was used again for the 2000 season.[85]
This is a table of all of the storms that formed in the 1994 Atlantic hurricane season. It includes their name, duration, peak classification and intensities, areas affected, damage, and death totals. Deaths in parentheses are additional and indirect (an example of an indirect death would be a traffic accident), but were still related to that storm. Damage and deaths include totals while the storm was extratropical, a wave, or a low, and all of the damage figures are in 1994 USD.
↑Miles B. Lawrence (September 21, 1994). Hurricane Chris Preliminary Report (Report). National Hurricane Center. Archived from the original on March 26, 2009. Retrieved November 21, 2008.
↑"Panhandle could get soaked again". The Florida Times-Union. Associated Press. October 2, 1994. p.A-5. Retrieved December 8, 2025– via Newspapers.com.
↑Robert Henson (December 1995). "Hurricanes in disguise"(PDF). Weatherwise. Vol.48, no.6. Archived(PDF) from the original on May 22, 2012. Retrieved October 18, 2008– via Weatheranswer.com.
↑National Hurricane Operations Plan(PDF) (Report). Washington, D.C.: NOAA Office of the Federal Coordinator for Meteorological Services and Supporting Research. May 1994. p.3-7. Retrieved January 17, 2024.
↑National Hurricane Operations Plan(PDF) (Report). Washington, D.C.: NOAA Office of the Federal Coordinator for Meteorological Services and Supporting Research. May 1988. p.3-7. Retrieved January 17, 2024.
↑National Hurricane Operations Plan(PDF) (Report). Washington, D.C.: NOAA Office of the Federal Coordinator for Meteorological Services and Supporting Research. May 2000. p.3-7. Retrieved January 17, 2024.
This page is based on this Wikipedia article Text is available under the CC BY-SA 4.0 license; additional terms may apply. Images, videos and audio are available under their respective licenses.


