| Timeline of the 1994 Atlantic hurricane season | |||||
|---|---|---|---|---|---|
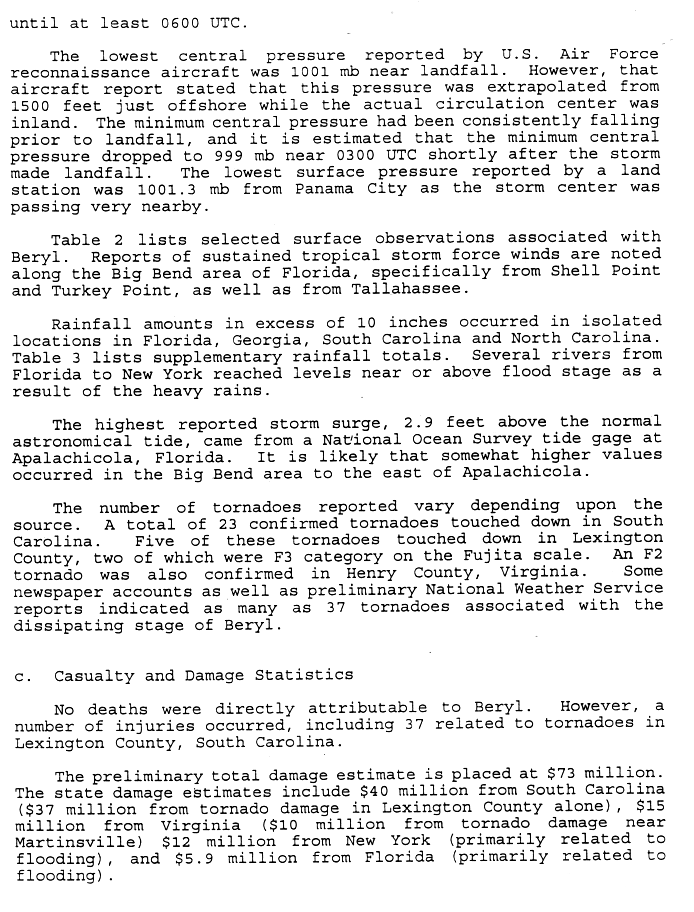
 Season summary map | |||||
| Season boundaries | |||||
| First system formed | June 30, 1994 | ||||
| Last system dissipated | November 21, 1994 | ||||
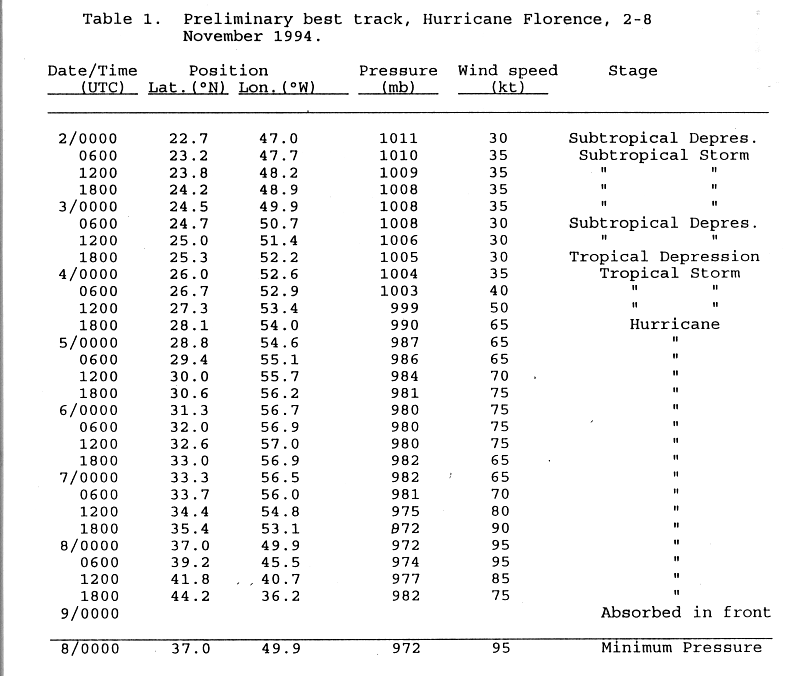
| Strongest system | |||||
| Name | Florence | ||||
| Maximum winds | 110 mph (175 km/h) (1-minute sustained) | ||||
| Lowest pressure | 972 mbar (hPa; 28.7 inHg) | ||||
| Longest lasting system | |||||
| Name | Gordon | ||||
| Duration | 13.5 days | ||||
| |||||
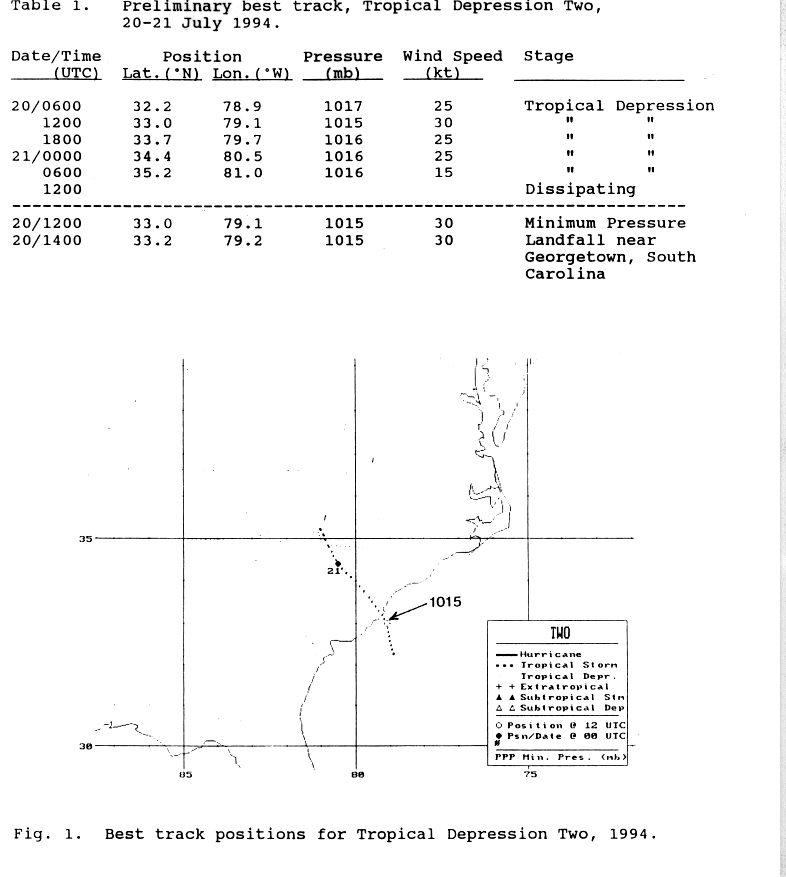
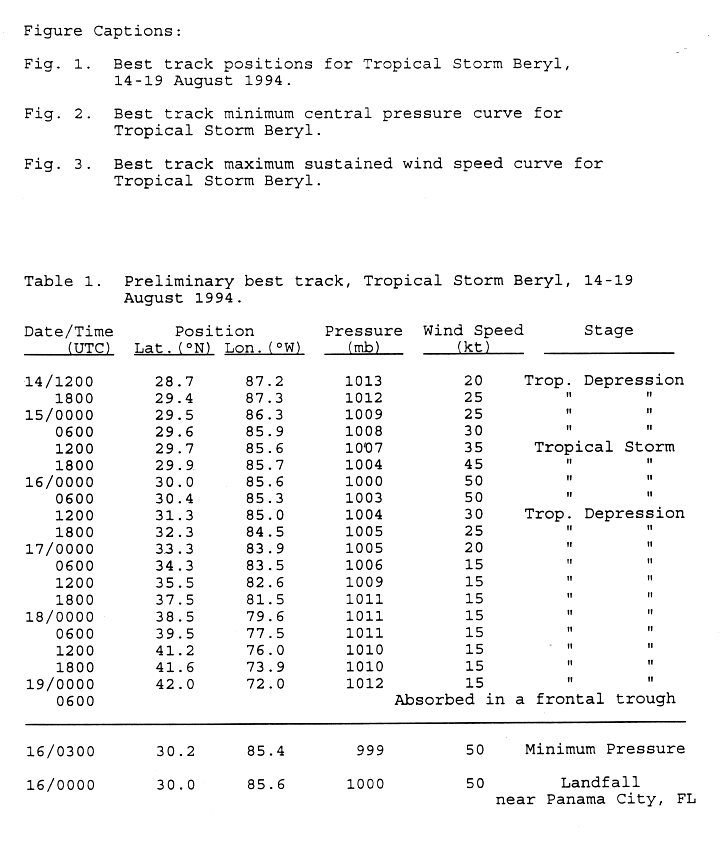
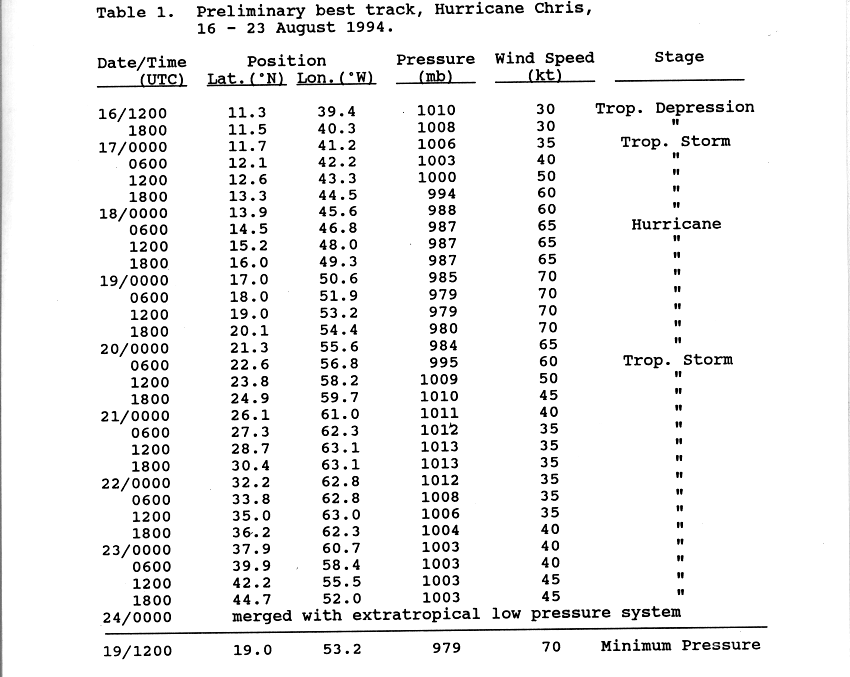
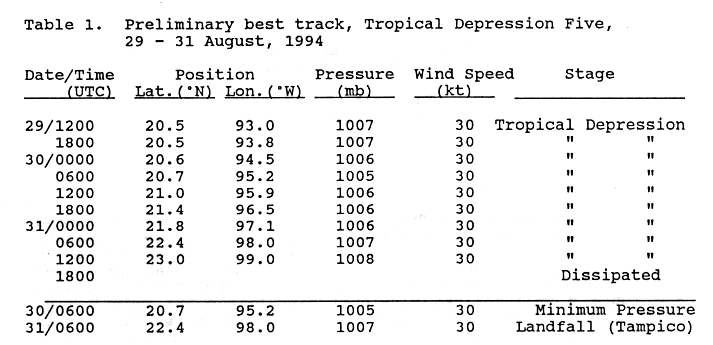
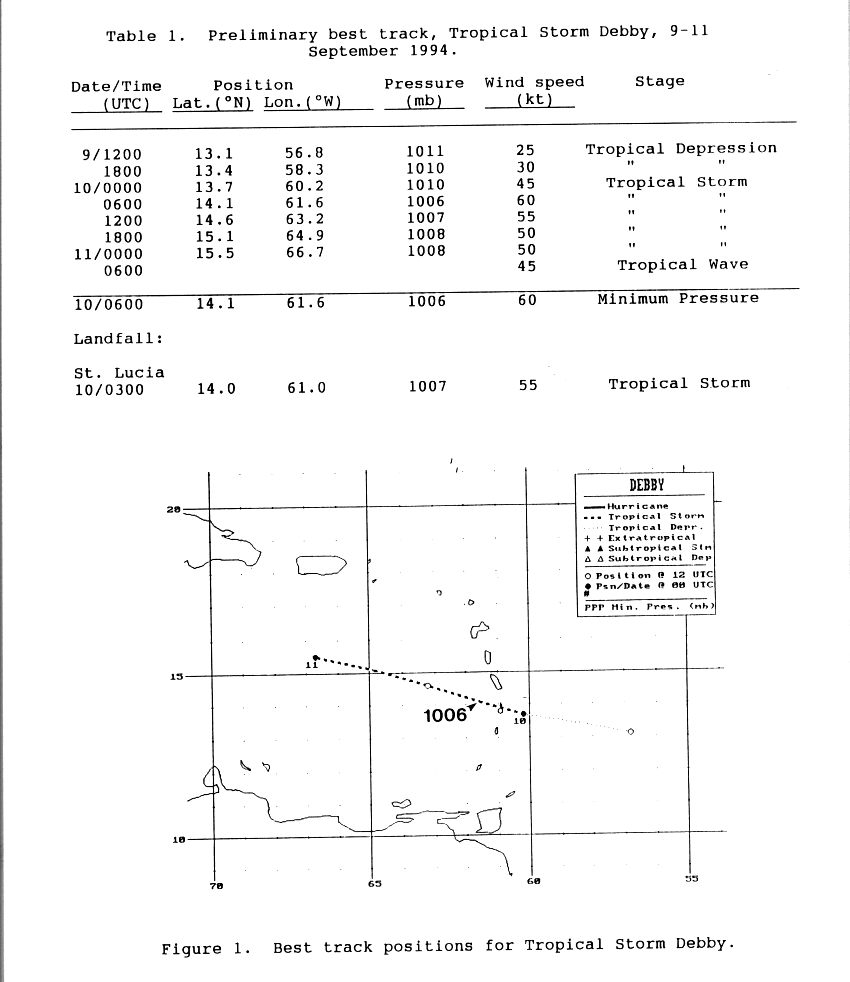
The 1994 Atlantic hurricane season was a below-average Atlantic hurricane season that produced seven named tropical cyclones. The season officially began on June 1 and ended on November 30, dates which conventionally limit the period of each year when tropical cyclones tend to form in the Atlantic. The first named storm, Tropical Storm Alberto, formed on June 30. The last storm of the season, Hurricane Gordon, dissipated on November 21. This season produced seven named storms; three attained hurricane status, though none became a major hurricane, a storm that ranks as a Category 3 or higher on the Saffir-Simpson Hurricane Scale. [1] Tropical Storm Alberto produced significant rainfall and flooding in the Southeastern United States, damaging or destroying over 18,000 homes, and inflicting $750 million (1994 USD) in damages. [2] In August, Tropical Storm Beryl produced heavy rainfall in areas of Florida, Georgia, South Carolina, and North Carolina, with moderate to heavy rainfall throughout several other states. Beryl caused numerous injuries, many of which occurred from a tornado associated with the tropical storm. [3] Tropical Storm Debby killed nine people throughout its path in September. [4] Hurricane Gordon in November caused damages from Costa Rica to North Carolina in its six landfalls; extreme flooding and mudslides from the storm caused about 1,122 fatalities in Haiti. [5]
Contents
This timeline documents tropical cyclone formations, strengthening, weakening, landfalls, extratropical transitions, and dissipations during the season. It includes information that was not released throughout the season, meaning that data from post-storm reviews by the National Hurricane Center, such as a storm that was not initially warned upon, has been included.
The time stamp for each event is stated using Coordinated Universal Time (UTC), the 24-hour clock where 00:00 = midnight UTC. [6] and the time zone where the center of the tropical cyclone is currently located. The time zones utilized (east to west) prior to 2020 were: Atlantic, Eastern, and Central. [7] In this timeline, the respective area time is included in parentheses. Additionally, figures for maximum sustained winds and position estimates are rounded to the nearest 5 units (miles, or kilometers), following National Hurricane Center practice. Direct wind observations are rounded to the nearest whole number. Atmospheric pressures are listed to the nearest millibar and nearest hundredth of an inch of mercury.


