| Timeline of the 1996 Atlantic hurricane season | |||||
|---|---|---|---|---|---|
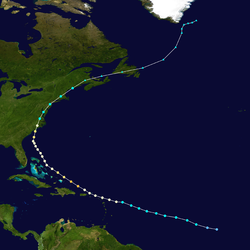
 Season summary map | |||||
| Season boundaries | |||||
| First system formed | June 17, 1996 | ||||
| Last system dissipated | November 26, 1996 | ||||
| Strongest system | |||||
| Name | Edouard | ||||
| Maximum winds | 145 mph (230 km/h) (1-minute sustained) | ||||
| Lowest pressure | 933 mbar (hPa; 27.55 inHg) | ||||
| Longest lasting system | |||||
| Name | Fran | ||||
| Duration | 15.5 days | ||||
| |||||
The 1996 Atlantic hurricane season consisted of the events that occurred in the annual cycle of tropical cyclone formation over the Atlantic Ocean north of the equator. The official bounds of each Atlantic hurricane season are dates that conventionally delineate the period each year during which tropical cyclones tend to form in the basin according to the National Hurricane Center, beginning on June 1 and ending on November 30. [1] However, tropical cyclogenesis is possible at any time of the year. Activity during the season was above average; [nb 1] thirteen named storms developed, with nine becoming hurricanes and six further strengthening into major hurricanes. [nb 2] The first system, Tropical Storm Arthur, formed on June 17; the last, Hurricane Marco, dissipated on November 26.
Contents
The season's most destructive storms were Hurricane Cesar, Hurricane Fran, and Hurricane Hortense. Hurricane Cesar (later known as Hurricane Douglas in the Eastern Pacific basin) was the deadliest storm of the season; it killed at least 51 people and caused severe damage in northern Colombia and southern Central America. [3] Hurricane Fran caused $3.2 billion (1996 USD) worth of damage in the United States, mostly in North Carolina, and killed 26 people. [4] Hurricane Hortense dropped torrential rainfall on southwestern Puerto Rico and the eastern Dominican Republic, killing 21 people and leaving behind $127 million (1996 USD) in damage. [5]
This timeline documents tropical cyclone formations, strengthening, weakening, landfalls, extratropical transitions, and dissipations during the season. It includes information that was not released throughout the season, meaning that data from post-storm reviews by the National Hurricane Center, such as a storm that was not initially warned upon, has been included.
The time stamp for each event is first stated using Coordinated Universal Time (UTC), the 24-hour clock where 00:00 = midnight UTC. [6] The NHC uses both UTC and the time zone where the center of the tropical cyclone is currently located. The time zones utilized (east to west) prior to 2020 were: Atlantic, Eastern, and Central. [7] In this timeline, the respective area time is included in parentheses. Additionally, figures for maximum sustained winds and position estimates are rounded to the nearest 5 units (miles, or kilometers), following National Hurricane Center practice. Direct wind observations are rounded to the nearest whole number. Atmospheric pressures are listed to the nearest millibar and nearest hundredth of an inch of mercury.