| Timeline of the 1995 Atlantic hurricane season | |||||
|---|---|---|---|---|---|
 Season summary map | |||||
| Season boundaries | |||||
| First system formed | June 2, 1995 | ||||
| Last system dissipated | November 1, 1995 | ||||
| Strongest system | |||||
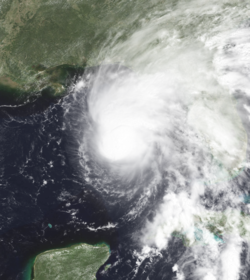
| Name | Opal | ||||
| Maximum winds | 150 mph (240 km/h) (1-minute sustained) | ||||
| Lowest pressure | 916 mbar (hPa; 27.05 inHg) | ||||
| Longest lasting system | |||||
| Name | Felix | ||||
| Duration | 14.75 days | ||||
| |||||
The 1995 Atlantic hurricane season was an event in the annual tropical cyclone season in the north Atlantic Ocean. This Atlantic hurricane season saw a near-record number of named tropical storms. This extremely active season followed four consecutive years in which there was below normal activity. [1] [nb 1] The season officially began on June 1, 1995 and ended on November 30, 1995. These dates, adopted by convention, historically describe the period in each year when most tropical systems form. [3] The season's first system, Hurricane Allison, developed on June 3; its last, Hurricane Tanya, became extratropical on November 2.
Contents
The season produced 21 tropical cyclones, of which 19 intensified into tropical storms, 11 of which became hurricanes, and five became major hurricanes. [4] [nb 2] The four most notable storms during the season were hurricanes Luis, Marilyn, Opal and Roxanne. Luis caused extensive damage in the northern Leeward Islands in excess of $2.5 billion (1995 USD). [4] Marilyn affected the same area a few days later, causing eight deaths and damages in excess of $2 billion in the U.S. Virgin Islands. [6] Opal was a strong hurricane that, after battering the Yucatán Peninsula of Mexico, cross the Gulf of Mexico and made landfall near Pensacola Beach, Florida. There were 27 hurricane-related deaths were reported in the Southeastern United States. [7] Roxanne caused widespread flooding and crop damage throughout much of the Yucatán Peninsula, and killed at least six people, due to its erratic movement. [8]
This timeline documents tropical cyclone formations, strengthening, weakening, landfalls, extratropical transitions, and dissipations during the season. It includes information that was not released throughout the season, meaning that data from post-storm reviews by the National Hurricane Center, such as a storm that was not initially warned upon, has been included.
The time stamp for each event is first stated using Coordinated Universal Time (UTC), the 24-hour clock where 00:00 = midnight UTC. [9] The NHC uses both UTC and the time zone where the center of the tropical cyclone is currently located. The time zones utilized (east to west) prior to 2020 were: Atlantic, Eastern, and Central. [10] In this timeline, the respective area time is included in parentheses. Additionally, figures for maximum sustained winds and position estimates are rounded to the nearest 5 units (miles, or kilometers), following National Hurricane Center practice. Direct wind observations are rounded to the nearest whole number. Atmospheric pressures are listed to the nearest millibar and nearest hundredth of an inch of mercury.