| Timeline of the 1993 Atlantic hurricane season | |||||
|---|---|---|---|---|---|
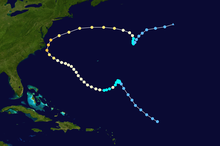
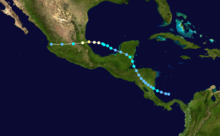
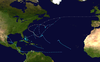
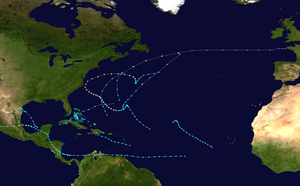 Season summary map | |||||
| Season boundaries | |||||
| First system formed | May 31, 1993 | ||||
| Last system dissipated | September 30, 1993 | ||||
| Strongest system | |||||
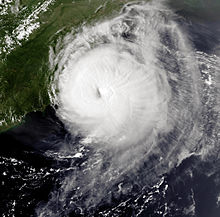
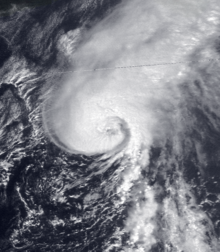
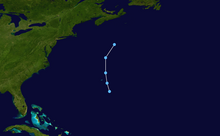
| Name | Emily | ||||
| Maximum winds | 115 mph (185 km/h) (1-minute sustained) | ||||
| Lowest pressure | 960 mbar (hPa; 28.35 inHg) | ||||
| Longest lasting system | |||||
| Name | Emily | ||||
| Duration | 14.75 days | ||||
| |||||
The 1993 Atlantic hurricane season consisted of the events that occurred in the annual cycle of tropical cyclone formation over the Atlantic Ocean north of the Equator. The official bounds of each Atlantic hurricane season are dates that conventionally delineate the period each year during which tropical cyclones tend to form in the basin according to the National Hurricane Center, beginning on June 1 and ending on November 30. [1] However, tropical cyclogenesis is possible at any time of the year, as evidenced by the development of Tropical Depression One on May 31, [2] one day before the official start of the season. By contrast, the dissipation of Tropical Depression Ten on September 30 effectively concluded the season two months before it officially ended. [1] [3] September 21 was the final date on which a system of at least tropical storm strength was active; this was described in a 1995 retrospective from Monthly Weather Review as the earliest such occurrence since 1930. [nb 1] [5] : 871 Seasonal activity was below average – of the season's 10 tropical depressions, eight strengthened further to become named tropical storms and four became hurricanes, compared to contemporary long-term averages of 10 tropical storms and six hurricanes, and modern averages of 14 tropical storms and seven hurricanes. [1] [5] : 871 Hurricane Emily was the only Atlantic major hurricane in 1993; [nb 2] this is slightly below the contemporary average of two major hurricanes per season, while modern seasons produce three on average. [1] [6]
Contents
- Timeline of events
- May
- June
- July
- August
- September
- October
- November
- Notes
- See also
- References
- External links
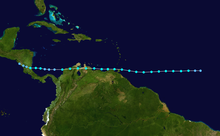
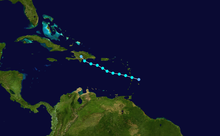
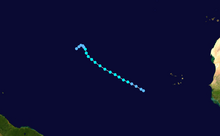
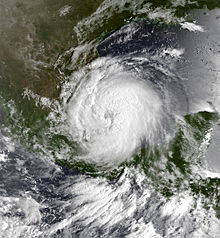
The two most impactful systems of the season were Tropical Storm Bret and Hurricane Gert; more than 300 people were killed by the combined effects of both storms. Bret became a catastrophic storm for Venezuela after extreme rainfall triggered widespread flooding and mudslides in the Caracas area, causing significant impacts in Nicaragua as well; the latter country would suffer renewed flooding from Gert just over a month later. After hitting Nicaragua, Gert—a sprawling and moisture-laden tropical cyclone—generated heavy rainfall over a large portion of Central America and Mexico. [5] : 877, 883, 885 [7] [8] Several other tropical cyclones caused extensive flooding during the season. Tropical Depression One and the precursor to Tropical Storm Arlene each killed 20 people, the former in Cuba and Haiti, [2] [9] and the latter due to a single mudslide in El Salvador. After becoming a tropical cyclone, Arlene caused considerable flood damage in South Texas and northeastern Mexico. [10] In August, Tropical Storm Cindy produced more than a foot (12 in; 30.48 cm) of rain in Martinique. [11] At the end of the month, the western eyewall of Hurricane Emily passed over the Outer Banks of North Carolina while the storm was near its peak intensity; powerful winds and record-breaking floods caused three fatalities and heavy but localized damage. [5] : 871, 881
By convention, meteorologists use one time zone, Coordinated Universal Time (UTC), when issuing forecasts and making observations; they also use the 24-hour clock, where 00:00 = midnight UTC. [12] The National Hurricane Center uses both UTC and the time zone where the center of the tropical cyclone is presently located. Prior to 2020, three time zones were utilized in forecast products for Atlantic tropical cyclones: Atlantic, Eastern, and Central, from east to west. [13]
In this timeline, all information is listed by UTC first, with the respective regional time zone included in parentheses. Additionally, figures for maximum sustained winds and position estimates are rounded to the nearest five units (knots, miles, or kilometers) and averaged over one minute, following National Hurricane Center practice. Direct wind observations are rounded to the nearest whole number. Atmospheric pressures are listed to the nearest millibar and nearest hundredth of an inch of mercury. This timeline documents tropical cyclone formations, strengthening, weakening, landfalls, extratropical transitions, and dissipations during the season. It includes information that was not released throughout the season, meaning that data from post-storm reviews by the National Hurricane Center has been included.


