Tropical cyclones in 1993

Last updated

Tropical cyclones in 1993
Year boundaries
First system Colina
FormedJanuary 13, 1993
Last system Rewa
DissipatedJanuary 23, 1994
Strongest system
Name Koryn
Lowest pressure905 mbar (hPa); 26.72 inHg
Longest lasting system
Name Rewa
Duration28 days
Year statistics
Total systems110
Named systems78
Total fatalities1997
Total damage$4.3 billion (1993 USD)
Related articles
Other years
1991, 1992, 1993, 1994, 1995
From left to right: Greg, Hilary and Irwin on August 21 Greg, Hilary, and Irwin 1993.png
From left to right: Greg, Hilary and Irwin on August 21

During 1993, tropical cyclones formed within seven different bodies of water called basins. To date, 110 tropical cyclones formed, of which 78 were given names by various weather agencies. Only one Category 5 tropical cyclone was formed in 1993. The accumulated cyclone energy (ACE) index for the 1993 (seven basins combined), as calculated by Colorado State University was 710.4 units.

Contents

Global atmospheric and hydrological conditions

A weak El Niño prevailed until the end of the year, leading to inactivity in the North Atlantic and the North Indian Ocean and an average activity in the West Pacific and the Southern Hemisphere (excluding the Australian region basin). [1]

Summary

Cyclone RewaHurricane Gert (1996)Hurricane Lidia (1993)Typhoon Yancy (1993)Hurricane Emily (1993)Hurricane Hilary (1993)Tropical Storm Cindy (1993)Hurricane Fernanda (1993)Tropical Storm Bret (1993)Typhoon Robyn (1993)Tropical Storm Percy (1993)Tropical Storm Ofelia (1993)Hurricane Calvin (1993)Tropical Storm Beatriz (1993)Tropical Storm Arlene (1993)Typhoon Koryn (1993)Tropical Depression One (1993)Cyclone PremaCyclone KinaCyclone Ninatropical cyclone basinsTropical cyclones in 1993

North Atlantic Ocean

1993 Atlantic hurricane season summary map 1993 Atlantic hurricane season summary map.png
1993 Atlantic hurricane season summary map

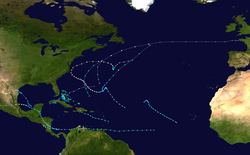
An average Atlantic hurricane season features 12 tropical storms, 6 hurricanes, and 3 major hurricanes, and features an Accumulated Cyclone Energy (ACE) count of 106. In the year, the statistics fell below, featuring only 8 tropical storms, 4 hurricanes and a major hurricane- making it a below-average season. It had an ACE total of 39.

The first tropical cyclone, Tropical Depression One, developed on May 31, while the final storm, Tropical Depression Ten, dissipated on September 30, well before the average dissipation date of a season's last tropical cyclone; this represented the earliest end to the hurricane season in ten years. The most intense hurricane, Emily, was a Category 3 on the Saffir–Simpson hurricane scale that paralleled close to the North Carolina coastline causing minor damage and a few deaths before moving out to sea.

The most significant named storm of the season was Hurricane Gert, a tropical cyclone that devastated several countries in Central America and Mexico. Throughout the impact areas, damage totaled to $170 million (1993  USD) [nb 1] and 102 fatalities were reported. The remnants of Gert reached the Pacific Ocean and was classified as Tropical Depression Fourteen-E. Another significant system was Tropical Storm Bret, which resulted in 184 deaths and $25 million in losses as it tracked generally westward across Trinidad, Venezuela, Colombia, and Nicaragua. In the Pacific Ocean, the remnants of Bret were attributed to the development of Hurricane Greg. Three other tropical cyclones brought minor to moderate effects on land; they were Tropical Depression One and Tropical Storms Arlene and Cindy. The storms of the 1993 Atlantic hurricane season collectively caused 339 fatalities and $319 million in losses.

Eastern and Central Pacific Ocean

1993 Pacific hurricane season summary map 1993 Pacific hurricane season summary.png
1993 Pacific hurricane season summary map

An average Pacific hurricane season features 15 tropical storms, 9 hurricanes, and 4 major hurricanes, and features an Accumulated Cyclone Energy (ACE) count of 132. In the year, the statistics fell above, featuring 15 tropical storms, 11 hurricanes, and 9 major hurricanes- making it a slightly above-average season. It had an ACE total of 201.8 units.

The first tropical cyclone developed on June 11, over a month after the traditional start of the season. The final named storm of the season, Tropical Storm Norma, dissipated on October 14. The Central Pacific Ocean saw very little tropical activity, with only one cyclone, Hurricane Keoni, developing in that particular region. However, many storms out of the season crossed the threshold into the Central Pacific, many as hurricanes, and even major hurricanes.

The season produced fifteen named storms, which was slightly below the average of sixteen named storms per season. However, the total of eleven hurricanes during the season was slightly above average, and the total of nine major hurricanes was significantly higher than the average of three. The most intense cyclone of the season was Hurricane Lidia, a powerful Category 4 hurricane that made landfall in Sinaloa as a Category 2. Killing seven people, Lidia also caused extensive property damage in Mexico and the United States, as the remnants of the system combined with a cold front to produce Severe weather in Texas. However, the most notable storm of the season, in terms of fatalities, was Hurricane Calvin. Originating from an area of disturbed weather on July 4, it reached a peak intensity of 110 mph (180 km/h) before making an initial landfall near Manzanillo, Colima, Mexico. Rapidly weakening due to land interaction with the Mexican coastline, the hurricane re-emerged into Pacific waters, though the storm did not strengthen, and continued to weaken as it moved northwestward. On July 8, Calvin made a second, and final, landfall on the southern tip of Baja California Peninsula before weakening to a tropical depression and dissipating on July 9. At least 34 deaths can be attributed to the system, as well as $32 million (1993 USD) or more in damage.

Western Pacific Ocean

1993 Pacific typhoon season summary map 1993 Pacific typhoon season summary.jpg
1993 Pacific typhoon season summary map

The average typhoon season lasts year-round, with the majority of the storms forming between May and October. An average Pacific typhoon season features 26 tropical storms, 16 typhoons, and 9 super typhoons (unofficial category). It also features an average Accumulated Cyclone Energy (ACE) count of approximately 294; the basin is typically the most active basin for tropical cyclone formation. The season was average when it comes to the number of tropical storms (28); however, the number of typhoons and the super typhoons were below-average, spawning 15 and 3, respectively.

Typhoon Koryn was the strongest tropical cyclone of the season, becoming a super typhoon and peaking with a pressure of 905 hPa. It caused 37 direct deaths and damages amounting to $224 million as it devastated the Philippines and the South China. Irma caused 10 fatalities as it affected the Marshall and the Caroline Islands. Robyn caused $68 million worth of damages as it affected Japan and the nearby South Korea. Yancy also affected the country, causing over 48 deaths and damages over $1 billion. Lola and Manny of December, altogether caused 538 deaths as it affected the Philippines. Nell closed the season, dissipating on January 1, 1994.

North Indian Ocean

1993 North Indian Ocean cyclone season summary map 1993 North Indian Ocean cyclone season summary.jpg
1993 North Indian Ocean cyclone season summary map

The season was the quietest on record in the basin, with only four tropical disturbances forming.

There were no storms before June, and during that month, a deep depression formed off the east coast of India. It brought flooding rains as it moved through Bangladesh and dissipated over northeastern India. The depression struck in the midst of ongoing floods, which were responsible for 200 deaths in the country in June 1993. The next depression – the only to originate over the Arabian Sea in the season – formed on November 8 and moved toward southern India. The system killed 35 people before weakening and turning to the northwest. It re-intensified into a Very Severe Cyclonic Storm, but weakened just off the coast of Pakistan due to wind shear. The storm killed 609 people in the country due to flooding. The final two depressions had their origins from the western Pacific basin. In late November, a convective system crossed the Malay Peninsula and developed into an intense tropical cyclone, reaching estimated peak winds of 165 km/h (105 mph) on December 4. While at peak intensity, the cyclone moved ashore southern India near Karaikal, causing widespread damage estimated at US$216 million (1993  USD). The storm killed 70 people and displaced at least 68,000 people. The final depression was the reformation of Typhoon Manny. It dissipated near southern India on December 20, bringing heavy rainfall to the country.

South-West Indian Ocean

1992-1993 South-West Indian Ocean cyclone season summary.jpg
1992–93 South-West Indian Ocean cyclone season summary map
1993-1994 South-West Indian Ocean cyclone season summary.jpg
1993–94 South-West Indian Ocean cyclone season summary map

January–June

The 1992–93 South-West Indian Ocean cyclone season lasted longer than normal, with the first storm, Aviona forming on September 27, 1992 and the final storm Konita not dissipating until May 7, 1993. It was an above-average season, with four tropical cyclones the equivalent of a minimal hurricane along with six tropical storms, one subtropical depression, and several depressions including one that was named.

At the time, the season officially went from November 15, 1991, to April 30, 1992, [2] although this season began in September with the formation of Tropical Storm Aviona in the northeastern portion of the basin. A month later, Tropical Storm Babie also formed in the northeastern portion of the basin before the season's official start. After several depressions formed in December and early January, Cyclone Colina formed and struck Réunion, which damaged houses and killed 2 people and left 12 missing there. Three storms were active at the same time in the middle of January, including Colina Tropical Storm Dessilia moved across Madagascar with gusty winds, and Cyclone Edwina was the longest-lasting and strongest storm of the season. Edwina brushed the Mascarene Islands with gusty winds and light rainfall. In mid-February, Tropical Storm Finella brought locally heavy rainfall to Réunion, reaching 1,074 mm (42.3 in) along the island's east coast and causing minimal rainfall along the southern coast. The Intertropical Convergence Zone (ITCZ) became active toward the end of February, spawning tropical storms Gracia and Ionia as well as Tropical Depression Hutelle. Ionia, the last of five system to cross Madagascar during the season, killed eight people in the country. The season ended with Cyclone Jourdanne, which was the second-strongest storm of the season in April, and Cyclone Konita in May.

July–December

Alexina formed as a tropical disturbance on November 9, starting the season. It then dissipated on November 14 without affecting any landmasses. Bettina also formed in the same month, without affecting land as it dissipated. A tropical disturbance and Cecilia formed on the month of December, with the latter ending the 1993 season.

Australian region

1992-1993 Australian cyclone season summary.jpg
1992–93 Australian region cyclone season summary Map
1993-1994 Australian cyclone season summary.jpg
1993–94 Australian region cyclone season summary Map

January–June

A below-average tropical cyclone season, the basin produced 6 storms. Nina persisted until January 1, shortly before exiting the region. The entire cyclones of the month didn't cause any deaths or damages, however, Adel left two fatalities and fifteen missing as it passed on the north coast of Papua New Guinea, a rare occurrence.

July–December

Naomi started the season when it formed on December 14. It affected Western Australia and the damages or deaths are unknown. Cyclone Rewa took an unusual and erratic track near the coast of Queensland, forming on December 26 in the South Pacific basin and dissipating on January 21 in the next year, on the Australian region. Oscar ended the 1993 season, dissipating on January 9 near the coast of the Western Australia.

South Pacific Ocean

1992-1993 South Pacific cyclone season summary.jpg
1992–93 South Pacific cyclone season summary Map
1993-1994 South Pacific cyclone season summary.jpg
1993–94 South Pacific cyclone season summary Map

January–June

July–December

Systems

January

Cyclone Edwina ITC Edwina 1993.jpg
Cyclone Edwina

In January 1993, seven cyclones formed within their respective basins. The strongest cyclone of the season was Cyclone Edwina, which affected the islands of Rodrigues, Mauritius, and Réunion; however, it caused no impacts throughout its life. Cyclone Colina and Tropical Storm Dessilia also existed during this time, with the former affecting the Mascarene Islands and Seychelles as a tropical cyclone, killing two.

In the Australian region, only Cyclone Lena formed during this month, affecting Western Australia. Towards the South Pacific basin, three cyclones existed during the month including two tropical depressions and Lin. Lin was a tropical cyclone that affected the Samoan Islands, Niue, Fiji, and Tonga, causing an unknown number of damages and deaths.

Tropical cyclones formed in January 1993
Storm nameDates activeMax wind
km/h (mph)
Pressure
(hPa)
Areas affectedDamage
(USD)
DeathsRefs
08P January 1–385 (50)Not specified Cook Islands NoneNone
09P January 11–14Not specifiedNot specified French Polynesia NoneNone
Colina January 13–20135 (85)970 Mascarene Islands, Seychelles Unknown2 [3]
Dessilia January 16–2495 (60)975 Juan de Nova Island, Madagascar, Réunion UnknownUnknown
Edwina January 19–29170 (105)925 Île Amsterdam NoneNone
Lena January 22 – February 2100 (65)972 Western Australia UnknownNone
Lin January 30 – February 5120 (75)970 Samoan Islands, Fiji, Niue, Tonga UnknownUnknown

February

Cyclone Oliver Oliver Feb 7 1993 0510Z.png
Cyclone Oliver
Tropical cyclones formed in February 1993
Storm nameDates activeMax wind
km/h (mph)
Pressure
(hPa)
Areas affectedDamage
(USD)
DeathsRefs
Oliver February 3 – 14185 (115)950 Papua New Guinea, Far North Queensland UnknownUnknown
Mick February 3 – 985 (50)987 Fiji, Samoan Islands, New Zealand, Tonga MinimalUnknown
Nisha February 9 – 16110 (70)975 Cook Islands NoneNone
Finella February 12 – 1580 (50)984 Mascarene Islands NoneNone
Oli February 14 – 2075 (45)990 Vanuatu, Fiji UnknownUnknown
Gracia February 20 – 2370 (45)990 Mayotte, Madagascar UnknownNone
H1 February 24 – 26Not specifiedNot specifiedNoneNone
Hutelle February 27 – March 2Not specifiedNot specified Réunion, Madagascar NoneNone
Polly February 27 – March 9155 (100)945 Solomon Islands, New Caledonia, New Zealand UnknownUnknown
01W (Atring) February 28 – March 155 (35)1010 Philippines NoneNone

March

Cyclone Prema Prema 29 March 1993.jpg
Cyclone Prema
Tropical cyclones formed in March 1993
Storm nameDates activeMax wind
km/h (mph)
Pressure
(hPa)
Areas affectedDamage
(USD)
DeathsRefs
Ionia March 2–765 (40)993 Madagascar Minimal8
Irma March 7–1795 (60)985NoneNoneNone
Roger March 12–20110 (70)980NoneNoneNone
Prema March 24 – April 6185 (115)940 Vanuatu, New Caledonia $5 million3

April

Cyclone Jourdanne Jourdanne Apr 6 1993 0219Z.png
Cyclone Jourdanne
Tropical cyclones formed in April 1993
Storm nameDates activeMax wind
km/h (mph)
Pressure
(hPa)
Areas affectedDamage
(USD)
DeathsRefs
Jourdanne April 2–10165 (105)930NoneNoneNone
Monty April 6–13110 (70)992NoneNoneNone
Bining April 9–1355 (35)1002 Caroline Islands, Philippines NoneNone
Kuring April 19–2655 (35)1008 Caroline Islands, Philippines NoneNone

May

Cyclone Konita Konita May 5 1993 1109Z.png
Cyclone Konita
Tropical cyclones formed in May 1993
Storm nameDates activeMax wind
km/h (mph)
Pressure
(hPa)
Areas affectedDamage
(USD)
DeathsRefs
Konita May 2–7130 (80)955NoneNoneNone
Daling May 2–445 (30)1006 Philippines NoneNone
Adel May 11–16120 (70)970 Papua New Guinea Minimal3
Jack May 16–2265 (40)1008 Caroline Islands, Mariana Islands NoneNone
One May 31 – June 255 (35)999 Cuba, Jamaica, Haiti, Florida, The Bahamas Unknown20

June

Typhoon Koryn Koryn 1993-06-24 0900Z.png
Typhoon Koryn
Tropical cyclones formed in June 1993
Storm nameDates activeMax wind
km/h (mph)
Pressure
(hPa)
Areas affectedDamage
(USD)
DeathsRefs
Adrian June 11–19130 (80)979NoneNoneNone
Koryn (Goring) June 16–29195 (120)905 Caroline Islands, Philippines, China $224 million37
Elang June 17–2055 (35)1008 Philippines NoneNone
BOB 01 June 17–1955 (35)988 India, Bangladesh Heavy200
Arlene June 18–2165 (40)1000 Central America, Mexico, Gulf Coast of the United States $60.8 million26
Beatriz June 18–20100 (65)995Southwestern Mexico Unknown6
Three-E June 27 – July 255 (35)1006Southwestern Mexico, Baja California Sur MinimalNone

July

Hurricane Dora Dora 16 July 1993.jpg
Hurricane Dora
Tropical cyclones formed in July 1993
Storm nameDates activeMax wind
km/h (mph)
Pressure
(hPa)
Areas affectedDamage
(USD)
DeathsRefs
Calvin July 4–9175 (110)966Western Mexico, Baja California Sur $32 million37
Lewis (Huling) July 7–1395 (60)985 Philippines, South China, Vietnam UnknownUnknown
TD July 13Un­known1002 South China NoneNone
Marian (Ibiang) July 14–1675 (45)1000NoneNoneNone
Dora July 14–21215 (130)945NoneNoneNone
Eugene July 15–25205 (125)948NoneNoneNone
TD July 17–22Un­known1008NoneNoneNone
Nathan July 19–25100 (65)980 Mariana Islands, Japan UnknownUnknown
TD July 21Un­known1008NoneNoneNone
Ofelia (Luming) July 24–2785 (50)990 Japan UnknownUnknown
Percy (Miling) July 27–30100 (65)980 Mariana Islands, Japan UnknownUnknown
Narsing July 30–3155 (35)1000NoneNoneNone
TD July 31Un­known1002 Philippines, Taiwan NoneNone

August

Typhoon Yancy Yancy Sept 2 1993 0701Z.png
Typhoon Yancy
Tropical cyclones formed in August 1993
Storm nameDates activeMax wind
km/h (mph)
Pressure
(hPa)
Areas affectedDamage
(USD)
DeathsRefs
Robyn (Openg) August 1–11155 (100)940 Caroline Islands, Mariana Islands, Japan, South Korea $68 million45
Keoni August 9 – September 1165 (105)940NoneNoneNone
Fernanda August 9–19230 (145)934 Hawaii $5 millionNone
Bret August 4–1165 (40)1000 Trinidad and Tobago, Grenada, ABC islands, Venezuela, Colombia, Central America $37.5 million213
Steve (Pining) August 6–14100 (65)980 Mariana Islands, Ryukyu Islands NoneNone
15W August 13–1445 (30)1002 Marshall Islands NoneNone
Tasha (Rubing) August 15–22120 (75)970 Philippines, China NoneNone
Cindy August 14–1775 (45)1007 Lesser Antilles, Puerto Rico, Dominican Republic $19 million4
Greg August 15–28215 (130)948NoneNoneNone
Hillary August 17–27195 (120)957 Baja California Sur, California, Iowa NoneNone
Vernon August 21–28140 (85)960 Japan Minimal2
Winona (Saling) August 22–2975 (45)990 Philippines, Vietnam UnknownUnknown
Irwin August 21–22110 (70)999Southwestern Mexico NoneNone
Emily August 22 – September 6185 (115)960 East Coast of the United States, Bermuda $35 million3
TD August 23–251002 Mariana Islands NoneNone
Dennis August 23–2885 (50)1000NoneNoneNone
Yancy (Tasing) August 29 – September 4175 (110)925 Japan $1.67 billion48
Jova August 29 – September 5215 (130)948Southwestern Mexico NoneNone

September

Hurricane Lidia Lidia 1993-09-11 0600Z.jpg
Hurricane Lidia
Tropical cyclones formed in February 1993
Storm nameDates activeMax wind
km/h (mph)
Pressure
(hPa)
Areas affectedDamage
(USD)
DeathsRefs
Zola (Unsing) September 5–995 (60)985 Japan NoneNone
Kenneth September 5–17240 (150)932NoneNoneNone
Floyd September 7–10120 (75)990 Newfoundland and Labrador MinimalNone
TD September 7–81006 Philippines NoneNone
Lidia September 8–14240 (150)930Southwestern Mexico, California $8 million7
Abe (Walding) September 9–15155 (100)940 Philippines, Taiwan, China UnknownNone
Becky (Yeyeng) September 13–18120 (75)980 Philippines, South China None1
Gert September 14–21155 (100)970 Central America, Mexico $170 million116
Harvey September 18–21120 (75)990NoneNoneNone
Dot (Anding) September 20–27140 (85)965 Philippines, China UnknownNone
Fourteen-E September 21–2555 (35)1002Southwestern Mexico NoneNone
Cecil September 23–27155 (100)940 Mariana Islands NoneNone
Binang September 251004NoneNoneNone
Ten September 29–3055 (35)1008NoneNoneNone
Max September 30 – October 475 (45)1000NoneNoneNone

October

Typhoon Ed Ed Oct 4 1993 1009Z.png
Typhoon Ed
Tropical cyclones formed in October 1993
Storm nameDates activeMax wind
km/h (mph)
Pressure
(hPa)
Areas affectedDamage
(USD)
DeathsRefs
Ed (Dinang) October 1–8185 (115)915 Caroline Islands, Mariana Islands NoneNone
Flo (Kadiang) October 1–8120 (75)970 Philippines, Ryukyu Islands $188 million576
Norma October 2–675 (45)1000NoneNoneNone
Epang October 6–1345 (30)1002 Philippines, South China NoneNone
Gene (Gundang) October 7–1065 (40)998 Caroline Islands NoneNone
Seventeen-E October 11–1455 (35)1009NoneNoneNone
Hattie October 19–2595 (60)980 Marshall Islands NoneNone
TD October 22992NoneNoneNone
Ira (Husing) October 27 – November 5150 (90)950 Caroline Islands, Mariana Islands, Philippines, China UnknownUnknown

November

Typhoon Kyle Kyle Nov 23 1993 0843Z.png
Typhoon Kyle
Tropical cyclones formed in November 1993
Storm nameDates activeMax wind
km/h (mph)
Pressure
(hPa)
Areas affectedDamage
(USD)
DeathsRefs
Jeana November 5–1085 (50)992 Caroline Islands NoneNone
ARB 01/02 November 8–16120 (75)986 India, Pakistan Unknown644
Alexina November 9–1485 (50)982NoneNoneNone
Indang November 12–1345 (30)1008 Philippines NoneNone
32W November 13–1645 (30)1002 Caroline Islands NoneNone
33W November 17–1945 (30)1002 Marshall Islands NoneNone
Bettina November 25 – December 2110 (70)970NoneNoneNone
Kyle (Luring) November 17–24130 (80)960 Philippines, Vietnam, Cambodia $1.5 million110

December

Cyclone Rewa Rewa jan 16 1994 0555Z.jpg
Cyclone Rewa
Tropical cyclones formed in December 1993
Storm nameDates activeMax wind
km/h (mph)
Pressure
(hPa)
Areas affectedDamage
(USD)
DeathsRefs
BOB 02 December 1–4165 (105)968 India $216 million70
Lola (Monang) December 1–9150 (90)955 Caroline Islands, Philippines, Vietnam, Cambodia $261 million370
Manny (Naning) December 3–16140 (85)955 Philippines, Vietnam, Thailand $50 million245
Cecilia December 12–21100 (65)972 Mauritius NoneNone
Oning December 14–1655 (35)1004 Philippines NoneNone
Naomi December 14–18140 (85)960 Western Australia MinimalNone
BOB 03 December 19–2055 (35)1006Southern India NoneNone
Nell (Puring) December 21–31110 (70)975 Philippines NoneNone
Rewa December 26, 1993 – January 23, 1994205 (125)920 Melanesia, Eastern Australia, New Zealand Unknown20
Oscar December 28, 1993 – January 9, 199465 (40)995 Northern Territory, Western Australia NoneNone

Global effects

There are a total of 9 tropical cyclone basins, 7 are seasonal and two are non-seasonal, thus all 8 basins except the Mediterranean are active. In this table, data from all these basins are added.

Season nameAreas affectedSystems formedNamed stormsDamage (USD)Deaths
1993 Atlantic hurricane season
1993 Pacific hurricane season
1993 Pacific typhoon season
1993 North Indian Ocean cyclone season
1992–93 South-West Indian Ocean cyclone season
1993–94 South-West Indian Ocean cyclone season
1992–93 Australian region cyclone season
1993–94 Australian region cyclone season
1992–93 South Pacific cyclone season
1993–94 South Pacific cyclone season

See also

Notes

2 Only systems that formed either on or after January 1, 1993 are counted in the seasonal totals.
3 Only systems that formed either before or on December 31, 1993 are counted in the seasonal totals.
4 The wind speeds for this tropical cyclone/basin are based on the IMD Scale which uses 3-minute sustained winds.
5 The wind speeds for this tropical cyclone/basin are based on the Saffir Simpson Scale which uses 1-minute sustained winds.
6The wind speeds for this tropical cyclone are based on Météo-France which uses wind gusts.

  1. All damage figures are in 1993 USD, unless otherwise noted

Related Research Articles

<span class="mw-page-title-main">1996 Pacific typhoon season</span> Typhoon season in the Western Pacific Ocean

The 1996 Pacific typhoon season has no official bounds; it ran year-round in 1996, but most tropical cyclones tend to form in the northwestern Pacific Ocean between May and November. These dates conventionally delimit the period of each year when most tropical cyclones form in the northwestern Pacific Ocean.

<span class="mw-page-title-main">1993 Pacific typhoon season</span> Typhoon season in the Western Pacific Ocean

The 1993 Pacific typhoon season was the most active season for the Philippines. The season had no official bounds; it ran year-round in 1993, but most tropical cyclones tend to form in the northwestern Pacific Ocean between May and November. These dates conventionally delimit the period of each year when most tropical cyclones form in the northwestern Pacific Ocean.

<span class="mw-page-title-main">1992 Pacific typhoon season</span> Typhoon season in the Western Pacific Ocean

The 1992 Pacific typhoon season had no official bounds; it ran year-round in 1992. Despite this, most tropical cyclones tend to form in the northwestern Pacific Ocean between May and November. These dates conventionally delimit the period of each year when most tropical cyclones form in the northwestern Pacific Ocean.

<span class="mw-page-title-main">1970 Pacific typhoon season</span> Typhoon season in the Pacific Ocean

The 1970 Pacific typhoon season has no official bounds; it ran year-round in 1970, but most tropical cyclones tend to form in the northwestern Pacific Ocean between June and December. These dates conventionally delimit the period of each year when most tropical cyclones form in the northwestern Pacific Ocean.

<span class="mw-page-title-main">1975 Pacific typhoon season</span>

The 1975 Pacific typhoon season was one of the deadliest tropical cyclone seasons on record, with nearly 229,000 fatalities occurring during the season. It had no official bounds; it ran year-round in 1975, but most tropical cyclones tend to form in the northwestern Pacific Ocean between June and December. These dates conventionally delimit the period of each year when most tropical cyclones form in the northwestern Pacific Ocean.

<span class="mw-page-title-main">1974 Pacific typhoon season</span> Typhoon season in the Pacific Ocean

The 1974 Pacific typhoon season was the first season on record to not feature a Category 5 equivalent super typhoon; a feat later repeated by the 1977 and 2017 seasons. Even so, the season was overly active, with 32 tropical storms and 16 typhoons being developed this year. It has no official bounds; it ran year-round in 1974, but most tropical cyclones tend to form in the northwestern Pacific Ocean between June and December. These dates conventionally delimit the period of each year when most tropical cyclones form in the northwestern Pacific Ocean.

<span class="mw-page-title-main">1999 North Indian Ocean cyclone season</span> Cyclone season in the North Indian ocean

The 1999 North Indian Ocean cyclone season was an event in the annual cycle of tropical cyclone formation. The North Indian Ocean cyclone season has no official bounds, but cyclones tend to form between April and December, with peaks in May and November. These dates conventionally delimit the period of each year when most tropical cyclones form in the northern Indian Ocean.

<span class="mw-page-title-main">Tropical cyclones in 2005</span>

During 2005, tropical cyclones formed within seven different tropical cyclone basins, located within various parts of the Atlantic, Pacific and Indian Oceans. During the year, a total of 141 systems formed with 94 of these developing further and were named by the responsible warning centre. The strongest tropical cyclone of the year was Hurricane Wilma, which was estimated to have a minimum barometric pressure of 882 hPa (26.05 inHg). 2005 was above-average in terms of the number of storms. The most active basin in the year was the North Atlantic, which documented 28 named systems. The Western Pacific had an near-average season with 23 named storms. The Eastern Pacific hurricane season experienced an above-average number of tropical storm intensity systems, numbering 15. Activity across the southern hemisphere's three basins – South-West Indian, Australian, and South Pacific – was fairly significant, with the regions recording 23 named storms altogether, with the most intense Southern Hemisphere cyclone of the year, Cyclone Percy from the South Pacific Ocean basin peaking at 145 mph (235 km/h) and 900 millibars. Throughout the year, 28 Category 3 tropical cyclones formed, including eight Category 5 tropical cyclones in the year. The accumulated cyclone energy (ACE) index for the 2005, as calculated by Colorado State University was 899.6 units.

<span class="mw-page-title-main">Tropical cyclones in 2007</span>

During 2007, tropical cyclones formed within seven different tropical cyclone basins, located within various parts of the Atlantic, Pacific and Indian Oceans. During the year, a total of 129 systems formed with 79 of these developing further and were named by the responsible warning centre. The strongest tropical cyclone of the year was Cyclone George, which was estimated to have a minimum barometric pressure of 902 hPa (26.64 inHg). The deadliest tropical cyclone of the year was Cyclone Sidr in the North Indian Ocean which killed 15,000 people in Bangladesh. The costliest tropical cyclone of the year was Cyclone Gonu in the North Indian Ocean, which caused more than $4.41 billion in damage after striking Oman, United Arab Emirates, Iran and Pakistan. The most active basin in the year was the Western Pacific, which documented 24 named systems. The North Atlantic had an above-average season with 15 named storms. The Eastern Pacific hurricane season experienced a below-average number of tropical storm intensity systems, numbering 11. Activity across the Southern Hemisphere's three basins – South-West Indian, Australian, and South Pacific – was fairly significant, with the regions recording 25 named storms altogether, with the most intense storm of the year coming from the Australian basin. Throughout 2007, twenty one major tropical cyclones formed, including five Category 5 tropical cyclones in the year. The accumulated cyclone energy (ACE) index for the 2007, as calculated by Colorado State University was 568.1 units.

<span class="mw-page-title-main">Tropical cyclones in 2018</span>

During 2018, tropical cyclones formed within seven different tropical cyclone basins, located within various parts of the Atlantic, Pacific and Indian Oceans. During the year, a total of 151 tropical cyclones had formed this year to date. 102 tropical cyclones were named by either a Regional Specialized Meteorological Center (RSMC) or a Tropical Cyclone Warning Center (TCWC).

<span class="mw-page-title-main">Tropical cyclones in 2017</span>

During 2017, tropical cyclones formed within seven different tropical cyclone basins, located within various parts of the Atlantic, Pacific and Indian Oceans. During the year, a total of 146 tropical cyclones had formed. 88 tropical cyclones had been named by either a Regional Specialized Meteorological Center (RSMC) or a Tropical Cyclone Warning Center (TCWC).

<span class="mw-page-title-main">Tropical cyclones in 2019</span>

During 2019, tropical cyclones formed within seven different tropical cyclone basins, located within various parts of the Atlantic, Pacific and Indian Oceans. During the year, a total of 142 systems formed with 100 of these developing further and were named by the responsible warning centre. The strongest tropical cyclone of the year was Typhoon Halong, which was estimated to have a minimum barometric pressure of 905 hPa (26.72 inHg). Halong also had the highest 1-minute sustained winds of the year, at 305 kilometres per hour (190 mph).

<span class="mw-page-title-main">Tropical cyclones in 2020</span>

During 2020, tropical cyclones formed within seven different tropical cyclone basins, located within various parts of the Atlantic, Pacific and Indian Oceans. During the year, 141 tropical cyclones formed in bodies of water known as tropical cyclone basins. Of these, 104, including three subtropical cyclones in the South Atlantic Ocean and three tropical-like cyclones in the Mediterranean, were named by various weather agencies when they attained maximum sustained winds of 35 knots. The strongest storm of the year was Typhoon Goni, peaking with a pressure of 905 hPa (26.72 inHg) and with 10-minute sustained winds of 220 km/h (140 mph). The deadliest storm of the year was Hurricane Eta which caused 175 fatalities and another 100+ to be missing in Central America and the US, while the costliest storm of the year was Hurricane Laura, with a damage cost around $19.1 billion in the Greater Antilles, The Bahamas, and the Gulf Coast of the United States.

<span class="mw-page-title-main">Tropical cyclones in 2009</span>

Throughout 2009, 130 tropical cyclones formed in bodies of water known as tropical cyclone basins. Of these, 81 were named, including a subtropical cyclone in the South Atlantic Ocean, by various weather agencies when they attained maximum sustained winds of 35 knots. The strongest storm of the year was Typhoon Nida in the Western Pacific Ocean. The deadliest and costliest storm of the year was Typhoon Morakot (Kiko) causing 789 fatalities through its track in the Philippines, Japan, Taiwan, China, and the Korean peninsula. Throughout the year, twenty-one Category 3 tropical cyclones formed, including five Category 5 tropical cyclones in the year. The accumulated cyclone energy (ACE) index for the 2009, as calculated by Colorado State University was 609.6 units.

<span class="mw-page-title-main">Tropical cyclones in 2000</span>

During 2000, tropical cyclones formed in seven different areas called basins, located within various parts of the Atlantic, Pacific, and Indian Oceans. A total of 140 tropical cyclones formed within bodies of water known as tropical cyclone basins, with 81 of them being further named by their responsible weather agencies when they attained maximum sustained winds of 35 knots. The strongest storm of the year was Cyclone Hudah, peaking with a minimum pressure of 905 hPa (26.72 inHg), and with 10-minute sustained winds of 220 km/h (135 mph). The highest confirmed number of deaths from a storm was from Typhoon Kai-tak, which killed 188 people, however, Leon–Eline may have killed up to 722 people. The costliest storm was Saomai, which caused $6.3 billion in damage. The accumulated cyclone energy (ACE) index for the 2000, as calculated by Colorado State University was 677.3 units.

<span class="mw-page-title-main">Tropical cyclones in 1999</span>

During 1999, tropical cyclones formed within seven different bodies of water called basins. To date, 142 tropical cyclones formed in bodies of water known as tropical cyclone basins, of which 72 were given names by various weather agencies. The strongest tropical cyclone of the year was Gwenda, attaining maximum sustained winds of 120 knots and a pressure of 900 hPa (26.58 inHg), later tied with Inigo in 2003. Floyd was the costliest tropical cyclone of the year, with around $6.5 billion worth of damages as it affected the Bahamas, the East Coast of the United States, and the Atlantic Canada. The deadliest cyclone of this year was the 1999 Odisha cyclone, which was blamed for over 9,667 deaths as it devastated India. It was also the strongest Northern Hemisphere cyclone of the year with the pressure of 912 hPa (26.93 inHg) and third most intense tropical cyclone worldwide next to Cyclone Gwenda and Cyclone Vance. Three Category 5 tropical cyclones were formed in 1999. The accumulated cyclone energy (ACE) index for the 1999, as calculated by Colorado State University was 606.4 units.

<span class="mw-page-title-main">Tropical cyclones in 1998</span>

During 1998, tropical cyclones formed within seven different tropical cyclone basins, located within various parts of the Atlantic, Pacific, and Indian Oceans. A total of 125 tropical cyclones formed, with 72 of them being named by various weather agencies when they attained maximum sustained winds of 35 knots. The strongest tropical cyclones were Zeb, Ron and Susan which peaked with a pressure of 900 hPa (26.58 inHg). Hurricane Mitch of late October was the deadliest tropical cyclone, killing 11,000 people as it catastrophically affected Central America, and Mexico as a Category 5 major hurricane. Meanwhile, Georges became the costliest, with the damages amounting to $9.37 billion, which also became the costliest in the history of the Dominican Republic and the country of Saint Kitts and Nevis. Throughout the year, four Category 5 tropical cyclones formed. The accumulated cyclone energy (ACE) index for the 1998, as calculated by Colorado State University was 773.1 units.

<span class="mw-page-title-main">Tropical cyclones in 1996</span>

During 1996, tropical cyclones formed within seven different tropical cyclone basins, located within various parts of the Atlantic, Pacific, and Indian Oceans. During the year, a total of 139 tropical cyclones formed in bodies of water known as tropical cyclone basins. 90 of them were named by various weather agencies when they attained maximum sustained windS of 35 knots. The strongest tropical cyclone of the year was Cyclone Daniella, peaking with a pressure of 915 hPa (27.02 inHg) in the open waters of the Indian Ocean. Hurricane Fran and Typhoon Herb tie for the costliest storm of the year, both with a damage cost of $5 billion. The deadliest tropical cyclone of the year was the 1996 Andhra Pradesh cyclone, which was blamed for over 1,000 fatalities as it directly affected the state of Andhra Pradesh in India. Five Category 5 tropical cyclones were formed in 1996. The accumulated cyclone energy (ACE) index for the 1996, as calculated by Colorado State University was 960 units.

<span class="mw-page-title-main">Tropical cyclones in 2021</span>

During 2021, tropical cyclones formed in seven major bodies of water, commonly known as tropical cyclone basins. Tropical cyclones will be assigned names by various weather agencies if they attain maximum sustained winds of 35 knots. During the year, one hundred forty-five systems have formed and ninety-one were named, including one subtropical depression and excluding one system, which was unofficial. One storm was given two names by the same RSMC. The most intense storm of the year was Typhoon Surigae, with maximum 10-minute sustained wind speeds of 220 km/h (140 mph) and a minimum pressure of 895 hPa (26.43 inHg). The deadliest tropical cyclone was Typhoon Rai, which caused 410 fatalities in the Philippines and 1 in Vietnam, while the costliest was Hurricane Ida, which caused an estimated $75.25 billion USD in damage after striking Louisiana and the Northeastern United States. Six Category 5 tropical cyclones formed during the year, tying 2003. The accumulated cyclone energy (ACE) index for the 2021, as calculated by Colorado State University (CSU) was 621.1 units overall.

<span class="mw-page-title-main">Tropical cyclones in 2022</span>

During 2022, tropical cyclones formed in seven major bodies of water, commonly known as tropical cyclone basins. Tropical cyclones were named by various weather agencies when they attained maximum sustained winds of 35 knots. During the year, 133 systems formed, of which 87 were named. The strongest storm to form was Typhoon Nanmadol, with minimum pressure of 910 hPa (26.87 inHg). The deadliest tropical cyclone was Tropical Storm Megi, which caused 214 fatalities in the Philippines, while the costliest was Hurricane Ian, which had an estimated damage total of at least $113.1 billion after affecting Trinidad and Tobago, Venezuela, Colombia, the western part of the Greater Antilles and Southeast United States. Throughout 2022, eighteen major tropical cyclones formed, including three Category 5 tropical cyclones Saffir–Simpson scale (SSHWS) during the year. The accumulated cyclone energy (ACE) index for the 2022, as calculated by Colorado State University (CSU) was 559.6 units overall.

References

  1. What is La Niña? (Report). National Oceanic and Atmospheric Administration. Retrieved February 3, 2021.
  2. Neal Dorst; Anne-Claire Fontan. When is the hurricane season for each basin? (Report). Météo France. Retrieved 2014-01-01.
  3. "Meteorology". Journal of Meteorology. Artetech International. 18. 1993. Retrieved 2014-04-21.

Regional Specialized Meteorological Centers

Tropical Cyclone Warning Centers

PD-icon.svg This article incorporates public domain material from websites or documents of the National Weather Service .