This article is missing information about systems from July to October.(December 2025) |
| Tropical cyclones in 1994 | |
|---|---|
| Year boundaries | |
| First system | 01W (Akang) |
| Formed | January 4, 1994 |
| Last system | Christelle |
| Dissipated | January 11, 1995 |
| Strongest system | |
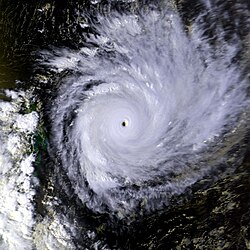
| Name | Geralda |
| Lowest pressure | 905 mbar (hPa); 26.72 inHg |
| Longest lasting system | |
| Name | John (Second longest-lasting tropical system on record) |
| Duration | 31 days |
| Year statistics | |
| Total systems | 124 |
| Named systems | 91 |
| Total fatalities | 3,733 total |
| Total damage | $11.2 billion (1994 USD) |
During 1994, tropical cyclones formed within seven different tropical cyclone basins, located within various parts of the Atlantic, Pacific and Indian Oceans. During the year, a total of 124 systems formed with 91 of these developing further and were named by the responsible warning centre. The strongest tropical cyclone of the year was Cyclone Geralda, which was estimated to have a minimum barometric pressure of 905 hPa (26.72 inHg ). The deadliest tropical cyclone was Typhoon Fred, which caused 1,248 fatalities in China, while the costliest was Tropical Storm Sharon, which caused an estimated $5.27 billion USD in damage after striking Hong Kong, China and the Philippines. Five Category 5 tropical cyclones formed in 1994. The accumulated cyclone energy (ACE) index for 1994 (seven basins combined), as calculated by Colorado State University was 1019 units.
Contents
- Global conditions and hydrological summary
- Summary
- Systems
- January
- February
- March
- April
- May
- June
- November
- December
- Global effects
- Notes
- References
- External links
Tropical cyclone activity in each basin is under the authority of an RSMC. The National Hurricane Center (NHC) is responsible for tropical cyclones in the North Atlantic and East Pacific. The Central Pacific Hurricane Center (CPHC) is responsible for tropical cyclones in the Central Pacific. Both the NHC and CPHC are subdivisions of the National Weather Service. Activity in the West Pacific is monitored by the Japan Meteorological Agency (JMA). Systems in the North Indian Ocean are monitored by the India Meteorological Department (IMD). The Météo-France located in Réunion (MFR) monitors tropical activity in the South-West Indian Ocean. The Australian region is monitored by five TCWCs that are under the coordination of the Australian Bureau of Meteorology (BOM). Similarly, the South Pacific is monitored by both the Fiji Meteorological Service (FMS) and the Meteorological Service of New Zealand Limited. Other, unofficial agencies that provide additional guidance in tropical cyclone monitoring include the Philippine Atmospheric, Geophysical and Astronomical Services Administration (PAGASA) and the Joint Typhoon Warning Center (JTWC).


