1994 Pacific hurricane season

Last updated

1994 Pacific hurricane season
1994 Pacific hurricane season summary.png
Season summary map
Seasonal boundaries
First system formedJune 18, 1994
Last system dissipatedOctober 26, 1994
Strongest storm
By maximum sustained winds John
  Maximum winds175 mph (280 km/h)
(1-minute sustained)
  Lowest pressure929 mbar (hPa; 27.43 inHg)
By central pressure Gilma
  Maximum winds160 mph (260 km/h)
(1-minute sustained)
  Lowest pressure920 mbar (hPa; 27.17 inHg)
Seasonal statistics
Total depressions22 official, 2 unofficial
Total storms20
Hurricanes10
Major hurricanes
(Cat. 3+)
5
Total fatalities4 total
Total damage$720 million (1994 USD)
Related articles
Pacific hurricane seasons
1992, 1993, 1994, 1995, 1996

The 1994 Pacific hurricane season was the final season of the eastern north Pacific's consecutive active hurricane seasons that started in 1982. The season officially started on May 15, 1994, in the eastern Pacific, and on June 1, 1994, in the central Pacific, and lasted until November 30, 1994. These dates conventionally delimit the period of each year when most tropical cyclones form in the northeastern Pacific Ocean. The first tropical cyclone formed on June 18, while the last system dissipated on October 26. [1] This season, twenty-two tropical cyclones formed in the north Pacific Ocean east of the dateline, with all but two becoming tropical storms or hurricanes. A total of 10 hurricanes occurred, including five major hurricanes. The above average activity in 1994 was attributed to the formation of the 1994–95 El Niño.

Contents

Of note in this season is an unusual spree of very intense storms; the season was the first on record to see three Category 5 hurricanes, later tied in 2002 and 2018. Hurricanes Emilia, Gilma, John, and Olivia all reached a pressure below 930  millibars. Hurricane John was the farthest-traveling tropical cyclone on record at 13,180 km (8,190 mi). Elsewhere, Hurricane Rosa caused four casualties in Mexico as the basin's only landfalling tropical storm or hurricane, and later was responsible for flooding in Texas.

Season summary

Hurricane Rosa (1994)Hurricane John (1994)Hurricane Gilma (1994)Hurricane Emilia (1994)Saffir-Simpson Hurricane Scale1994 Pacific hurricane season

This season, twenty-two tropical cyclones formed in the north Pacific Ocean east of the dateline. All but two of them became tropical storms or hurricanes. In the Eastern Pacific region (140°W to North America), nineteen tropical depressions formed, of which seventeen became tropical storms, nine further intensifying into hurricanes, and five ultimately reaching major hurricanes of Category 3 intensity or higher on the Saffir–Simpson scale. [1] These numbers are slightly above the long-term averages of fifteen tropical storms, nine hurricanes, and four major hurricanes. [2]

In the Central Pacific Hurricane Center's area of responsibility (140°W to the International Date Line), three depressions, two tropical storms, and one hurricane formed. Overall, there were eleven tropical cyclones, eight tropical storms, five hurricanes, and three major hurricanes that formed or entered the Central Pacific region. [3] These numbers are well above the long-term average of four tropical cyclones, two hurricanes, one tropical storm, and two depressions. [4] The exceptionally high activity was contributed to by an El Niño ongoing at the time. [5]

The only named storm to make landfall this year was Hurricane Rosa, [1] which killed four people in Western Mexico [6] and forced over 400 to be evacuated. [7] Other notable storms include Hurricane Olivia, a high-end Category 4 system, [1] the three Category 5 hurricanes Emilia, Gilma, and John. Both John and Hurricane Li existed in two of the three basins (East, and West) of the Pacific Ocean. [8]

This season marked the end of the Northeastern Pacific's most recent active period, which began in 1982, [9] and at the time, included the five most active Pacific hurricane seasons. [1] [9] Beginning in 1995, multi-decadal factors switched to a phase that suppressed Pacific hurricane activity. [10] After 1994, Pacific hurricane seasons were generally below normal, [11] with the exception of 1997, [9] until 2014. [12]

The 1994 Pacific hurricane season set several records. First, three hurricanes reached Category 5 intensity on the Saffir–Simpson hurricane scale, [8] setting a record later tied in 2002, then tied again in 2018. [1] Hurricane John lasted longer and spent more time tropical than any other tropical cyclone on Earth in recorded history. [13] Eleven tropical cyclones entered or formed in the central Pacific, a record shared with the 1992 season until the 2015 season broke the record. [5] Finally, of the four most intense hurricanes recorded in the Central Pacific, three of them occurred this season. [3]

List of costliest Pacific hurricane seasons (as of 2023)
RankCostSeason
1≥$13.07–17.07 billion 2023
2$4.52 billion 2013
3$3.15 billion 1992
4$1.62 billion 2010
5≥$1.52 billion 2014
6≥$1.46 billion 2018
7$834 million 1982
8$760 million 1998
9$735 million 1994
10$566 million 2015

The season began with the formation of Tropical Depression One-E on June 18 and ended with the dissipation of Tropical Depression Nona on October 26. [1] No named systems formed in May, three in June, four in July, five in August, six in September, two in October, and none in November. [1] The total length of the season, from the formation of the first depression to the dissipation of the last, was 130 days. [14]

Accumulated cyclone energy (ACE) is a measure of how active a hurricane season is. It is calculated by squaring the windspeed of a cyclone with at least tropical storm-force winds every six hours, summing the results, and dividing that total by 104. As a tropical cyclone does not have gale-force winds until it becomes a tropical storm, tropical depressions are not included in these tables. For all storms, ACE is given to three significant figures. The ACE in the east Pacific proper (140°W to North America) is given; the ACE in the central Pacific (the International Date Line to 140°W) is given in brackets. The table includes the ACE for Li and John only during those storm's time east of the dateline. Their ACE west of the dateline is part of the totals of the 1994 typhoon season. The National Hurricane Center uses ACE to rank hurricane seasons as above-normal, near-normal, and below-normal. It defines below-normal as having an ACE less than 95*104 kt2 kt2; It defines above normal as having an ACE above 150*104 kt2 along with the numbers of any two of the following above average: tropical storms (15), hurricanes (9), or major hurricanes (4); It defines near-normal as having an ACE between 100*104 kt2 and 150*104 kt2, or an ACE above 150*104 kt2 with fewer than two of the numbers of the following above average: tropical storms (15), hurricanes (9), or major hurricanes (4). [2] Excluding the central Pacific, there were a total of seventeen tropical storms, nine hurricanes, and five major hurricanes. Altogether, the total ACE of this season was 185*104 kt2. This qualifies this season as above-normal. [2]

Systems

Tropical Storm Aletta

Tropical storm (SSHWS)
Aletta 1994-06-19 2030Z.png   Aletta 1994 track.png
DurationJune 18 – June 23
Peak intensity50 mph (85 km/h) (1-min);
999  mbar  (hPa)

Tropical Depression One-E formed from an area of disturbed weather on June 18. It strengthened to Tropical Storm Aletta the next day. It continued intensifying and reached its peak intensity on June 20. Vertical wind shear began to weaken the storm thereafter. The weakening trend continued, weakening Aletta to a depression on June 21. The system dissipated June 23. Aletta's remnant low, however, could be tracked on satellite images for days following the storm. The low finally dissipated north of Hawaii. [15] Aletta never affected land, and no damage or casualties were reported. [16]

Tropical Storm Bud

Tropical storm (SSHWS)
Bud 1994-06-27 2030Z.png   Bud 1994 track.png
DurationJune 27 – June 29
Peak intensity45 mph (75 km/h) (1-min);
1003  mbar  (hPa)

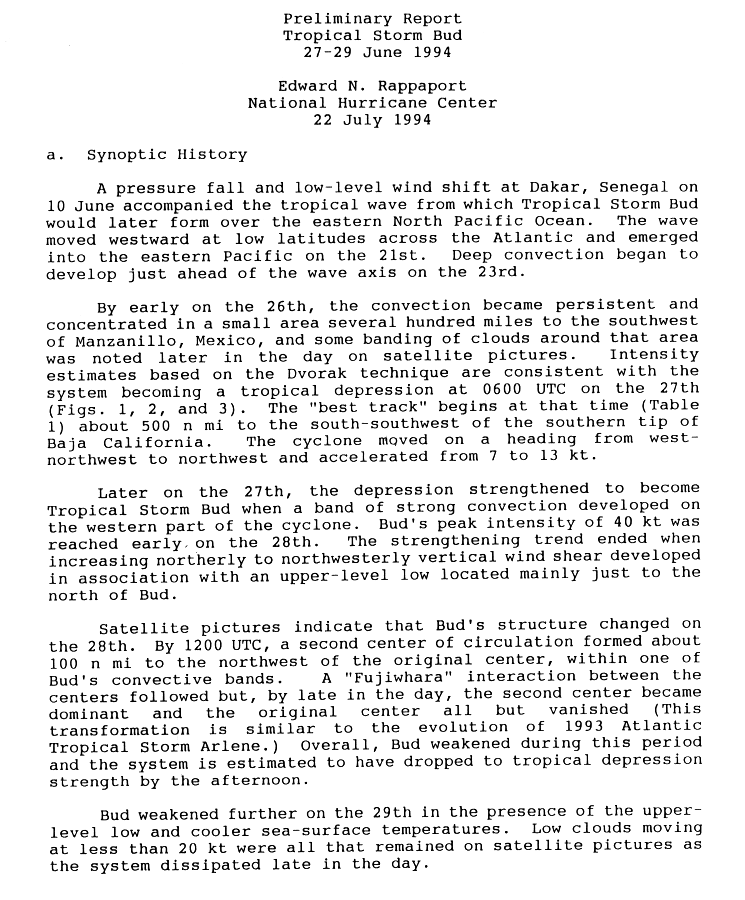
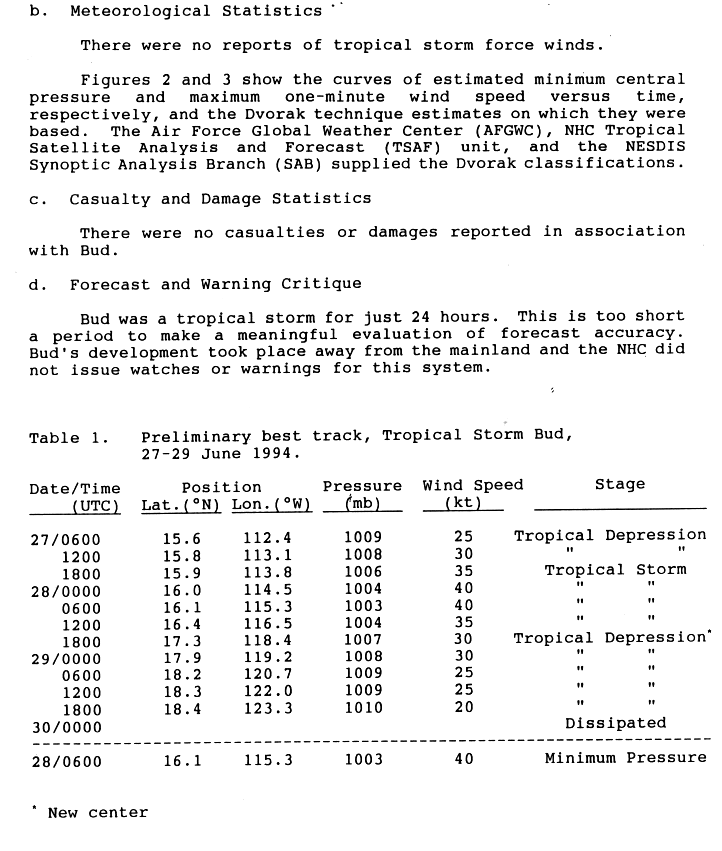
Tropical Depression Two-E formed on June 27 about 575 miles (925 km) south-southwest of the tip of the Baja California Peninsula. The depression headed west-northwest, gradually turned to the northwest, and strengthened into Tropical Storm Bud on June 27. Early the next day, Bud peaked in intensity. Shear caused by a nearby upper-level low slowly weakened Bud. Later on June 28, a second center of circulation developed. The two centers started a Fujiwhara interaction. The second center then became dominant and the first one vanished. This confused structure is similar to what happened to Tropical Storm Arlene (1993). This confused structure also weakened Bud to a tropical depression on the afternoon of the same day the second center formed. Bud then headed westward over cool waters and dissipated on June 29. [17] Tropical Storm Bud spent its entire life over the open ocean far from land areas. No casualties or damage was reported. [18]

Hurricane Carlotta

Category 2 hurricane (SSHWS)
Carlotta 1994-06-30 2001Z.png   Carlotta 1994 track.png
DurationJune 28 – July 5
Peak intensity105 mph (165 km/h) (1-min);
967  mbar  (hPa)

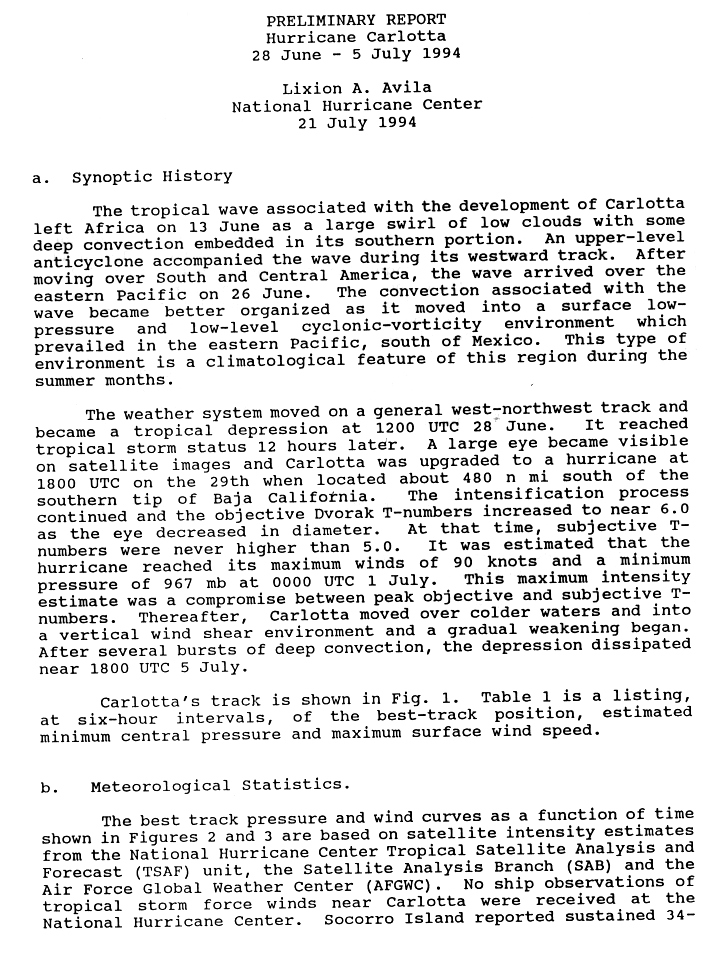
The tropical depression that would be Carlotta formed on June 28. It quickly became Tropical Storm Carlotta, and a large eye became visible. Because of this, the NHC upgraded the storm to a hurricane. Carlotta peaked in intensity on July 1, as a 105 mph (169 km/h) hurricane. It gradually weakened as it moved into cooler waters, dissipating on July 5. Carlotta did not threaten land. [19]

Carlotta buffeted Socorro Island with sustained winds of 39 mph (63 km/h) on June 30. [19] [20] Other than there, Carlotta caused no damage or deaths. [20]

Tropical Storm Daniel

Tropical storm (SSHWS)
Tropical Storm Daniel Jul 10 1994 1801Z.jpg   Daniel 1994 track.png
DurationJuly 8 – July 14
Peak intensity65 mph (100 km/h) (1-min);
993  mbar  (hPa)

On July 8, a disturbance located about 1,000 miles (1,600 km) southwest of the southern tip of the Baja California Peninsula developed a circulation and became Tropical Depression Four-E. Convection increased, and the depression strengthened into Tropical Storm Daniel. Upper-level outflow improved, and Daniel peaked in intensity on July 9. Daniel slowly declined as it continued westward. It entered the central Pacific on July 11. Wind shear weakened Daniel as it approached the Big Island, and by July 15 had degenerated into an open wave. [21]

When Daniel was approaching Hawaii, moderate surf of 4 to 6 feet (1.2 to 1.8 m) impacted the south and southeast shores of the Big Island on July 13 and 14. Daniel's remnants also passed about 100 miles (160 km) south of South Point, Hawaii, on July 15. That day, they caused rainfall on windward slopes of the Big Island locally reaching 5 inches (130 mm). [8] No reports of damage or casualties were received. [22]

Hurricane Emilia

Category 5 hurricane (SSHWS)
Emilia 1994-07-19 1830Z.png   Emilia 1994 track.png
DurationJuly 16 – July 25
Peak intensity160 mph (260 km/h) (1-min);
926  mbar  (hPa)

On July 16, an area of low pressure associated with a tropical wave organized into Tropical Depression Five-E. It strengthened into Tropical Storm Emilia later that day. It moved west-northwest and strengthened into a hurricane. [23] It entered the central Pacific on July 17. It continued intensifying, reaching Category 5 intensity on July 19, [8] the first Category 5 Pacific hurricane since Ava. Emilia started weakening quickly on July 21. It weakened to a tropical storm on July 23 and dissipated two days later. [8]

Emilia passed south of the Hawaiian Islands, producing swells of 6 to 10 feet (1.8 to 3.0 m) in height near the Puna and Ka‘ū coasts. Winds caused minor damage, and rain was moderate. [8] No one was killed. [24]

Tropical Storm Fabio

Tropical storm (SSHWS)
Fabio 1994-07-19 2200Z.png   Fabio 1994 track.png
DurationJuly 19 – July 24
Peak intensity45 mph (75 km/h) (1-min);
1002  mbar  (hPa)

A tropical depression formed on July 19. Later that day, it strengthened into Tropical Storm Fabio. Fabio headed generally west or northwestward. [25] It entered the central Pacific as a tropical depression, and dissipated on July 24. [8]

Fabio's remnants brought locally heavy rainfall to Hawaii, reaching 3 to 4 inches (76 to 102 mm). [8] No one was killed and there was no damage. [26]

Hurricane Gilma

Category 5 hurricane (SSHWS)
Gilma 1994-07-24 0000Z.png   Gilma 1994 track.png
DurationJuly 21 – July 31
Peak intensity160 mph (260 km/h) (1-min);
920  mbar  (hPa)

Part of a tropical wave organized into a tropical depression on July 21. It headed westward and out to sea, strengthening into a tropical storm the next day. Gilma rapidly strengthened and became a hurricane exactly one day after it was named. It continued to intensify as it entered the central Pacific. Shortly after entering the central Pacific, Gilma reached Category 5 intensity on the Saffir–Simpson hurricane scale, the second of the season. [27] It then suddenly weakened for unexplained reasons, and weakened into a tropical storm on July 27. It became a depression three days after that and dissipated on July 31. [8] Hurricane Gilma had minor impact on Johnston Atoll. That atoll received light rain, wind gusts to near gale force, [28] and surf. [8] No casualties or damage were reported. [28]

Hurricane Gilma was the second most-intense Pacific hurricane at the time. As of 2019, it is tied with Hurricane Walaka as the tenth-most intense. Gilma is also the strongest July storm in the Eastern or Central Pacific. [1]

Hurricane Li

Category 1 hurricane (SSHWS)
Hurricane Li (1994).JPG   Li 1994 track.png
DurationJuly 31 – August 12 (Exited basin)
Peak intensity75 mph (120 km/h) (1-min);
1007  mbar  (hPa)

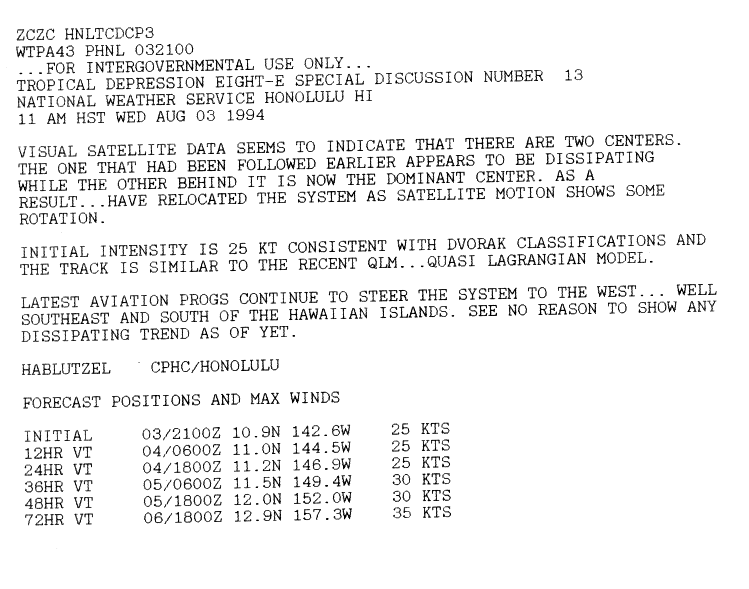
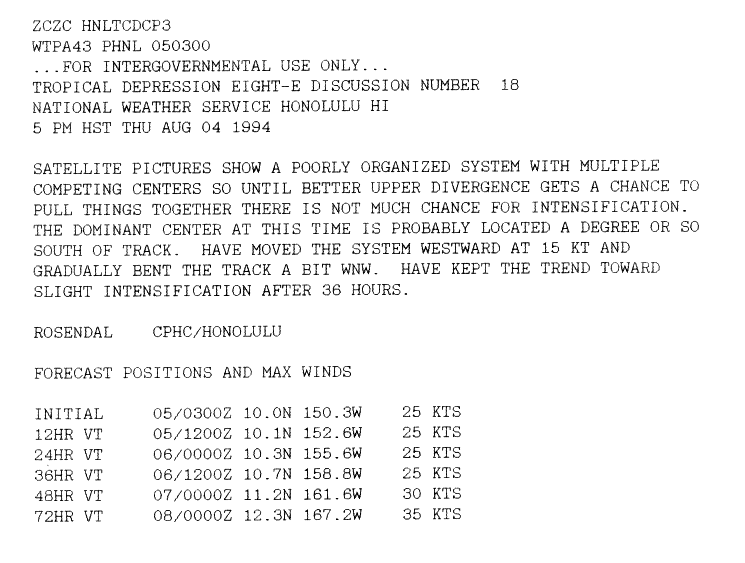
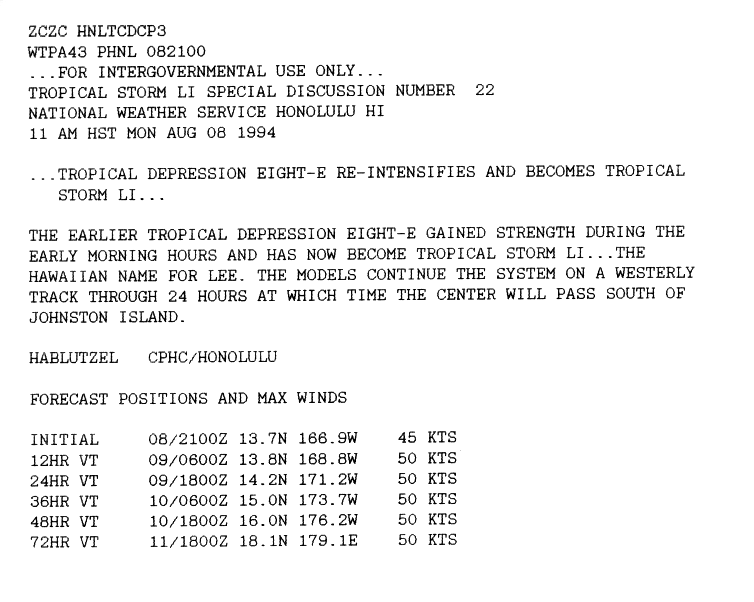
A tropical disturbance southwest of Cabo San Lucas organized into Tropical Depression Eight-E on July 31. [29] It headed west-northwest without strengthening much, and crossed into the central Pacific on August 2. [30] Eight-E developed a second center of circulation, which became dominant, [31] and then became bound up in the Intertropical Convergence Zone. [32] Eight-E then became disorganized, with multiple centers of circulation, [33] and advisories were discontinued on August 5. The depression's remains continued their westward path well south of the Hawaiian Islands. The depression regenerated on August 8. It soon strengthened into a tropical storm and was named Li, [8] which is Hawaiian for "Lee". [34] Li approached the dateline on its generally westward heading. Just before crossing, it intensified into a minimal Category 1 hurricane. It crossed the dateline on August 12 and became a storm in the 1994 Pacific typhoon season. [8] Wind shear from a tropical upper-tropospheric trough weakened back into a tropical storm as it crossed the dateline, and the Joint Typhoon Warning Center downgraded Li with its first advisory. [35] Li stayed a tropical storm until August 16, where it weakened into a tropical depression. The system then began recurving, and dissipated on August 18. [36] A weakening Tropical Depression Li caused showers on Wake Island. Other than there, Li had no impact on any land, and no casualties or damage were reported. [8]

Hurricane Li is one of only eight tropical cyclones to exist on all three North Pacific Ocean tropical cyclone basins. [1]

Tropical Storm Hector

Tropical storm (SSHWS)
Hector 1994-08-08 2000Z.png   Hector 1994 track.png
DurationAugust 7 – August 10
Peak intensity65 mph (100 km/h) (1-min);
993  mbar  (hPa)

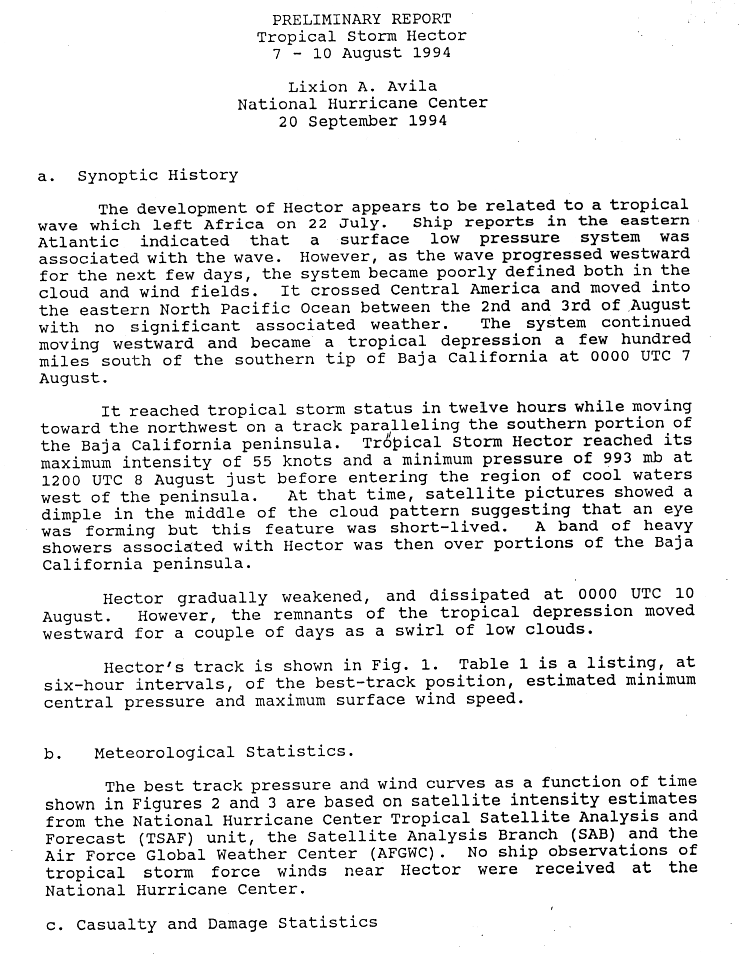
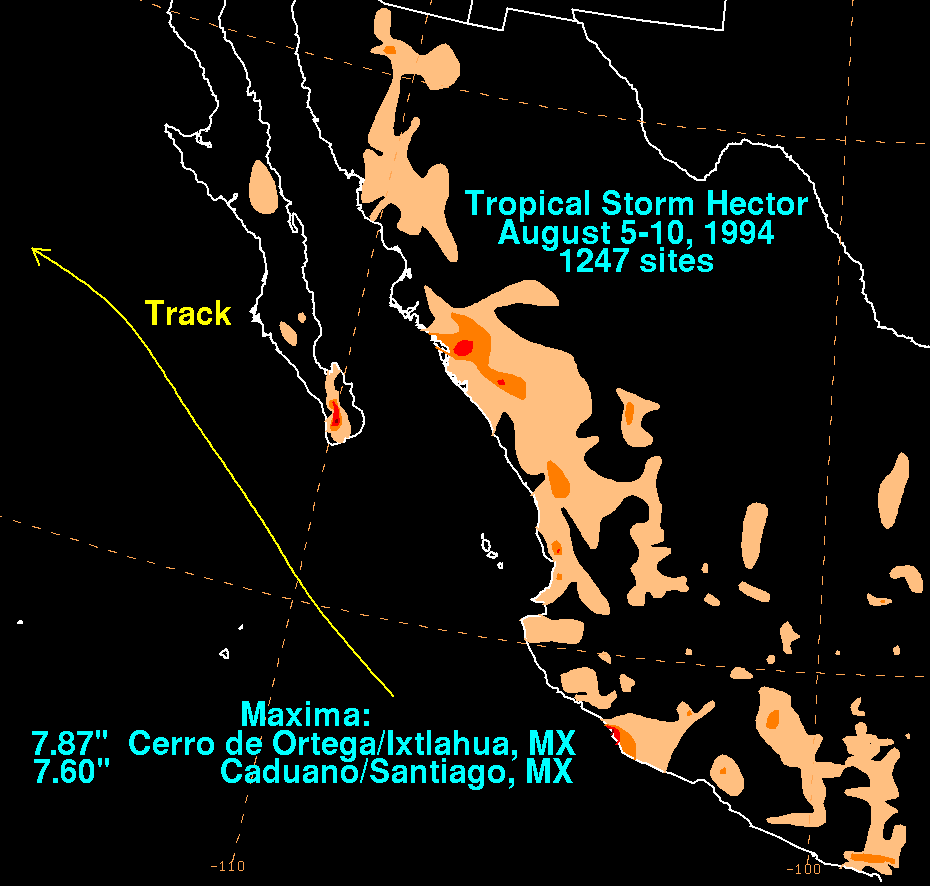
On August 7, a tropical depression formed from a tropical wave a few hundred miles south of Baja California. It became Tropical Storm Hector quickly, and as it paralleled the coast of Mexico, it began to weaken, dissipating on August 10. No damage was reported anywhere. [37]

Tropical Storm Hector was forecast to approach the Baja California Peninsula. A tropical storm watch was issued for part of the peninsula on August 8. It was lifted later the same day. [38] Hector's most significant impact was rain. The tropical storm dumped rain along a discontinuous zone of coastal and inland Mexico. The highest point maxima were 7.87 inches (200 mm) at Cerro de Ortega/Ixtlahua and 7.60 inches (193 mm) at Caduano/Santiago. [39] No damage or casualties were reported. [38]

Tropical Depression One-C

Tropical depression (SSHWS)
TD 01C (1994).JPG   One-C 1994 track.png
DurationAugust 9 – August 14
Peak intensity35 mph (55 km/h) (1-min);

An area of disturbed weather organized into a tropical depression on August 9 while located 740 miles (1,190 km) southeast of Hilo, Hawaii. The depression moved westward without organizing, and dissipated on August 14. [8]

Moisture from the system produced heavy rainfall over the island of Hawaii, totaling to over 15 inches (380 mm). [8] The flooding closed all major roads in Hilo, and was considered the worst flooding in 40 years. The rainfall destroyed two homes and damaged 214, 14 severely. It also damaged roads and businesses. Damage throughout the island totaled to $5 million (1994 USD; $9.87 million2024 USD). [40] Flooding occurred in Maui as well, where landslides blocked portions of the Hana Highway. [41] One-C's point maximum of 15 in (380 mm) makes it Hawaii's ninth wettest known tropical cyclone.

Hurricane Ileana

Category 1 hurricane (SSHWS)
Ileana 1994-08-12 1830Z.png   Ileana 1994 track.png
DurationAugust 10 – August 14
Peak intensity75 mph (120 km/h) (1-min);
986  mbar  (hPa)

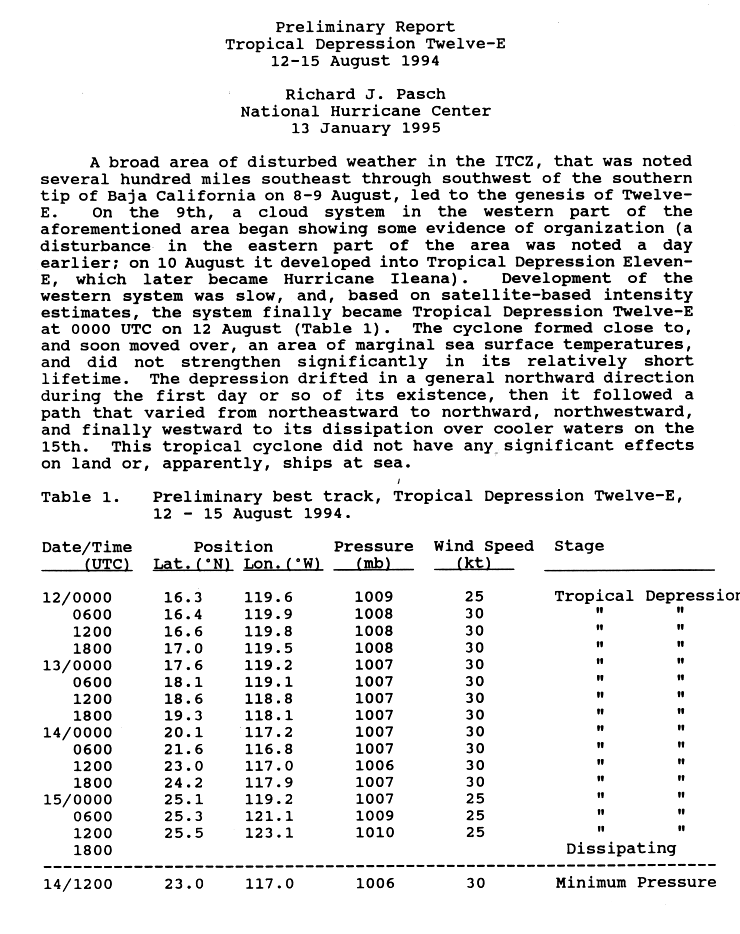
A disturbance that was part of the Intertropical Convergence Zone developed several centers of circulation. After it organized, it separated from the ITCZ and became Tropical Depression Eleven-E on August 10 while the system was about 690 miles (1,110 km) south-southeast of the southern tip of the Baja California Peninsula. [42] It was upgraded to Tropical Storm Ileana at the second advisory, [43] at the same time as John, the next storm. [44] An eye appeared, and Ileana became a hurricane on August 12. It began weakening almost immediately thereafter, as it passed over cooler waters and encountered increasing wind shear. Ileana was a tropical storm on August 13, and the next day it was a dissipating swirl low-level clouds located about 520 miles (840 km) west of Punta Eugenia. [42] Although Ileana paralleled the coast of Mexico, watches and warnings were not issued because winds of tropical storm-force were not expected to affect land. No one was killed and there was no damage reported in association with this cyclone. [45]

Hurricane John

Category 5 hurricane (SSHWS)
John 1994-08-23 0200Z.png   John 1994 path.png
DurationAugust 11 – September 10 (Out of basin between August 28-September 8)
Peak intensity175 mph (280 km/h) (1-min);
929  mbar  (hPa)

Tropical Depression Ten-E formed on August 11 south of Mexico. It headed generally westward, and was upgraded into a tropical storm twelve hours after it formed and was named John. John fluctuated in strength as it headed west, always managing to stay at tropical storm strength. On August 20, steady intensification began, and John was a major hurricane when it entered the central Pacific. It continued westward, reaching Category 5 intensity on August 23. It passed around 245 miles (394 km) south of Hawaii, and passed just north of Johnston Atoll on August 26. [46] John stayed at hurricane intensity until it crossed the dateline on August 28, becoming a typhoon of the 1994 Pacific typhoon season. [8] After weakening into a tropical storm, John recurved, looped, and recurved again. [47] It reintensified, and was a hurricane when it recrossed the dateline to reenter the central Pacific. John headed north-northeast until it went extratropical on September 10, [8] thirty one days after it formed. [1]

Ahead of the hurricane, the 1100 people at Johnston Atoll evacuated. On the atoll, John caused $15 million (1994 USD; $29.6 million2024 USD) in damage. No deaths were reported. Other than on Johnston, Hurricane John had minor effects in Hawaii. Its remnants also affected Alaska. [8]

Hurricane John was the longest lasting, until it was surpassed by Cyclone Freddy in 2023 and farthest traveling tropical cyclone on Earth in recorded history. [13] [48] It is also one of six tropical cyclones to exist in all three North Pacific Ocean tropical cyclone basins, and one of the few tropical cyclones to cross the International Dateline more than once. [1]

Hurricane Kristy

Category 2 hurricane (SSHWS)
Kristy 1994-08-31 2000Z.png   Kristy 1994 track.png
DurationAugust 28 – September 5
Peak intensity105 mph (165 km/h) (1-min);
≤992  mbar  (hPa)

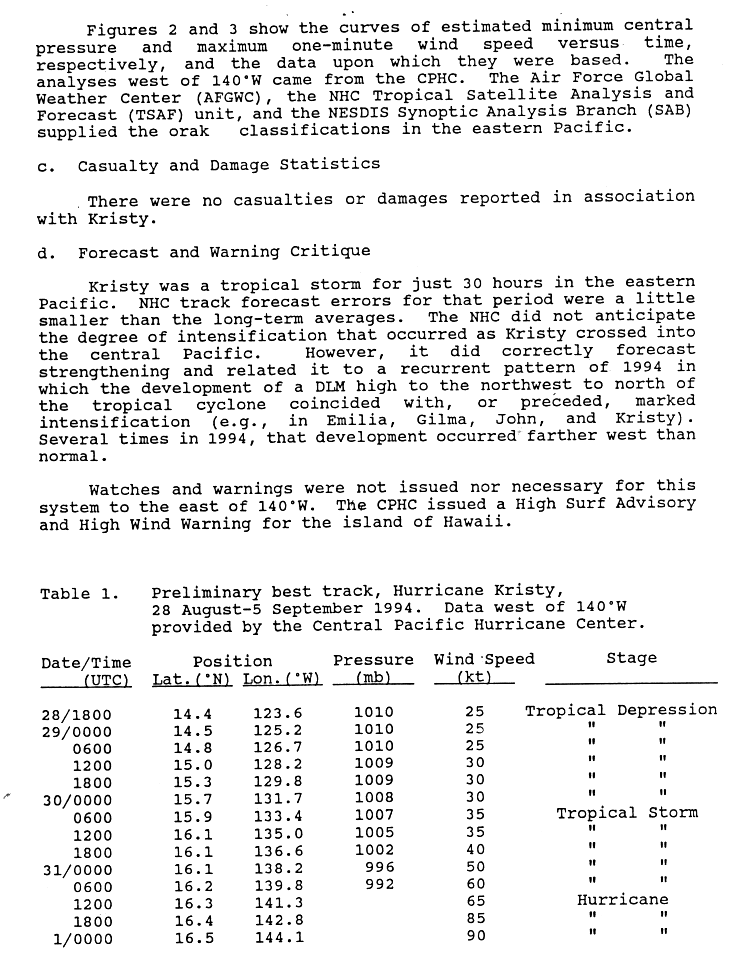
On August 28, Tropical Depression Thirteen-E formed about 1,300 miles (2,100 km) southwest of Cabo San Lucas, Mexico. It was named Tropical Storm Kristy on August 30. As it crossed into the central Pacific, a banding-type eye formed and it became a hurricane. [49] Twelve hours later, it reached Category 2 intensity. Kristy weakened steadily from that point due to wind shear. It passed about 300 miles (480 km) south of Hawaii, and dissipated on September 5. [8] The lowest central pressure of Kristy is unknown. The last estimate was made when Kristy was still a tropical storm. [1]

As it approached the Hawaiian Islands, a high surf advisory and a high wind warning were issued for the Big Island of Hawaii. No damage or deaths were reported in association with this system. [50] Its remnants crossed 180th meridian very early on September 7 and was absorbed by a tropical depression which became Typhoon Melissa in the Western Pacific basin.

Hurricane Lane

Category 4 hurricane (SSHWS)
Hurricane Lane Sep 6 1994 1901Z.jpg   Lane 1994 track.png
DurationSeptember 3 – September 10
Peak intensity130 mph (215 km/h) (1-min);
948  mbar  (hPa)

The same tropical wave that spawned Tropical Depression Five in the Atlantic became Tropical Depression Fourteen-E on September 3. It quickly became Tropical Storm Lane. A high pressure ridge centered itself north of Lane, keeping the storm on a westward track. This brought Lane into very favorable conditions, and Lane intensified. When the tropical storm reached hurricane strength, it entered a phase of rapid intensification, reaching winds of about 135 mph (217 km/h), making it a category four hurricane. The high pressure ridge shifted eastward, and allowed Lane to enter unfavorable conditions. Lane dissipated on September 10. [51]

Tropical Storm Mele

Tropical storm (SSHWS)
Mele 1994-09-06 2230Z.png   Mele 1994 track.png
DurationSeptember 6 – September 9
Peak intensity40 mph (65 km/h) (1-min);

A tropical disturbance became Tropical Depression Two-C on September 6. It reached tropical storm strength the next day, being named Mele. [8] The name Mele means "song" in the Hawaiian language and is also the Hawaiian form of "Mary". [52] Mele headed west-northwest and weakened back into a tropical depression on September 9. It dissipated later that day without incident. [8]

Tropical Storm Miriam

Tropical storm (SSHWS)
Tropical Storm Miriam (1994).JPG   Miriam 1994 track.png
DurationSeptember 15 – September 21
Peak intensity45 mph (75 km/h) (1-min);
1002  mbar  (hPa)

Miriam formed from a weak disturbance on September 15. It strengthened slightly into Tropical Storm Miriam, and dissipated on September 21, having led an uneventful life without impact. In an interesting occurrence, the low-level remnants of Miriam were still visible for weeks after the storm dissipated near 140°W. [53]

Tropical Storm Norman

Tropical storm (SSHWS)
Tropical Storm Norman (1994).JPG   Norman 1994 track.png
DurationSeptember 19 – September 22
Peak intensity40 mph (65 km/h) (1-min);
1004  mbar  (hPa)

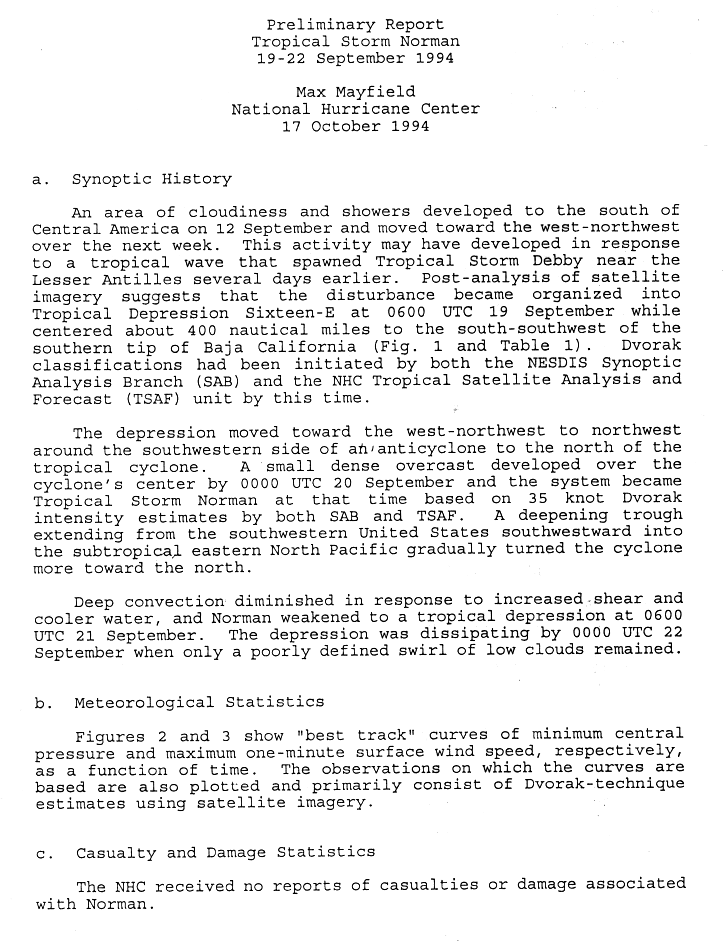
A tropical depression formed on September 19, and became Tropical Storm Norman the next day. After tracking northwest, it began to turn north in response to a trough, and convection began to diminish. Norman dissipated on September 22 without having ever affected land. [54]

Hurricane Olivia

Category 4 hurricane (SSHWS)
Olivia 1994-09-25 2000Z.png   Olivia 1994 track.png
DurationSeptember 22 – September 29
Peak intensity150 mph (240 km/h) (1-min);
923  mbar  (hPa)

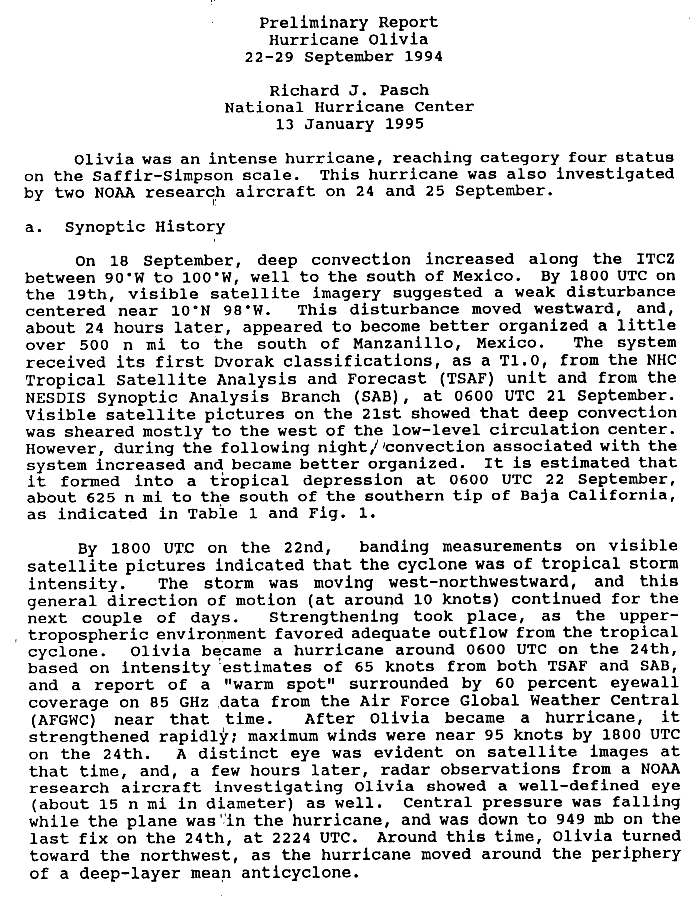
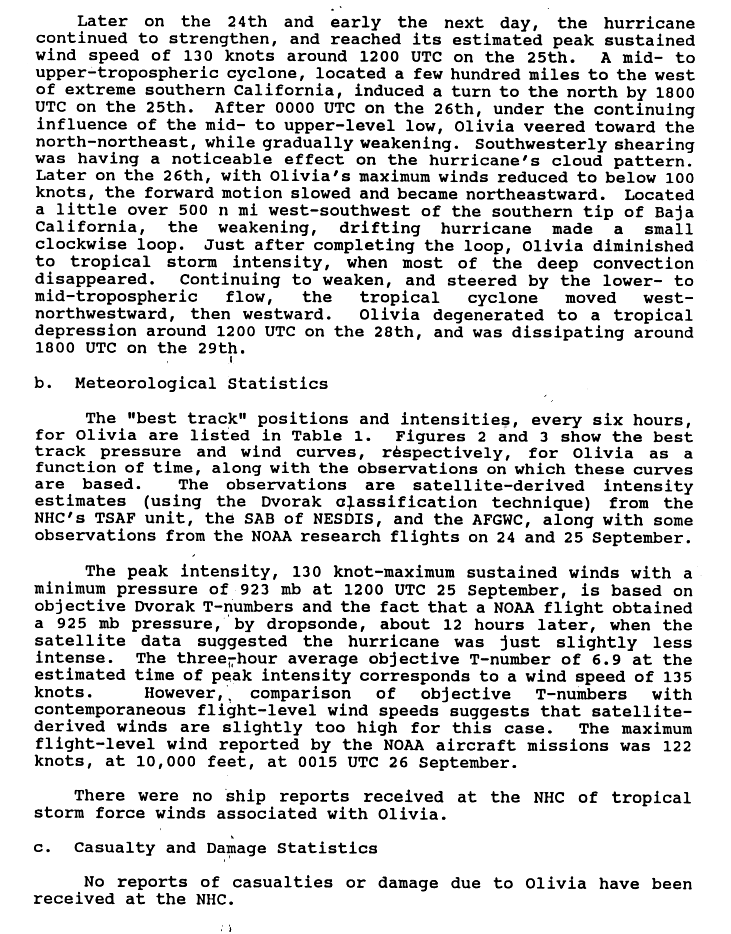
Hurricane Olivia ultimately formed from a disturbance that had separated from the Intertropical Convergence Zone and become distinct by September 19. The disturbance slowly headed westward and it organized into a tropical depression on September 22 while located about 720 miles (1,160 km) south of the southern tip of the Baja California Peninsula. The depression headed west-northwestwards and strengthened into Tropical Storm Olivia on September 22. It steadily intensified and was a hurricane on September 24. It then rapidly strengthened into a powerful major hurricane. It slowly curled to the northwest as it was observed by NOAA research aircraft. [55] Olivia peaked in intensity on September 25. Meanwhile, a large cyclone off the extreme southern part of California induced a northward path. As Olivia started a small anticyclonic loop, wind shear began to weaken the hurricane. When Olivia was finished the loop, it had weakened to a tropical storm. It then headed westward. It weakened into a tropical depression on September 28 and dissipated the next day. No impact was reported. [56]

At the time, Olivia was the third-most intense Pacific hurricane on record; it has since dropped to eleventh. The storm also had the lowest barometric pressure of a Category 4 Pacific hurricane on record. In 2001, Hurricane Juliette joined Olivia as the most intense Category 4 hurricane on record. In 2014, Hurricane Odile beat both storms when it attained a minimum pressure of 918 mbars. At the time, Olivia was also the most intense September hurricane, but was surpassed by Hurricane Linda in 1997, and is currently the third most intense September hurricane in the Pacific basin. [1]

Tropical Storm Paul

Tropical storm (SSHWS)
Paul 1994-09-25 2200Z.png   Paul 1994 track.png
DurationSeptember 24 – September 30
Peak intensity45 mph (75 km/h) (1-min);
1003  mbar  (hPa)

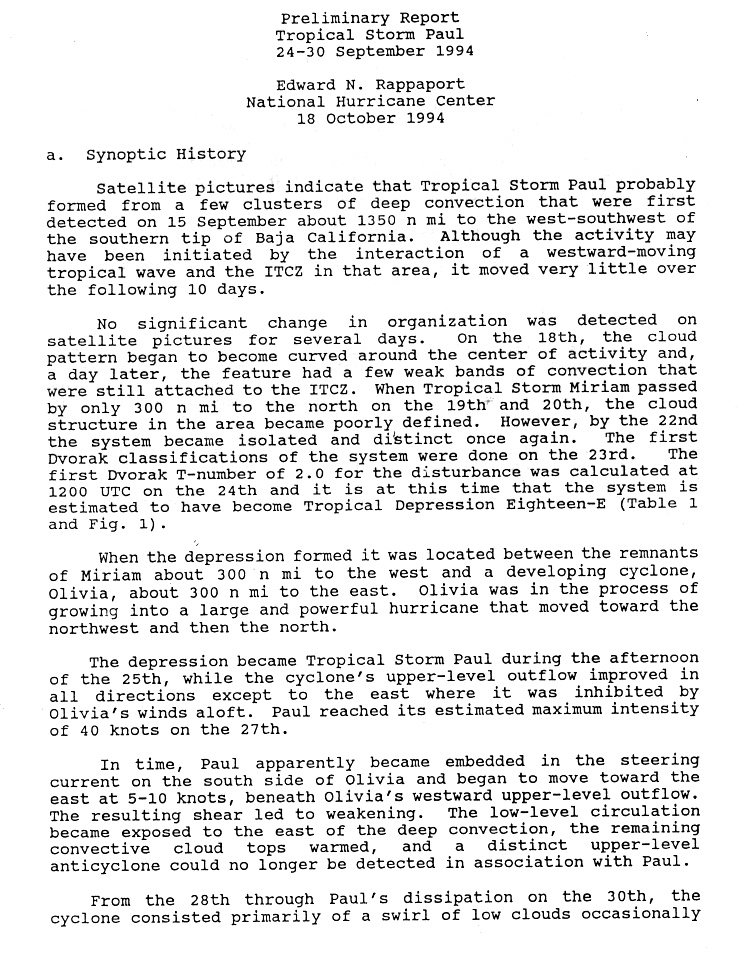
A nearly stationary cluster of thunderstorms and convection that had been hanging around since September 15 and escaped destruction by Tropical Storm Miriam organized into Tropical Depression Eighteen-E on September 24. It was located between Miriam's remnants and the developing Olivia. It became Tropical Storm Paul on the afternoon of September 25. It peaked in intensity on September 27. Then, upper outflow from the nearby Olivia started shearing the tropical cyclone. Paul had been completely destroyed by September 30. [57] The tropical cyclone never threatened land, and consequently, no damage or deaths were reported. [58]

Hurricane Rosa

Category 2 hurricane (SSHWS)
Rosa 1994-10-13 1745Z.png   Rosa 1994 track.png
DurationOctober 8 – October 15
Peak intensity105 mph (165 km/h) (1-min);
974  mbar  (hPa)

An area of disturbed weather organized into a tropical depression at midday on October 8. It had trouble organizing, and advisories were discontinued for a while. The cyclone finally became a tropical storm on October 11 and was named Rosa. It moved glacially, but eventually a trough steered Rosa north and then northeast. Rosa intensified quickly, peaking at Category 2 intensity just before landfall near La Concepción on the morning of October 14. Rosa quickly decayed over the mountains of Mexico, and its cloud shield rapidly accelerated northward through the United States, spreading moisture. [59]

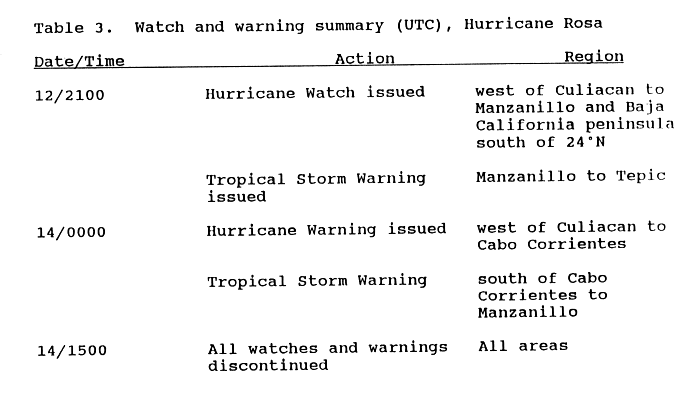
On October 12, a hurricane watch was issued for the coast from Culiacán to Manzanillo and the Baja California Peninsula south of latitude 24°N. At the same time, a tropical storm warning was issued from Manzanillo to Tepic. On October 14, a hurricane warning was issued for the coast between Culiacán and Cabo Corrientes, Jalisco, and a tropical storm warning south of Cabo Corrientes to Manzanillo. All watches and warnings were lifted later that day. [60]

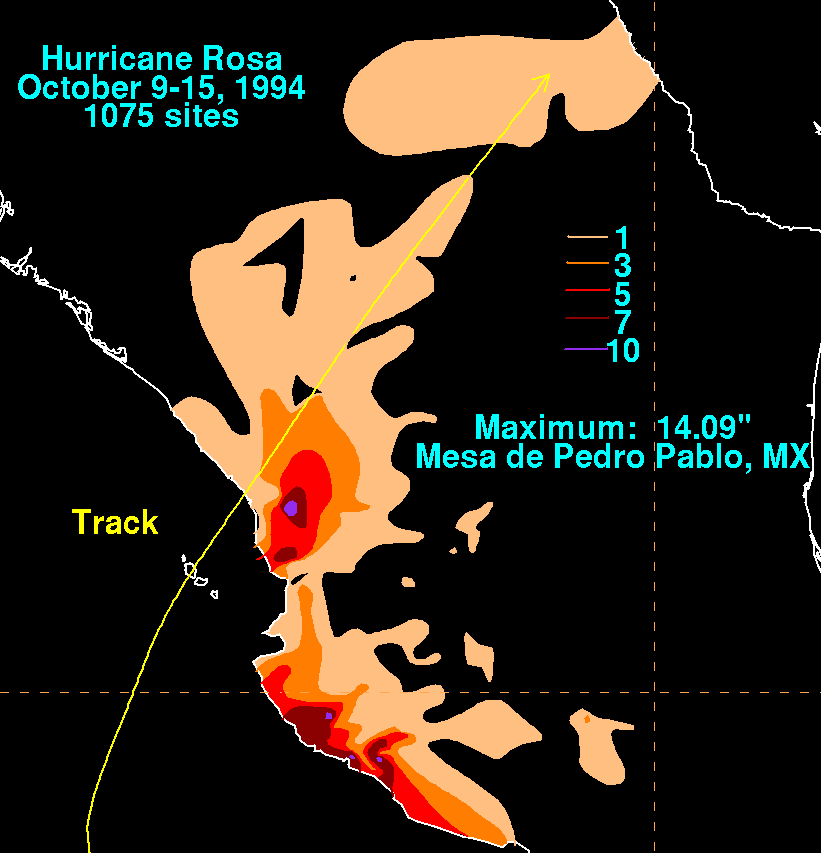
Four deaths, two in each of Nayarit and Durango, were reported. Four people were missing in Sinaloa. All of the deaths were due to drowning. More than 100,000 people had their homes damaged in Nayarit. Telephone poles and power lines were downed in Sinaloa. Rain caused landslides and flash-flooding in mountainous areas. [6] In Jalisco, mudslides forced the evacuation of 400 people from two coastal villages. [61] The highest rainfall total in Mexico was 14.09 inches (358 mm) at Mesa de Pedro Pablo. [62] The moisture Rosa sent into the United States was a contributing factor in record rains in parts of southeastern Texas from October 15 to 19. Those rains caused flooding that killed 22 people, destroyed over 3000 homes, and caused US$700 million in damage. [63]

Tropical Storm Nona

Tropical storm (SSHWS)
Nona 1994-10-22 2230Z.png   Nona 1994 track.png
DurationOctober 21 – October 26
Peak intensity40 mph (65 km/h) (1-min);

Tropical Depression Three-C formed on October 21 in the Central Pacific basin. It traveled westward for about 4 days before strengthening to Tropical Storm Nona on October 25. [8] The name "Nona" is Hawaiian for the Latin name spelled the same way. [64] [65] Nona immediately weakened back into a tropical depression. Upper-level westerlies from a nearby trough destroyed the depression on October 26. No deaths or damage were reported. [8] Nona was a tropical storm for six hours, [1] the minimum possible time. [66]

Other systems

On August 14, an area of convection organized enough to be considered a tropical depression. It was steered by John's circulation, and it was never expected to strengthen much because it was close to cool waters. [67] The cyclone drifted north, then northeast, north again, northwest, and then west. [68] The National Hurricane Center declared the depression dissipated on August 15. [69] The depression had no effects anywhere. [68]

According to the Joint Typhoon Warning Center and Japan Meteorological Agency, on October 21, a tropical depression formed west of the International Date Line, and soon exited CPHC's area of responsibility. the system subsequently became Tropical Storm Yuri. [70] [71]

Storm names

The following list of names was used for named storms that formed in the North Pacific Ocean east of 140°W in 1994. [72] This is the same list used for the 1988 season, [73] except for Ileana, which replaced Iva, and which was used for the first time in 1994. [74] No names were retired from this list following the season, [75] and it was used again for the 2000 season. [76]

  • Aletta
  • Bud
  • Carlotta
  • Daniel*
  • Emilia *
  • Fabio*
  • Gilma *
  • Hector
  • Ileana
  • John *
  • Kristy*
  • Lane*
  • Miriam
  • Norman
  • Olivia
  • Paul
  • Rosa
  • Sergio (unused)
  • Tara (unused)
  • Vicente (unused)
  • Willa (unused)
  • Xavier (unused)
  • Yolanda (unused)
  • Zeke (unused)

For storms that form in the North Pacific from 140°W to the International Date Line, the names come from a series of four rotating lists. Names are used one after the other without regard to year, and when the bottom of one list is reached, the next named storm receives the name at the top of the next list. [72] Three named storms, listed below, formed in the central North Pacific in 1994. Named storms in the table above that crossed into the area during the year are noted (*). [8]

  • Li
  • Mele
  • Nona

Season effects

This is a table of all of the tropical cyclones that formed in the 1994 Pacific hurricane season. It includes their name, duration (within the basin), peak classification and intensities, areas affected, damage, and death totals. Deaths in parentheses are additional and indirect (an example of an indirect death would be a traffic accident), but were still related to that storm. Damage and deaths include totals while the storm was extratropical, a wave, or a low, and all of the damage figures are in 1994 USD.

1994 Pacific hurricane season statistics
Storm
name
Dates activeStorm category
at peak intensity
Max 1-min
wind
mph (km/h)
Min.
press.
(mbar)
Areas affectedDamage
(USD)
DeathsRef(s)
AlettaJune 18 –23Tropical storm50 (80)999NoneNoneNone
BudJune 27–29Tropical storm45 (75)1003NoneNoneNone
CarlottaJune 28 – July 5Category 2 hurricane105 (165)967 Socorro Island, Revillagigedo Islands NoneNone
DanielJuly 8–14Tropical storm65 (100)993 Hawaiian Islands NoneNone
Emilia July 16–25Category 5 hurricane160 (260)926 Hawaii NoneNone
FabioJuly 19–24Tropical storm45 (75)1002HawaiiNoneNone
Gilma July 21–31Category 5 hurricane160 (260)920 Johnston Atoll MinimalNone
LiJuly 31 – August 18Category 1 hurricane75 (120)1007Hawaiian Islands, Johnston AtollNoneNone
HectorAugust 7–10Tropical storm65 (100)993Revillagigedo Islands, Baja California Peninsula MinimalNone
One-CAugust 9–14Tropical depression35 (55)N/AHawaii$5 millionNone
IleanaAugust 10–14Category 1 hurricane75 (120)986Baja California PeninsulaNoneNone
John August 11 – September 10Category 5 hurricane175 (280)929Hawaii, Johnston Atoll$15 millionNone
Twelve-EAugust 12–15Tropical depression35 (55)1006NoneNoneNone
KristyAugust 28 – September 5Category 2 hurricane105 (165)992HawaiiNoneNone
LaneSeptember 3–10Category 4 hurricane130 (215)948NoneNoneNone
MeleSeptember 6–9Tropical storm40 (65)N/ANoneNoneNone
MiriamSeptember 15–21Tropical storm45 (75)1002NoneNoneNone
NormanSeptember 19–22Tropical storm40 (65)1004NoneNoneNone
OliviaSeptember 22–29Category 4 hurricane150 (240)923NoneNoneNone
PaulSeptember 24–30Tropical storm45 (75)1003NoneNoneNone
Rosa October 8–15Category 2 hurricane105 (165)974Southwestern Mexico, Western Mexico, Southwestern United States, Texas $700 million4–30
NonaOctober 21–26Tropical storm40 (65)N/ANoneNoneNone
Season aggregates
22 systemsJune 18 – October 26 175 (280)920$720 million4-30 

Notes

    See also

    Related Research Articles

    <span class="mw-page-title-main">Hurricane John (1994)</span> Category 5 Pacific hurricane and typhoon in 1994

    Hurricane John, also known as Typhoon John, was the farthest-traveling tropical cyclone ever observed worldwide. It was also the longest-lasting tropical cyclone on record globally at the time, until it was surpassed by Cyclone Freddy in 2023. John formed during the 1994 Pacific hurricane season, which had above-average activity due to the El Niño of 1994–1995, and peaked as a Category 5 hurricane on the Saffir–Simpson scale, the highest categorization for hurricanes.

    <span class="mw-page-title-main">2002 Pacific hurricane season</span> Hurricane season in the Pacific Ocean

    The 2002 Pacific hurricane season was a near–average season which produced fifteen named storms. Eight hurricanes formed, including a record-equaling three Category 5 hurricanes, a record it shares with the 1994 and 2018 seasons. It was also a near-average season in terms of accumulated cyclone energy (ACE), having an ACE of 125. The season officially began on May 15, 2002 in the East Pacific Ocean, and on June 1, 2002 in the Central Pacific; both ended on November 30. These dates conventionally delimit the period of each year when most tropical cyclone formation occurs in these regions of the Pacific. The first system of the 2002 season, Hurricane Alma, formed on May 24, and the last, Tropical Depression Sixteen-E, dissipated on November 16.

    <span class="mw-page-title-main">2000 Pacific hurricane season</span> Hurricane season in the Pacific Ocean

    The 2000 Pacific hurricane season was an above-average Pacific hurricane season, although most of the storms were weak and short-lived. There were few notable storms this year. Tropical storms Miriam, Norman, and Rosa all made landfall in Mexico with minimal impact. Hurricane Daniel briefly threatened the U.S. state of Hawaii while weakening. Hurricane Carlotta was the strongest storm of the year and the second-strongest June hurricane in recorded history. Carlotta killed 18 people when it sank a freighter. Overall, the season was significantly more active than the previous season, with 19 tropical storms. In addition, six hurricanes developed. Furthermore, there were total of two major hurricanes.

    <span class="mw-page-title-main">1999 Pacific hurricane season</span> Hurricane season in the Pacific Ocean

    The 1999 Pacific hurricane season was one of the least active Pacific hurricane seasons on record. The season officially began on May 15 in the Eastern Pacific, and on June 1 in the Central Pacific; in both basins, it ended on November 30. These dates conventionally delimit the period during which most tropical cyclones form in the northeastern Pacific Ocean. The first tropical cyclone of the season, Hurricane Adrian, developed on June 18, while the final storm of the season, Tropical Storm Irwin, dissipated on October 11. No storms developed in the Central Pacific during the season. However, two storms from the Eastern Pacific, Dora and Eugene, entered the basin, with the former entering as a hurricane and becoming the second farthest travelling Pacific hurricane on record.

    <span class="mw-page-title-main">1997 Pacific hurricane season</span> Hurricane season in the Pacific Ocean

    The 1997 Pacific hurricane season was a very active hurricane season. With hundreds of deaths and hundreds of millions of dollars in damage, this was one of the deadliest and costliest Pacific hurricane seasons on record. This was due to the exceptionally strong 1997–98 El Niño event. The season officially started on May 15, in the eastern Pacific, and on June 1, in the central Pacific, and lasted until November 30. These dates conventionally delimit the period of each year when almost all tropical cyclones form in the northeastern Pacific Ocean.

    <span class="mw-page-title-main">1991 Pacific hurricane season</span> Hurricane season in the Pacific Ocean

    The 1991 Pacific hurricane season was a near-average Pacific hurricane season. The worst storm this year was Tropical Storm Ignacio, which killed 23 people in Mexico and injured 40 others. Elsewhere, Hurricane Fefa caused flooding in Hawaii. Hurricane Kevin was the strongest system of the season and became the then longest-lasting hurricane in the eastern north Pacific basin at the time, and Hurricane Nora was the strongest November storm to that point. The season officially started on May 15, 1991, in the eastern Pacific, and on June 1, 1991, in the central Pacific. It lasted until November 30, 1991, in both basins. These dates conventionally delimit the period of each year when most tropical cyclones form in the northeastern Pacific Ocean.

    <span class="mw-page-title-main">1988 Pacific hurricane season</span> Hurricane season in the Pacific Ocean

    The 1988 Pacific hurricane season was the least active Pacific hurricane season since 1981. It officially began May 15, in the eastern Pacific, and June 1, in the central Pacific and lasted until November 30. These dates conventionally delimit the period of each year when most tropical cyclones form in the northeastern Pacific Ocean. The first named storm, Tropical Storm Aletta, formed on June 16, and the last-named storm, Tropical Storm Miriam, was previously named Hurricane Joan in the Atlantic Ocean before crossing Central America and re-emerging in the eastern Pacific; Miriam continued westward and dissipated on November 2.

    <span class="mw-page-title-main">1987 Pacific hurricane season</span> Hurricane season in the Pacific Ocean

    The 1987 Pacific hurricane season was the last year in which the Eastern Pacific Hurricane Center was the primary warning center for tropical cyclones in the eastern Pacific Ocean. The season officially started May 15, 1987, in the eastern Pacific, and June 1, 1987, in the central Pacific, and lasted until November 30, 1987. These dates conventionally delimit the period of each year when the vast majority of tropical cyclones form in the northeastern Pacific Ocean.

    <span class="mw-page-title-main">1982 Pacific hurricane season</span> Hurricane season in the Pacific Ocean

    The 1982 Pacific hurricane season was, at the time, the most active Pacific hurricane season on record, with 23 named storms. Of those, 12 became hurricanes, with 5 intensifying into major hurricanes. The season officially started on May 15 in the eastern Pacific basin and June 1 in the central Pacific basin. The season in both basins ended on November 30. These dates conventionally delimit the period during which most tropical cyclones form in these regions of the Pacific Ocean. The first tropical cyclone of the season, Tropical Storm Aletta, formed on May 20, and the final one of the season, Hurricane Iwa, dissipated on November 25. A strengthening El Niño that year fueled the season's above normal activity.

    <span class="mw-page-title-main">1980 Pacific hurricane season</span> Hurricane season in the Pacific Ocean

    The 1980 Pacific hurricane season officially started May 15, 1980, in the eastern Pacific and June 1, 1980, in the central Pacific, lasting until November 30, 1980. These dates conventionally delimit each year when most tropical cyclones form in the northeastern and central Pacific Ocean. This season was relatively uneventful; since no tropical cyclones made landfall, there were no reports of casualties or damage.

    <span class="mw-page-title-main">1991 Pacific typhoon season</span> Typhoon season in the Pacific Ocean

    The 1991 Pacific typhoon season was a slightly above-average season with 29 tropical storms, 17 typhoons and five super typhoons forming. It was quite a catastrophic season – Typhoon Yunya impacted the Philippines in mid June while in the same time experiencing a volcanic eruption, Typhoon Mireille severely impacting Japan, which became known for being the costliest typhoon on record with US$10 billion worths of damages, and Tropical Storm Thelma on November which became one of the deadliest storms to strike the Philippines, killing at least over 5,000 people.

    <span class="mw-page-title-main">1978 Pacific hurricane season</span> Hurricane season in the Pacific Ocean

    The 1978 Pacific hurricane season was the first Pacific hurricane season to use both masculine and feminine names for tropical cyclones. It also began the modern practice of utilizing naming lists every six years. Despite lacking an El Niño, a common driver of enhanced activity in the East and Central Pacific basins, the 1978 season was active. It featured 19 named storms, 14 hurricanes, and 7 major hurricanes, the latter of which are Category 3 or stronger cyclones on the Saffir–Simpson scale. Within the confines of the Central Pacific basin, located between the International Date Line and 140°W, 13 tropical cyclones or their remnants were observed by forecasters at the Central Pacific Hurricane Center, a record number of occurrences at the time. Seasonal activity began on May 30 and ended on October 21, within the limits of a traditional hurricane season which begins on May 15 in the East Pacific and June 1 in the Central Pacific. The season ends on November 30 in both basins. These dates conventionally delimit the period during each year when most tropical cyclones form.

    <span class="mw-page-title-main">1972 Pacific hurricane season</span> Hurricane season in the Pacific Ocean

    The 1972 Pacific hurricane season was an ongoing event in tropical cyclone meteorology. There were few notable storms this year. Only one person was killed and storm effects were almost not serious at all. The most notable systems were Hurricane Celeste and Joanne. Celeste was the strongest storm of the season, and caused heavy damage to Johnston Atoll. Hurricane Joanne brought gale-force winds to the Continental United States and caused flooding in Arizona and northern Mexico, which killed one person. The only other system to directly impact land was Hurricane Annette.

    <span class="mw-page-title-main">1959 Pacific hurricane season</span> Hurricane season in the Pacific Ocean

    The 1959 Pacific hurricane season saw 15 storms develop, 5 of which became hurricanes, and 3 of those became major hurricanes. The season officially started on May 15, 1959 in the Eastern Pacific, and ended on November 30, 1959.

    <span class="mw-page-title-main">Hurricane Emilia (1994)</span> Category 5 Pacific hurricane in 1994

    Hurricane Emilia was, at the time, the strongest tropical cyclone on record in the Central Pacific Ocean, and the second of such to be classified as a Category 5 hurricane – the highest rating on the Saffir–Simpson hurricane wind scale. However, hurricanes Gilma later that year, Ioke in 2006, and Walaka in 2018 later reached lower barometric pressures in the Central Pacific. In addition, Emilia was the first Category 5 Pacific hurricane since Hurricane Ava in 1973. The fifth named storm and the first of three Category 5 hurricanes of the 1994 hurricane season, Emilia developed from an area of low pressure southeast of Hawaii on July 16. Tracking westward, the initial tropical depression intensified into a tropical storm several hours after tropical cyclogenesis. Subsequently, Emilia entered the Central Pacific Ocean and moved into the area of responsibility of the Central Pacific Hurricane Center (CPHC).

    <span class="mw-page-title-main">1967 Pacific hurricane season</span> Hurricane season in the Pacific Ocean

    The 1967 Pacific hurricane season started on June 1 and ended on November 30, 1967. The season was of little note except for Hurricanes Katrina and Olivia. Katrina made landfall on the Baja Peninsula, killing at least one and made 2,500 homeless. Olivia made landfall on the eastern side of the Baja Peninsula as a major hurricane—only one of two storms ever to do so. Hurricane/Typhoon Sarah formed in the Central Pacific and reached category 1 strength before crossing over to the Western Pacific.

    <span class="mw-page-title-main">1966 Pacific hurricane season</span> Hurricane season in the Pacific Ocean

    The 1966 Pacific hurricane season started on May 15, 1966, and ended November 30, 1966. The season was of little note. Hurricane Blanca traveled 4,300 miles, setting a new record. During September and October of the year, Hurricane Helga and Tropical Storms Kirsten, Lorraine, and Maggie hitting Mexico. Kirsten caused 8 deaths and US$5.6 million in damages in Mexico.

    <span class="mw-page-title-main">Hurricane Gilma (1994)</span> Category 5 Pacific hurricane in 1994

    Hurricane Gilma was one of the most intense Pacific hurricanes on record and the second of three Category 5 hurricanes during the active 1994 Pacific hurricane season. Developing from a westward tracking tropical wave over the open waters of the eastern Pacific Ocean on July 21, the pre-Gilma tropical depression was initially large and disorganized. Gradual development took place over the following day before rapid intensification began. By July 23, the storm intensified into a hurricane and later a Category 5 storm on July 24. As Gilma reached this intensity, it crossed into the Central Pacific basin, the fourth consecutive storm to do so.

    <span class="mw-page-title-main">Timeline of the 1994 Pacific hurricane season</span>

    The 1994 Pacific hurricane season was an event in the annual cycle of tropical cyclogenesis over the Pacific Ocean north of the Equator and east of the International Date Line. The season began on May 15 in the Eastern Pacific proper and on June 1 in the Central Pacific, and ended on November 30. These dates conventionally delineate the period each year when tropical cyclones tend to form in the basin according to the National Hurricane Center. This timeline documents the formation of tropical cyclones as well as the strengthening, weakening, landfalls, extratropical transitions, and dissipations during the season.

    References

    1. 1 2 3 4 5 6 7 8 9 10 11 12 13 14 15 "Eastern North Pacific Tracks File 1949–2007". National Hurricane Center. March 21, 2008. Archived from the original (Plaintext) on August 22, 2008. Retrieved September 23, 2008.
    2. 1 2 3 "Background Information: East Pacific Hurricane Season". Climate Prediction Center. May 22, 2008. Archived from the original on September 20, 2008. Retrieved September 23, 2008.
    3. 1 2 "Previous Tropical Systems in the Central Pacific". Central Pacific Hurricane Center. Archived from the original on September 16, 2008. Retrieved September 23, 2008.
    4. Andy Nash; Tim Craig; Sam Houston; Roy Matsuda; Jeff Powell; Ray Tanabe; Jim Weyman (July 2007). "2006 Tropical Cyclones Central North Pacific". Central Pacific Hurricane Center . Retrieved September 23, 2008.
    5. 1 2 Benjamin Hablutzel; Hans Rosendal; James Weyman; Jonathan Hoag. "The 1997 Central Pacific Tropical Cyclone Season". Central Pacific Hurricane Center. Archived from the original on October 20, 2008. Retrieved September 23, 2008.
    6. 1 2 Lixion Avila (November 22, 1994). "Preliminary Report Hurricane Rosa" (GIF). National Hurricane Center. p. 2. Retrieved September 23, 2008.
    7. "Mexican West Coast Survives Hurricane". Chicago Daily Herald. October 15, 1994. p. 3.
    8. 1 2 3 4 5 6 7 8 9 10 11 12 13 14 15 16 17 18 19 20 21 22 23 24 "The 1994 Central Pacific Tropical Cyclone Season" (PDF). Honolulu, Hawaii: Central Pacific Hurricane Center . Retrieved February 1, 2024.
    9. 1 2 3 Gary Padgett. "Monthly Global Tropical Cyclone Summary April 2004". Archived from the original on September 30, 2007. Retrieved September 23, 2008.
    10. "NOAA: 2008 Eastern Pacific Hurricane Season Outlook". Climate Prediction Center. May 22, 2008. Archived from the original on September 20, 2008. Retrieved September 23, 2008.
    11. "Historical East Pacific Seasonal Activity" (GIF). Climate Prediction Center. Archived from the original on September 25, 2008. Retrieved September 23, 2008.
    12. "NOAA: 2018 Eastern Pacific Hurricane Season Outlook". Climate Prediction Center. National Oceanic and Atmospheric Administration. May 24, 2018.
    13. 1 2 Neal Dorst. "Subject: E6) Which tropical cyclone lasted the longest?". FAQ: Hurricanes, Typhoons, and Tropical Cyclones. Atlantic Oceanographic and Meteorological Laboratory. Archived from the original on September 24, 2008. Retrieved September 24, 2008.
    14. National Hurricane Center; Hurricane Research Division; Central Pacific Hurricane Center (April 4, 2023). "The Northeast and North Central Pacific hurricane database 1949–2022". United States National Oceanic and Atmospheric Administration's National Weather Service. A guide on how to read the database is available here. PD-icon.svg This article incorporates text from this source, which is in the public domain.
    15. Richard Pasch (October 25, 1994). "Preliminary Report Tropical Storm Aletta" (GIF). National Hurricane Center. p. 1. Retrieved September 23, 2008.
    16. Richard Pasch (October 25, 1994). "Preliminary Report Tropical Storm Aletta" (GIF). National Hurricane Center. p. 2. Retrieved September 23, 2008.
    17. Edward Rappaport (July 22, 1994). "Preliminary Report Tropical Storm Bud" (GIF). National Hurricane Center. p. 1. Retrieved September 24, 2008.
    18. Edward Rappaport (July 22, 1994). "Preliminary Report Tropical Storm Bud" (GIF). National Hurricane Center. p. 2. Retrieved September 24, 2008.
    19. 1 2 Lixion Avila (July 21, 1994). "Preliminary Report Hurricane Carlotta" (GIF). National Hurricane Center. p. 1. Retrieved September 24, 2008.
    20. 1 2 Lixion Avila (July 21, 1994). "Preliminary Report Hurricane Carlotta" (GIF). National Hurricane Center. p. 2. Retrieved September 24, 2008.
    21. Max Mayfield (October 14, 1994). "Preliminary Report Tropical Storm Daniel" (GIF). National Hurricane Center. p. 1. Retrieved September 25, 2008.
    22. Max Mayfield (October 14, 1994). "Preliminary Report Tropical Storm Daniel" (GIF). National Hurricane Center. p. 2. Retrieved September 25, 2008.
    23. Miles Lawrence (August 13, 1994). "Preliminary Report Hurricane Emilia" (GIF). National Hurricane Center. p. 1. Retrieved September 24, 2008.
    24. Miles Lawrence (August 13, 1994). "Preliminary Report Hurricane Emilia" (GIF). National Hurricane Center. p. 2. Retrieved September 24, 2008.
    25. Max Mayfield (October 15, 1994). "Preliminary Report Tropical Storm Fabio" (GIF). National Hurricane Center. p. 1. Retrieved September 24, 2008.
    26. Max Mayfield (October 15, 1994). "Preliminary Report Tropical Storm Fabio" (GIF). National Hurricane Center. p. 2. Retrieved September 24, 2008.
    27. Richard J. Pasch (January 20, 1995). "Preliminary Report Hurricane Gilma" (GIF). National Hurricane Center. p. 1. Retrieved September 24, 2008.
    28. 1 2 Richard J. Pasch (January 20, 1995). "Preliminary Report Hurricane Gilma" (GIF). National Hurricane Center. p. 2. Retrieved August 18, 2008.
    29. Pasch (July 31, 1994). "Tropical Depression Eight-E Discussion 1". National Hurricane Center . Retrieved September 24, 2008.
    30. Rappaport (August 2, 1994). "Tropical Depression Eight-E Discussion Number 10". National Hurricane Center . Retrieved September 24, 2008.
    31. Hablutzel (August 3, 1994). "Tropical Depression Eight Special Discussion Number 13" (GIF). National Hurricane Center . Retrieved September 24, 2008.
    32. Farrell (August 4, 1994). "Tropical Depression Eight E Discussion 16" (GIF). National Hurricane Center . Retrieved September 24, 2008.
    33. Rosendal (August 4, 1994). "Tropical Depression Eight-E Discussion 18" (GIF). National Hurricane Center . Retrieved September 24, 2008.
    34. Hablutzel (August 8, 1994). "Tropical Storm Li Special Discussion Number 22" (GIF). National Hurricane Center . Retrieved September 14, 2008.
    35. "Typhoon Li (08E)" (PDF). 1994 Annual Tropical Cyclone Report. Joint Typhoon Warning Center. p. 106. Archived from the original (PDF) on June 7, 2011. Retrieved September 24, 2008.
    36. "Typhoon Li (08E)" (PDF). 1994 Annual Tropical Cyclone Report. Joint Typhoon Warning Center. p. 105. Archived from the original (PDF) on June 7, 2011. Retrieved September 24, 2008.
    37. Lixion Avila (September 20, 1994). "Preliminary Report Tropical Storm Hector" (GIF). National Hurricane Center. p. 1. Retrieved September 24, 2008.
    38. 1 2 Lixion Avila (September 20, 1994). "Preliminary Report Tropical Storm Hector" (GIF). National Hurricane Center. p. 2. Retrieved September 24, 2008.
    39. David M. Roth. "Tropical Storm Hector". Hydrometeorological Prediction Center. Archived from the original on October 19, 2008. Retrieved September 24, 2008.
    40. "Flood Report: Kauai Mountains". National Climatic Data Center. Archived from the original on May 19, 2011. Retrieved March 8, 2007.
    41. "Flood Report: Kauai Leeward". National Climatic Data Center. Archived from the original on July 21, 2011. Retrieved March 8, 2007.
    42. 1 2 Max Mayfield (October 17, 1994). "Preliminary Report Hurricane Ileana" (GIF). National Hurricane Center. p. 1. Retrieved September 24, 2008.
    43. Rappaport (August 11, 1994). "Tropical Storm Ileana Discussion Number 2". National Hurricane Center . Retrieved September 24, 2008.
    44. Rappaport (August 11, 1994). "Tropical Storm John Discussion Number 3". National Hurricane Center . Retrieved September 24, 2008.
    45. Max Mayfield (October 17, 1994). "Preliminary Report Hurricane Ileana" (GIF). National Hurricane Center. p. 2. Retrieved September 24, 2008.
    46. Miles Lawrence (January 3, 1995). "Preliminary Report Hurricane John" (GIF). National Hurricane Center . Retrieved September 24, 2008.
    47. "Typhoon John (10-E)" (PDF). Joint Typhoon Warning Center. p. 128. Archived from the original (PDF) on June 7, 2011. Retrieved August 24, 2008.
    48. Cappucci, Matthew (March 7, 2023). "Deadly cyclone Freddy has become Earth's longest-lived tropical storm". The Washington Post. Archived from the original on March 7, 2023. Retrieved March 7, 2023.
    49. Edward Rappaport (October 17, 1994). "Preliminary Report Hurricane Kristy" (GIG). p. 1. Retrieved September 25, 2008.
    50. Edward Rappaport (October 17, 1994). "Preliminary Report Hurricane Kristy" (GIG). p. 2. Retrieved September 25, 2008.
    51. National Hurricane Center. Hurricane Lane. Retrieved on March 8, 2007.
    52. "Behind the Name: Meaning, Origin and History of the name Mele". Behind the Name: The Etymology and History of First Names. Archived from the original on September 5, 2008. Retrieved September 24, 2008.
    53. Miles Lawrence (October 30, 1994). "Preliminary Report Tropical Storm Miriam" (GIF). National Hurricane Center. p. 1. Retrieved September 26, 2008.
    54. Max Mayfield (October 17, 1997). "Preliminary Report Tropical Storm Norman" (GIF). National Hurricane Center. p. 1. Retrieved September 26, 2008.
    55. Richard Pasch. "Preliminary Report Hurricane Olivia" (GIF). National Hurricane Center. p. 1. Retrieved September 26, 2008.
    56. Richard Pasch. "Preliminary Report Hurricane Olivia" (GIF). National Hurricane Center. p. 2. Retrieved September 26, 2008.
    57. Edward Rappaport (October 18, 1994). "Preliminary Report Tropical Storm Paul" (GIF). National Hurricane Center. p. 1. Retrieved September 24, 2008.
    58. Edward Rappaport (October 18, 1994). "Preliminary Report Tropical Storm Paul" (GIF). National Hurricane Center. p. 2. Retrieved September 24, 2008.
    59. Lixion Avila (November 22, 1994). "Preliminary Report Hurricane Rosa" (GIF). National Hurricane Center. p. 1. Retrieved September 24, 2008.
    60. Lixion Avila (November 22, 1994). "Preliminary Report Hurricane Rosa" (GIF). National Hurricane Center. p. 5. Retrieved September 24, 2008.
    61. "Mexican West Coast Survives Hurricane". Chicago Daily Herald. October 15, 1994. p. 3. Archived from the original on December 25, 2015. Retrieved September 26, 2008.
    62. David M. Roth. "Hurricane Rosa" (GIF). Hydrometeorological Prediction Center. Archived from the original on October 19, 2008. Retrieved September 24, 2008.
    63. "Floods in Southeast Texas, October 1994" (PDF). United States Geological Survey. January 1995. Retrieved September 24, 2008.
    64. "Hawaiian Names Starting with "N"". Hawaii Club of San Antonio. Retrieved October 21, 2008.[ permanent dead link ]
    65. "Search results". Behind the Name — the Etymology and History of First Names. Retrieved October 21, 2008.
    66. "Original HURDAT format". Atlantic Oceanographic and Meteorological Laboratory Hurricane Research Division. Archived from the original on October 6, 2008. Retrieved October 2, 2008.
    67. Mayfield (August 14, 1994). "Tropical Depression Twelve-E Discussion Number 1". National Hurricane Center . Retrieved September 24, 2008.
    68. 1 2 Richard Pasch (January 13, 1995). "Preliminary Report Tropical Depression Twelve-E" (GIF). National Hurricane Center . Retrieved September 25, 2008.
    69. Mayfield (August 15, 1994). "Tropical Depression Twelve-E Discussion Number 5". National Hurricane Center . Retrieved September 24, 2008.
    70. "Japan Meteorological Agency Best Tracks" (ZIP). Japan Meteorological Agency. 2015. Retrieved November 29, 2015.
    71. "bwp361994" (TXT). Joint Typhoon Warning Center. 1994. Retrieved November 29, 2015.
    72. 1 2 National Hurricane Operations Plan (PDF) (Report). Washington, D.C.: NOAA Office of the Federal Coordinator for Meteorological Services and Supporting Research. May 1994. pp. 3-8–9. Retrieved February 1, 2024.
    73. National Hurricane Operations Plan (PDF) (Report). Washington, D.C.: NOAA Office of the Federal Coordinator for Meteorological Services and Supporting Research. May 1988. p. 3-8. Retrieved February 1, 2024.
    74. "Eastern North Pacific Tropical Cyclone Name History". Atlantic Tropical Weather Center. Archived from the original on September 29, 2007. Retrieved February 1, 2024.
    75. "Tropical Cyclone Naming History and Retired Names". Miami, Florida: National Hurricane Center. Retrieved February 1, 2024.
    76. National Hurricane Operations Plan (PDF) (Report). Washington, D.C.: NOAA Office of the Federal Coordinator for Meteorological Services and Supporting Research. May 2000. p. 3-7. Retrieved February 1, 2024.