The 2002 Pacific hurricane season was an average season which produced fifteen named storms. Eight hurricanes formed, including a record-tying three Category 5 hurricanes, a record it shares with the 1994 and 2018 seasons. It was also a near-average season in terms of accumulated cyclone energy (ACE), having an ACE of 125. The season officially began on May15, 2002 in the East Pacific Ocean, and on June1, 2002 in the Central Pacific; both ended on November30. These dates conventionally delimit the period of each year when most tropical cyclone formation occurs in these regions of the Pacific. The first system of the 2002 season, Hurricane Alma, formed on May24, and the last, Tropical Depression Sixteen-E, dissipated on November16.
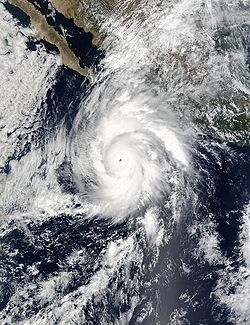
The strongest hurricane of the season, Kenna, formed on October22 and peaked as a Category5 hurricane two days later. Land impact was relatively significant. Kenna made landfall near Puerto Vallarta, located in the Mexican state of Jalisco on October 25, killing four people. Kenna was, at the time, the second-most powerful hurricane to ever strike the western coast of Mexico, hitting with winds of 140mph (220km/h), as well as the strongest landfall in terms of windspeed until Hurricane Patricia in 2015. Elsewhere, Tropical Storm Julio made landfall in Mexico, and Tropical Storm Boris dumped torrential rain along the Mexican coast, despite remaining offshore. Hurricanes Elida and Hernan also reached Category5 intensity, but neither caused any damage. Damage across the basin reached $101.23 million (2002 USD), while 7people were killed by Julio and Kenna.
Seasonal summary
The season officially began on May15 in Eastern Pacific and on June1 in Central Pacific; both ended on November30.[1] In the eastern Pacific, the season saw below average activity in terms of the number of total storms and hurricanes, but about average activity in terms of major hurricanes.[2][3] There were 16 tropical storms in the eastern Pacific Ocean in the season. Of those, eight became hurricanes, of which six became major hurricanes by reaching Category3 or higher on the Saffir–Simpson scale. Three reached Category5 intensity,[4] equaling the record set in 1994, and later equaled in 2018.[4][5] Additionally, four tropical depressions formed and dissipated before reaching the intensity of a tropical storm.[6] Three tropical storms formed in the Central Pacific Hurricane Center's area of responsibility, where overall activity was near normal. Two of the storms strengthened into hurricanes, with one of them intensifying into a major hurricane. Two additional systems tracked into the area from the eastern Pacific.[7]
Activity commenced on May24, with the formation of the first tropical depression, which became Hurricane Alma, and intensified into a rare May major hurricane. June was extremely quiet with only one named storm developing, Tropical Storm Boris. Though it remained offshore, Boris was able to dump torrential rain along the coast of southwestern Mexico.[8] There were two hurricanes and one tropical storm in July. Among them, Hurricane Elida underwent one of the fastest rates of rapid intensification on record for an eastern Pacific hurricane. It went from a 30mph (45km/h) depression to an 80mph (130km/h) hurricane in 30hours, then proceed to intensify into a 160mph (260km/h) Category5 hurricane during the 24hours that followed.[9]
August was active with five systems developing, of which three became hurricanes. Fausto peaked as a strong Category4 hurricane in the eastern Pacific, before crossing into the central Pacific as a depression. Then, after degenerating into a remnant low well northeast of Hawaii Fausto regenerated into a weak tropical storm at an unusually high latitude. Late that month, Ele became the first of two central Pacific hurricanes to cross the International Date Line into the western Pacific where they became typhoons; the other was Huko in late October.[7]Hernan closed out the month; forming on August30, it peaked at Category5 strength two days later, far from land. Activity decreased appreciably in September and October as most of the storms remained weak and were short-lived. The exception was Kenna, which formed on October22 and peaked as a Category5 hurricane two days later; it was the strongest hurricane of the season, Kenna was one of two landfalling systems this season, the other being Tropical Storm Julio in September. All casualties and most of the damage incurred during the season was caused by Kenna.[2] No named storms formed during the final few weeks of the season, which effectively came to a close on November16 when Tropical Depression Sixteen-E, dissipated.
A moderately strong El Niño, ongoing during the season, may have contributed to the disproportionate number of major hurricanes,[10] as well as reduced activity in the Atlantic.[11] Also of note was an unusual gap in storm formation during the first three weeks of August in this season,[4] historically a prime period for tropical cyclone formation.[12]
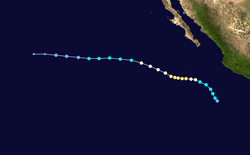
A tropical wave emerged off the west coast of Africa on May8. Generally failing to produce convection while in the Atlantic basin, the wave moved westward over the tropical Atlantic Ocean and the Caribbean Sea, entering the eastern Pacific basin on May18. Upon doing so, the wave began to generate convection, and it developed a low‑pressure area south of Guatemala on May19. The system underwent a complex interaction with a gale over the Gulf of Tehuantepec while moving slowly westward. Gradually becoming better organized, it developed into Tropical Depression One‑E on May24. The pace of further development was initially languid, with One‑E taking two days to strengthen into a tropical storm. Now named Alma, the storm turned first to the west-northwest, then to the northwest, and finally to the north as it rounded the western periphery of a subtropical ridge that was located over Mexico.[13]
Alma strengthened at a steadier rate as it gained latitude, becoming a hurricane on May28. Two days later, Alma reached its peak intensity as a low-end Category3 major hurricane with maximum sustained winds of 115mph (185km/h).[13] This made it the second Pacific major hurricane recorded in the month of May, following the previous season's Hurricane Adolph.[14] Operationally, the National Hurricane Center (NHC) assessed Alma to have been slightly weaker – with peak winds of 110mph (175km/h), at the upper bound of Category2 strength[15] – but the agency retroactively upgraded it about two months later. Shortly after peaking, Alma entered a region of cooler sea surface temperatures and southwesterly wind shear. These unfavorable conditions caused the hurricane to rapidly weaken into a tropical storm on May31. Meanwhile, steering currents decayed to the point where Alma became nearly stationary. Alma weakened into a tropical depression early on June1, and degenerated into a low‑pressure area without convection later that day without having ever impacted land.[13]
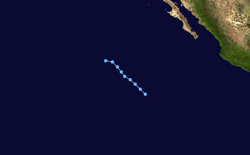
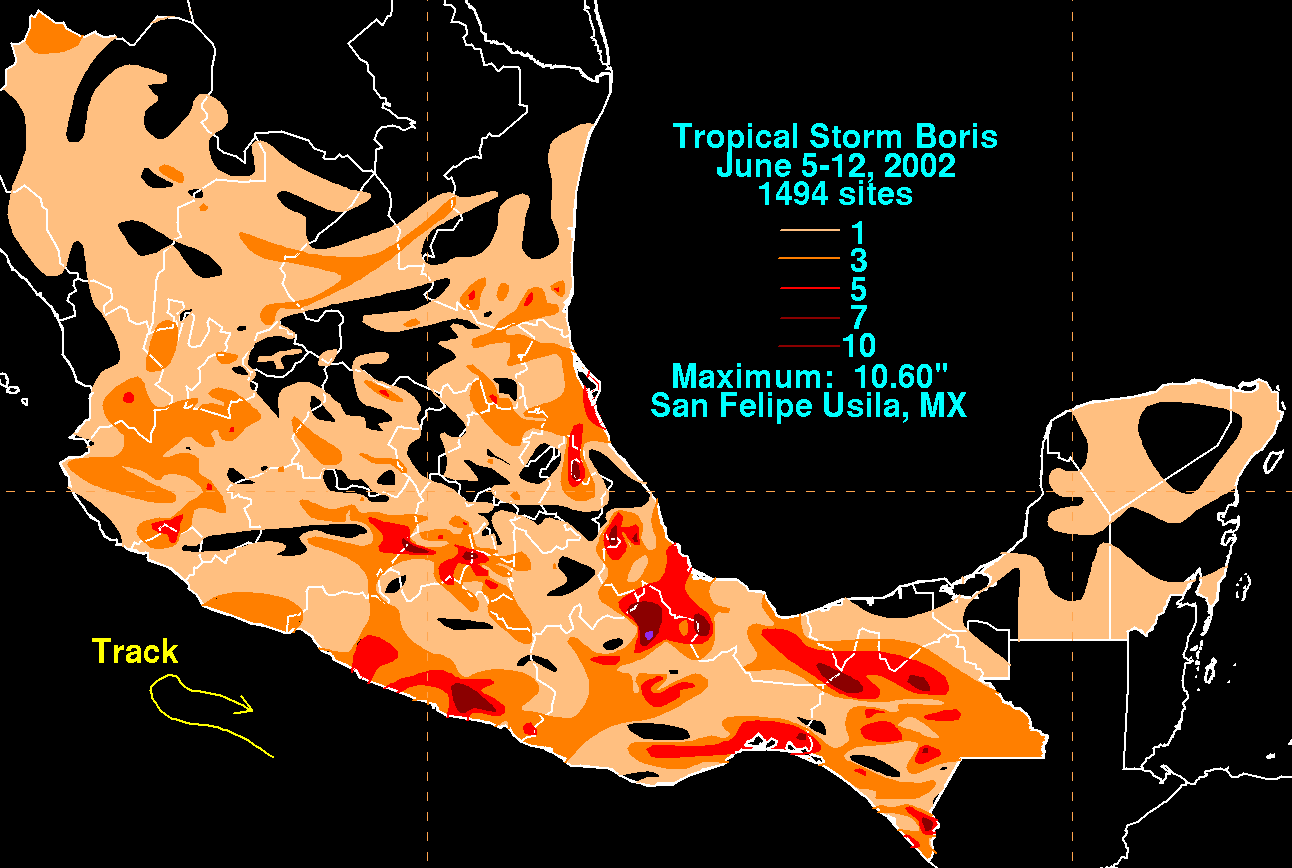
A trough of low pressure produced a large area of convection south of Mexico during the first week of June. Concurrently, a tropical wave entered the eastern Pacific basin from the southwestern Caribbean Sea and moved slowly westward toward the trough. The two features began to interact on June7, and the combined area of unsettled weather quickly became better organized. A circulation developed on June8, marking the formation of a tropical depression. The nascent cyclone steadily strengthened while moving to the west-northwest; it became a tropical storm, named Boris, early on June9 and reached peak winds of 60mph (95km/h) shortly thereafter. The motion of Boris then stalled as the storm got stuck in between two high-pressure areas. Because Boris was no longer moving in tandem with strong upper-level easterly winds, the resultant wind shear caused the storm to weaken. Boris spent the rest of its life drifting while continuing to weaken; it shifted first to the northeast, then to the east, as its intensity dropped to that of a tropical depression late on June10. The following day, Boris degenerated into a convectively barren remnant low. Boris's remnants moved southeastward until dissipating early on June12.[16]
Boris dumped heavy rains on sections of the Mexican coast. The maximum amount was 10.60 inches (269mm) at San Felipe Usila.[8] These rains damaged several homes at an unspecified location. In addition, rainfall damaged several homes in Tequila, Jalisco, but the National Hurricane Center believes that Boris likely did not cause the rain. No deaths were attributed to this storm.[16]
A tropical wave that crossed Central America organized and developed into a tropical depression on June 27.[17] Contrary to forecasts,[18] the depression did not strengthen further because of strong wind shear. By June 29, the depression had become a remnant low, which was observed as a swirl of clouds for a few more days before dissipating.[17]
An area of disturbed weather near Panama drifted to a location south of Puerto Ángel, Oaxaca, and organized into Tropical Depression Four-E on July 9. It moved westward through a hostile environment of strong shear. The wind shear disrupted the cyclone's convection and weakened its circulation. Despite the shear, the depression strengthened into a tropical storm early on July 12 and was named Cristina. This broke down the steering ridge, and Cristina turned to the north and peaked on July 14. Then, the wind shear won out and Cristina quickly weakened. Cristina dissipated into a swirl of clouds on July 16, without ever threatening land. No impact was reported.[19]
A tropical wave exited the west coast of Africa on July 8 and crossed the Atlantic without much development. In the Caribbean, showers increased, but wind shear prevented development. The wave crossed into the eastern Pacific on July 16, and wind shear decreased to allow the convection to organize. Tropical Depression Five-E developed on July20 about 395 miles (636km) south of Manzanillo, Mexico.[20] At that time, gradual strengthening was anticipated.[21] The depression quickly intensified into Tropical Storm Douglas.[20] Around that time, most of the deep convection was situated south of the atmospheric circulation.[22] Initially expected to become a hurricane only briefly,[23] late on July21, the NHC reported that Douglas had become a hurricane.[24] Upon becoming a hurricane, Douglas was situated in low wind shear environment; however, Hurricane Douglas was expected to reach cold waters in 36 hours, and thus was not predicted to become a major hurricane.[25] Douglas became a Category 2 hurricane on July22, reaching peak winds of 105 miles per hour (170km/h).[26] Douglas held this intensity for 18 hours as it traveled westward.[20] When Douglas weakened from its peak intensity, it had an organized cloud pattern, but the thunderstorm activity was weakening, typical of most Pacific hurricanes that reach cooler waters.[27] The weakening briefly stopped after Douglas went through an eyewall replacement cycle,[28] but Douglas was downgraded to a tropical storm late on July 24 as the storm only had a small area of deep convection left.[20] Tropical storm Douglas briefly stopped weakening as convection increased, only to fade away again hours later.[29] The storm was downgraded to a tropical depression early on July 26,[20] and later that day degenerated into a remnant low-pressure area.[30] The remnant low dissipated the next day.[20]
Elida formed from a tropical wave that left the coast of Africa on July 13. The wave moved uneventfully through the Atlantic Ocean and the Caribbean Sea, emerging over the Pacific Ocean on July 21. The wave began organizing the next day, becoming Tropical Depression Six-E on July 23 while 350mi (560km) south-southeast of Puerto Escondido, Mexico.[31] The depression was predicted to move westward due to the presence of a ridge of high pressure which was also controlling the movement of Hurricane Douglas.[32] Due to low shear and warm ocean waters, it was predicted that the depression would reach hurricane strength in 48hours.[32] The depression began rapid intensification while moving westward,[31] and only sixhours after being recognized as a depression, the system was upgraded to Tropical Storm Elida while displaying banding features and a central dense overcast. The forecast was revised, now predicting the storm to attain hurricane strength the next day.[33]
The storm continued to rapidly intensify and gradually developed a banding eye feature and infrared satellite images showed a possible eyewall in the central dense overcast.[34] After sixmore hours, a small eye had formed and Elida was upgraded to a high-end Category2 hurricane on the Saffir-Simpson Hurricane Scale with 110mph (180km/h) winds on July 24, only eighteenhours after having first been initiated as a 35mph (56km/h) tropical depression.[35] Elida continued to rapidly strengthen, breaking the Dvorak estimates and reaching 135mph (217km/h) sixhours afterward, making it a Category4 hurricane and resulting in a rare forecast for the hurricane to reach Category5 intensity.[36] The hurricane, moving at 16mph (26km/h), proceeded to make a west-northwestward turn while displaying an eye with an estimated diameter of 11mi (18km).[37] On July 25, Elida attained peak winds of 160mph (260km/h), making it a Category5 hurricane. At the time, the NHC assessed a slightly lower peak as a high end Category4.[38][31] At this time, Elida was observed to have formed concentric eyewalls, but it was not until the hurricane moved over cooler waters that the storm's eyewall replacement cycle was completed.[31] When the MERIS sensor aboard the European Space Agency's satellite Envisat observed and recorded Hurricane Elida at peak intensity, it was the first time that the instrument had observed a hurricane. The sensor was originally designed primarily for recording oceanic biology and water quality as well as land vegetation, clouds, and water vapor.[39]
Due to its strong intensity, Elida produced high waves that affected the Mexican coastline.[31] After its peak, the hurricane began to weaken in an irregular fashion. After the inner eyewall dissolved, the intensity of the hurricane decreased to a low-level Category3 storm, with winds of 120mph (190km/h).[40] By this time, Elida had reached the edge of the ridge that kept the cyclone from turning northwest, and a turn to the northwest was beginning. The hurricane proceeded to undergo another eyewall replacement cycle, lowering its intensity to Category2 intensity.[41] Late on July 26, the eye disappeared from satellite.[42] The weakening trend continued, and Elida weakened to a tropical storm on July 27.[31] At this time, a weakness in the subtropical ridge allowed the storm to make a turn towards the north.[43] Early on July 28, Elida began redeveloping, regaining moderate convection and possibly reintensifying,[44] but eventually, the storm weakened back into a depression early on July 29.[45] On the next day, Elida degenerated into a remnant low, and the last advisory was issued while an area of convection was displaced to the north of the center, with 12-foot (3.7m) seas in the area.[46] The center was 805mi (1,296km) from Punta Eugenia, Mexico when the last advisory was issued.[47] The remnant low of Elida moved northeast and eventually dissipated on July 31, 535mi (861km) west of Los Angeles, California.[31]
A tropical wave that had reached the Eastern Pacific from Africa was first spotted on July 23. The wave continued westward with little development occurring until August 3, when convection increased. After additional slow organization, the wave was classified as Tropical Depression Seven-E on August 6 near the tip of Baja California. The system did not strengthen much, and development was halted when wind shear destroyed the system on August 8. The depression never came near land and hence no one was killed or injured.[48] Like Tropical Depression Three-E, this cyclone was forecast to reach tropical storm intensity, but it never did.[49]
A tropical wave exited the west coast of Africa on August11 and moved across the Atlantic without developing, entering the eastern Pacific on August17. The system developed a broad circulation, eventually organizing into Tropical Depression Eight-E on August21 to the southwest of Mexico.[50] The system quickly intensified into Tropical Storm Fausto after developing rainbands.[51] Located south of a ridge, Fausto moved west-northwestward through an area of warm waters, and it continued intensifying as its outflow increased.[52][53] On August22, the storm intensified into a hurricane,[50] as an eye developed in the center of the convection.[54] On August24, Fausto reached a peak intensity with estimated peak winds of 145mph (233km/h) and a minimum barometric pressure of 936mbar (936hPa; 27.6inHg), making it a Category4 hurricane.[50] Around that time, the hurricane had a large well-defined eye surrounded by a ring of convection.[55]
Around when it reached peak intensity, Fausto encountered an area of cooler water temperatures.[56] The hurricane quickly weakened, degrading to a tropical storm on August26, by which time the convection had diminished.[57] On the next day, Fausto crossed 140˚W and entered the central Pacific. The CPHC downgraded Fausto to a remnant low on August28 while the system was located over 800mi (1,300km) north of Hilo, Hawaii on August28 at 1200 UTC. The remnants turned more to the west, toward an area of warmer waters and a tropical upper tropospheric trough. The interaction caused thunderstorms to reform, and Fausto regenerated into a tropical depression on August30 about 635mi (1,022km) north of Oahu. On September1, Fausto briefly reintensified into a tropical storm as it curved northward, steered by an approaching trough. On September3, the front absorbed Fausto, and soon after the system moved across the Aleutian Islands of Alaska.[58]
An area of convection acquired a closed circulation and became Tropical Depression One-C on August 22. It stayed disorganized for the next several days. It organized more fully and intensified into a tropical storm on August 25 and was named Alika. After peaking as a moderately strong tropical storm on August 25, wind shear caused by the pre-Ele tropical depression and an upper-level low near Hawaii weakened the storm to a depression on August 27. Alika dissipated the next day, having never threatened land.[58]
A tropical wave formed Tropical Depression Nine-E on August 26. It was upgraded to a tropical storm and named Genevieve the next day. It moved westward and nearly strengthened to a hurricane, peaking in intensity on August 28. At that point, the cyclone encountered cooler waters, which caused it to weaken slowly, weakening to a depression on August 30. The depression hung on until it lost convection on the September 2. A swirl of remnant clouds persisted for a few more days. Genevieve had no impact on land, with no reports of casualties or damage being received by the National Hurricane Center.[59]
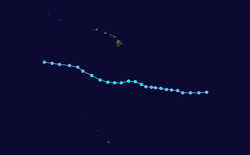
An eastern extension of the monsoon trough south of Hawaii organized into Tropical Depression Two-C on August 27 and strengthened into Tropical Storm Ele six hours later. Despite the nearby presence of Alika, Ele developed rapidly and strengthened into a hurricane on August 28. After contributing to the dissipation of Alika, Ele continued intensifying. It reached Category2 intensity late on August 28 and quickly became a major hurricane six hours later. The hurricane then crossed the International Date Line and became a typhoon in the 2002 Pacific typhoon season. Typhoon Ele turned to the northwest after crossing the dateline and continued to strengthen. It reached Category4 before turning north and weakening again. After briefly restrengthening back into a Category4, the typhoon weakened and turned to the northwest. Ele was downgraded to a tropical storm on September 7, a depression on September 9, and then dissipated shortly afterwards. Ele did not affect land.[58]
On August 16, a tropical wave left the coast of Africa. It traveled westward across the Atlantic Ocean, crossing over Central America and emerging in the eastern Pacific, where it merged with a pre-existing Intertropical Convergence Zone disturbance. The system gradually developed moderate convection, and on August 30 it had developed sufficient convection to be designated Tropical Depression 10-E.[60] The depression produced persistent strong thunderstorms, primarily in two areas of deep convection located to the northeast and west of the center of circulation.[60] Although the center was elongated, wind shear over the system remained light and outflow was good, which led forecasters to predict modest intensification.[61] On the afternoon of August 30, banding features became evident, and the depression was upgraded to Tropical Storm Hernan with sustained winds of 45mph (70km/h).[62] Further organization occurred,[62] and the center of circulation became encircled by convective thunderstorms.[63] On August 31, the storm was upgraded to a Category 1 hurricane as it moved northwestward about 400 miles (640km) southwest of Acapulco.[64]
Light wind shear and favorable ocean temperatures led to steady intensification of the storm, and satellite images indicated that an eye had developed late on August 31.[65] The storm quickly reached Category 3 hurricane intensity on the Saffir–Simpson scale.[60] As Hernan continued strengthening, its eye became ragged,[66] while its lateral movement to the northwest rose to 17mph around the southern periphery of a strong deep-layer ridge over the United States.[54] By September 1, the hurricane reached its peak intensity as a Category 5 hurricane, with 1-minute sustained winds of 160mph (255km/h) and a minimum pressure of 921mb (hPa).[60] At that time, it intensified at a rate of 1.73mbar (hPa) per hour, just under the threshold for "rapid intensification". However, for a 12-hour period from August 31 to September 1, it deepened at 2.58mbar (hPa) per hour, within the range of "explosive deepening" due to favorable conditions including light wind shear and warm water.[67]
On September 2, Hernan began weakening after its cloud tops had warmed slightly. Soon after, an eyewall replacement cycle began,[68] causing the storm to be downgraded to Category3 status, just before it turned slightly to the west later in the day.[69] The storm underwent another eyewall replacement cycle as winds decreased further.[70] As the storm entered cooler waters, it quickly weakened below major hurricane intensity.[60] Soon Hernan was downgraded to a Category1 hurricane, and its eye became cloud-filled.[71] On September 5, Hernan was downgraded to a tropical storm[60] as the storm rapidly decayed despite developing a new band of convection.[72] Later in the day, the system was downgraded to a tropical depression as it began to lose its tropical characteristics.[60] Strong wind shear developed, weakening the depression further.[73] On September 6, the system degenerated into a remnant low-pressure system,[60] which spawned a remnant plume of moisture that meandered off the coast of California, producing light showers.[60]
Hernan passed close enough to Socorro Island to bring strong winds to the island, but caused minimal damage.[60] In addition, the hurricane's large and powerful wind field caused waves between 12 foot (3.7m) and 20 foot (6.1m) in height and strong rip currents on the southwest coast of California.[74] Rough surf caused minor impact; in the open waters near the center of Hernan, waves generated by the storm were unofficially estimated to exceed 70 feet (21 meters). However, official buoys reported swells of 57 feet (17 meters).[75] Along the coast of Mexico, waves reached 15–20 feet (4.6–6.1 meters), causing minor beach erosion.[76] Other than the aforementioned regions, Hernan had no significant impact on land.[60]
Of the four tropical depressions this season that did not become named storms, only Eleven-E threatened land. An area of disturbed weather associated with a tropical wave formed into a tropical cyclone on September 5. It tracked northwestward, before turning southwest. It weakened into a remnant low on September 8. The remnant turned north and dissipated on September 10 offshore of the Baja California peninsula. The cyclone was nearly a tropical storm when it peaked on September 6. It was forecast to become a tropical storm and pass close to the peninsula. This prompted a tropical storm warning and a hurricane watch. With the weakening of the cyclone the watch and warning were discontinued. No damage or casualties were reported in association with this tropical cyclone.[77]
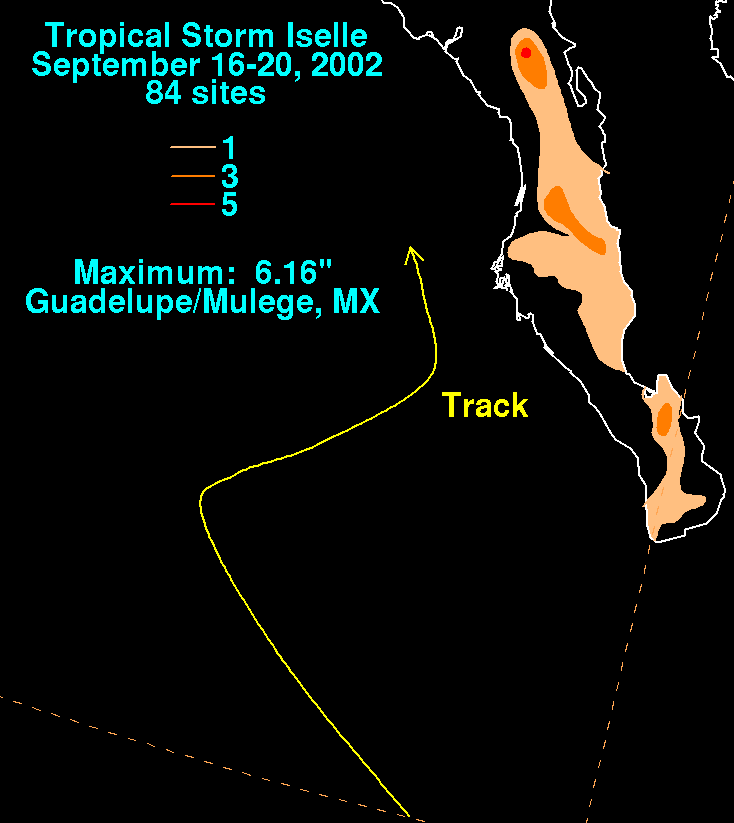
Part of the same tropical wave that formed Tropical Depression Seven in the Atlantic basin organized into Tropical Depression Twelve-E on September 15. It strengthened further into Tropical Storm Iselle the next day. The storm headed northwest and paralleled the coast of Mexico, nearly strengthening into a hurricane late on September 17. While near its peak intensity, a trough abruptly recurved the system to the northeast. Wind shear also increased, and Iselle consequently fell apart on satellite imagery. It weakened to a depression on September 19. Iselle then degenerated into a remnant low the next day and rapidly degenerated, dissipating on September 20. Iselle never made landfall.[78]
The origins of Julio were from a monsoon-like area of convection, possibly related to Hurricane Isidore, that persisted off the west coast of Central America on September 21. Thunderstorms increased, and a circulation developed late on September23. After further organization, the system developed into Tropical Depression Thirteen-E early on September25 about 100mi (160km) southwest of Acapulco.[80][81][82] Initially, the storm was expected to attain a peak intensity of 60mph (95km/h).[82] The depression intensified into Tropical Storm Julio, which attained peak winds of 45mph (70km/h) early on September26. At peak, the storm was centered just west-northwest of Lázaro Cárdenas. Soon after, Julio made landfall along the coast of Southwestern Mexico, and it rapidly deteriorated over the mountainous terrain. At 1200UTC September26, the storm was downgraded into a tropical depression.[80] Even though the storm was initially expected to enter the extreme southern Gulf of California and regain tropical storm strength,[83] Julio dissipated near Manzanillo later that day instead.[80]
Upon Julio becoming a tropical cyclone, a tropical storm warning was issued from Zihuatanejo to Punta San Telma while a tropical storm watch was in effect from Punta San Telma to Manzanillo.[84] While the storm was making landfall, Zihuatanejo reported 40mph (65km/h) winds, with gusts up to 50mph (80km/h) at 2042UTC September25.[80] The highest rainfall reported was 16.10 inches (409mm) at Zihuatanejo and La Unión, Guerrero.[85] Tropical Storm Julio was responsible for heavy rains to Zihuatanejo, where 100homes were damaged or destroyed.[86] Across the city, numerous roofs were damaged and many trees fell. Many houses and streets were flooded as well.[87] Meanwhile, in Acapulco, heavy rains triggered flash flooding that damaged another 100houses.[86] Throughout Colima, many rivers overflowed its banks.[88] Furthermore, 2,000 homes were flooded.[89] Roughly 100families were evacuated to shelters in Michoacán.[90] In addition, many small shacks lost their roof due to the storm's high winds. On the outskirts of the Taxco, situated 95mi (155km) inland, a school bus carrying 40kids flipped over, killing three and injuring 18 others.[91] An estimated 2700 acres (700 ha) of crops were lost because of the storm. Parts of Guerrero were later declared a disaster area.[92] However, the city of Zihuaranejo was quickly cleaned up proceeding the storm.[87]
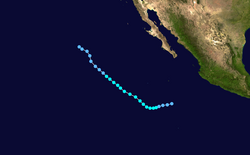
A disturbance possibly associated with a tropical wave organized into Tropical Depression Fourteen-E on October 22. It strengthened into a tropical storm that same day and a hurricane on October 23. The next day, Kenna became the third Category5 hurricane of the season. A trough over Mexico recurved the hurricane, and it started accelerating towards Mexico. Despite moving over waters that were still warm, wind shear weakened the system to a minimal Category4 by the time of its landfall over Mexico late on October 25. Mountainous terrain rapidly weakened Kenna, and the system dissipated early on October 26.[93]
Hurricane Kenna was the third-strongest Pacific hurricane to make landfall on record.[93] It was also the second-strongest October hurricane in any season, and the third strongest Pacific hurricane overall.[4] In San Blas, Nayarit, 8,800people were affected; 1,540houses were damaged or destroyed,[94] which was 80% to 90% of houses in the town.[93] In Santiago Ixcuintla, 3,770houses were damaged. Agriculture in the affected area was disrupted. Farmers required aid, and many fruit crops were destroyed. Tourism in Puerto Vallarta was disrupted,[94] with much of the damage to hotels. Insurance companies reported that Kenna's total damage was $96million (2002 USD).[95]
Kenna killed four people in Mexico and injured over a hundred. The low death toll is likely due to massive evacuations in San Blas, Nayarit, and elsewhere ahead of the hurricane.[93]
A weak tropical wave located over the open Pacific Ocean organized into Tropical Depression Fifteen-E on October 22. It strengthened into a tropical storm the next day. Shortly afterwards, wind shear increased. Lowell's convection was disrupted, and its center of circulation became exposed. The cyclone crossed into the Central Pacific Hurricane Center's area of responsibility on October 26. The shear relaxed, and the depression restrengthened into a tropical storm. Lowell drifted in slow steering currents until it approached Hurricane Huko. The proximity of Huko caused a gradual weakening in Lowell, and it dissipated on October 31.[96]
In late October, an active monsoon trough persisted south of Hawaii along 10°N latitude, developing an area of convection on October 24. Later that day, the disturbance was classified as Tropical Depression Three-C about 850mi (1,370km) south-southeast of Honolulu. Initially poorly organized, it moved to the north and steadily intensified, becoming Tropical Storm Huko early on October 26 while turning northwestward. Late on October 28, Huko reached hurricane strength, but its close proximity to Tropical Storm Lowell and a brief increase in wind shear weakened it back to a tropical storm on October 30. Shortly after turning to the west, conditions allowed for Huko to re-attain hurricane strength on October 31 while it was passing around 140mi (225km) south of Johnston Atoll. On November 2, a ridge caused the hurricane to accelerate, and the next day it crossed the International Date Line into the Western Pacific, becoming a typhoon.[58][97]
While passing near Johnston Atoll, the outer rainbands of the hurricane produced wind gusts up to 30mph (48km/h) and locally heavy rainfall.[97] The remnants of Huko later reentered the basin, eventually affecting California. The system was responsible for heavy rains, causing flooding along a small stream in Bakersfield. Total damage was approximately $23,000 (2002USD).[98]
Tropical Depression Sixteen-E formed from a disturbance in the Intertropical Convergence Zone. Despite being located in a hostile environment, it managed to organize into a tropical depression on November 14.[99] It was briefly forecast to strengthen into a tropical storm.[100] However, wind shear prevented that from occurring. Consequently, the depression degenerated into a remnant low on November 16 and dissipated soon after that.[99]
The following list of names was used for named storms that formed in the North Pacific east of 140°W during 2002.[104][105] This was the same list used for the 1996 season,[106] as no names were retired from it afterwards.
For storms that form in the North Pacific between 140°W and the International Date Line, the names come from a series of four rotating lists. Names are used one after the other without regard to year, and when the bottom of one list is reached, the next named storm receives the name at the top of the next list.[104] Three named storms, listed below, formed within the area in 2002. Also, named storms in the table above that crossed into the area during the season are noted (*).[7]
In the spring of 2003, the World Meteorological Organization retired the name Kenna from its rotating eastern Pacific name lists due to the deaths and damages it caused. Kenna was replaced with Karina for the 2008 season.[107][108]
Season effects
This is a table of all of the tropical cyclones that formed in the 2002 Pacific hurricane season. It includes their name, duration (within the basin), peak classification and intensities, areas affected, damage, and death totals. Deaths in parentheses are additional and indirect (an example of an indirect death would be a traffic accident), but were still related to that storm. Damage and deaths include totals while the storm was extratropical, a wave, or a low, and all of the damage figures are in 2002 USD.
↑ Neal Dorst (June 2, 2016). "TCFAQ G1) When is hurricane season?". Atlantic Oceanographic and Meteorological Laboratory. Archived from the original on May 6, 2009. Retrieved July 24, 2018.
1 2 3 Andy Nash; Hans Rosendal; Brooke Bingaman; Treena Loos; Jeff Fournier (May 2003). 2002 Central North Pacific Tropical Cyclones(PDF) (Report). Honolulu, Hawaii: Central Pacific Hurricane Center. Retrieved January 30, 2024.
1 2 James Franklin (September 25, 2002). Tropical Depression Thirteen-E Discussion 1. United States National Oceanic and Atmospheric Administration's National Weather Service (Report). United States National Hurricane Center. Retrieved May 19, 2013.
↑ James Franklin; Eric Blake (September 26, 2002). Tropical Storm Julio Discussion 5. United States National Oceanic and Atmospheric Administration's National weather Service (Report). United States National Hurricane Center. Retrieved May 19, 2013.
↑ "International News". Associated Press Worldstream. September 25, 2002.
↑ National Hurricane Operations Plan(PDF) (Report). Washington, D.C.: NOAA Office of the Federal Coordinator for Meteorological Services and Supporting Research. May 1996. p.3-8. Retrieved January 30, 2024.
↑ National Hurricane Operations Plan(PDF) (Report). Washington, D.C.: NOAA Office of the Federal Coordinator for Meteorological Services and Supporting Research. May 2003. p.3-8. Retrieved January 30, 2024.
This page is based on this Wikipedia article Text is available under the CC BY-SA 4.0 license; additional terms may apply. Images, videos and audio are available under their respective licenses.


