The Weather Prediction Center issues storm summaries on storm systems bringing significant rainfall and snowfall to portions of the United States. They also forecast precipitation amounts for the lower 48 United States for systems expected to impact the country over the next seven days. Advisories are also issued for tropical cyclones which have moved inland, weakened to tropical depression strength, and are no longer the responsibility of the National Hurricane Center. The Weather Prediction Center also acts as the backup office to the National Hurricane Center in the event of a complete communications failure.
Long range climatological forecasts are produced by the Climate Prediction Center (CPC), a branch of the National Weather Service. These include 8–14 day outlooks, monthly outlooks, and seasonal outlooks.
History
From the early days of organized weather collection in the United States, a central facility was used to gather and disseminate data. Originally, this task occupied[when?] a single room within the United States Army Signal Service in Washington, D.C. Reports were collected via telegraph and general forecasts were made for the country.[citation needed]
While WPC's roots lie deep in the past,[when?] the organization can be most directly traced to the formation of the Analysis Center by Circular Letter 39-42, signed by Weather Bureau director Francis W. Reichelderfer on March 5, 1942.[1][2] Operations began on March 16, 1942, with the unit collocated with the Weather Bureau Central Office at 24th and M Streets NW in Washington, D.C.[3] Initially the unit was sometimes referred to as the Master Analysis Center.
In 1947, the Analysis Center was combined with the Air Force Master Analysis Center and the Navy Weather Central to create the Weather Bureau-Air Force-Navy (WBAN) Analysis Center. Their operations commenced on June 16, 1947, at 24th and M Streets NW. By early 1950 the WBAN Analysis Center consisted of 150 employees.[4] Medium range forecasting was done nationally to 54hours in the future.[4] Charts and maps were created at this facility for national distribution.[5]
In July 1954, the Joint Numerical Weather Prediction Unit (JNWPU) was created to test out numerical weather prediction (NWP) techniques by computer. This unit co-located with the WBAN analysis center to form the National Weather Analysis Center, which was located in Suitland, Maryland. When the two units merged, the name changed to the National Meteorological Center (NMC) in January 1958. When the JNWPU dissolved in 1961, NMC became an independent organization from Global Weather Central and Fleet Numerical Weather Central.[6] Research and computer processing abilities increased over the years, which allowed for the first global forecast model to run by June 1966. By January 1975, much of the facility, minus the computers, moved to the World Weather Building, located in nearby Camp Springs, Maryland.[5]
The mission of the WPC is to provide forecast, guidance, and analysis products and services to support the daily public forecasting activities of the NWS and its customers, and to provide tailored support to other government agencies in emergency and special situations.[8]
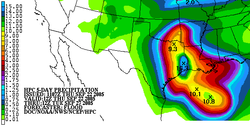
The QPF desks prepare and issue forecasts of accumulating (quantitative) precipitation, heavy rain, heavy snow, and highlights areas with the potential for flash flooding, with forecasts valid over the following five days. These products are sent to the National Weather Service forecast offices and are available on the Internet for public use. Heavy snow forecast products, in association with the short-range public forecast products (described below), serve as a coordinating mechanism for the national winter storm watch and warning program.[9]
One desk of the National Environmental Satellite Data and Information Service (NESDIS) is co-located with the WPC QPF desks, which together form the National Precipitation Prediction Unit (NPPU). NESDIS meteorologists prepare estimates of rainfall and current trends based on satellite data, and this information is used by the Day 1 QPF forecaster to help create individual 6-hourly forecasts that cover the next 12 hours. With access to WSR-88D/Doppler weather radar data, satellite estimates, and NCEP model forecast data as well as current weather observations and WPC analyses, the forecaster has the latest data for use in preparation of short-range precipitation forecasts. Meteorological reasoning discussions are regularly written and issued with the forecast packages to explain and support the forecast.[9]
Winter weather forecasts
The WPC Winter Weather Desk issues heavy snow and icing forecast products, which support the NWS winter weather watch/warning/outlook program. These forecasts are for the contiguous United States (CONUS) and issued from September 15 to May 15 each cold season. Graphical forecasts are issued twice daily at 0900 UTC and 2100 UTC (4AM/PM EST respectively), although updates may be warranted by rapidly changing conditions.
The Winter Weather Desk issues probabilistic heavy snow and icing guidance products for the next three days. The forecasts represent the probability that freezing rain or combined snow/sleet accumulations will meet specific criteria within a 24-hour period. These products are issued in probabilistic form to better represent the forecast uncertainty associated with a particular event. The Winter Weather Desk produces a heavy snow and icing discussion that provides the meteorological reasoning for the 24-hour probabilistic heavy snow and icing guidance graphics. This text message is used by internal and external clients including NWS field offices, Department of Homeland Security, FEMA, the White House, Department of Commerce, FAA, and the general meteorological community (private sector and the media).[9]
Graphical short term forecasts
The short range forecasters are responsible for preparing forecasts for the time period of 6 through 60 hours. These products are issued twice daily using guidance from the NWS's Global Forecast System (GFS) and North American Mesoscale Model (NAM), as well as guidance from the European Centre for Medium-Range Weather Forecasts (ECMWF), the United Kingdom's Met Office (UKMET), the Meteorological Service of Canada, including ensembles. Coordination with the surface analysis, model diagnostics, quantitative precipitation, winter weather, and tropical forecast desks is performed during the short range forecast process to maintain internal consistency. The short range forecast products include surface pressure patterns, circulation centers and fronts for 6–60 hours, and a depiction of the types and extent of precipitation that are forecast at the valid time of the chart. In addition, discussions are written on each shift and issued with the forecast packages that highlight the meteorological reasoning behind the forecasts and significant weather across the continental United States.[9]
Medium range forecasts
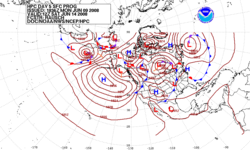
Forecast of surface pressures five days into the future for the north Pacific, North America, and north Atlantic Ocean.
Medium range forecasters are responsible for preparing forecasts for three to seven days into the future. Surface pressure forecasts are issued three times per day, with temperature and probability of precipitation products issued twice per day, using guidance from the NWS medium range forecast model (GFS) as well as models from the European Centre for Medium Range Weather Forecasting (ECMWF), the United Kingdom's Meteorology Office (UKMET), Canadian model, the Navy NOGAPS model, and ensemble guidance from the GFS, ECMWF, Canadian, and North American Ensemble Forecast System (NAEFS).
The medium range forecast products include surface pressure patterns, circulation centers and fronts, daily maximum and minimum temperatures and anomalies, probability of precipitation in 12-hour increments, total 5-day precipitation accumulation for the next five days, and 500 hPa (mb) height forecasts for days 3–7. In addition, a narrative is issued for each set of forecasts highlighting forecast reasoning and significant weather over the Continental United States. Separate forecasts, similar to the 5-day mean products, are prepared for Hawaii.[9]
Alaska medium range forecasts
The Alaska medium range forecasters review the latest deterministic and ensemble model guidance (similar to how the broader medium range forecasts are created) in an effort to compose the most likely forecast for Alaska and surrounding areas valid from four to eight days into the future.
The Alaska medium range discussion, 500 hPa height graphics, and surface fronts and pressures graphics for days 4–8 are issued once per day, year-round. Additionally, gridded guidance for the forecast period is issued for the following fields: maximum/minimum temperature grids, twelve-hour probability of precipitation grids, as well as derived dewpoint temperature, cloud cover, precipitation type, and wind speed/direction grids at a 5km (3.1mi) horizontal resolution.[9]
Model diagnostics and interpretation
The purpose of the WPC Model Diagnostic Discussion is to provide objective information and subjective interpretation concerning the current runs of the NCEP short range numerical models. The WPC model diagnostic meteorologist prepares the Model Diagnostic Discussion twice per day in two parts, corresponding to the 0000 UTC and 1200 UTC model runs. This narrative consists of three sections: an evaluation of the initialization of the NAM and GFS, a review of model trends and biases, and a description of model differences and preferences. The meteorologist reviews how the suite of models from the latest forecast cycle differ from each other in their forecasts of significant features, and makes a preference based upon all relevant current information.[9]
Surface analysis
A surface weather analysis for the United States on October 21, 2006.
The WPC Surface Analysis is part of the NWS Unified Surface Analysis and a collaborative effort with the Ocean Prediction Center, the National Hurricane Center, and the Honolulu Weather Forecast Office. The WPC focuses on the synoptic and mesoscale features over North America, primarily north of 31N. The surface analysis is a manual analysis of surface fronts and pressure over North America and adjacent oceans performed every three hours. The analysis utilizes a variety of weather data in addition to observations of surface weather conditions, such as upper air observations, global satellite imagery, Doppler weather radar, and model mass fields to ensure that the product is meteorologically consistent.[9]
Tropical cyclone forecast duties
The WPC is the official backup center to the National Hurricane Center (NHC). In this capacity, the WPC is responsible for issuing all tropical cyclone products, including discussions, graphics and watches and warnings that would normally be issued by the NHC for any tropical system in the Atlantic Ocean, if NHC is unable to so.[9]
During the tropical weather season which runs from May 15 – November 30, the WPC has several other routine duties pertaining to tropical weather forecasting. Through 2008, WPC provided track forecast guidance to the NHC whenever there is a tropical cyclone in the Atlantic Ocean basin west of 60W longitude. As required, this guidance is provided to the NHC four times daily for use in the tropical cyclone package issued by the NHC at 0300 UTC, 0900 UTC, 1500 UTC and 2100 UTC. The WPC participates in the Hurricane Hotline call with the NHC and other forecast offices and government agencies at 1700 UTC for tropical cyclones in the Atlantic Ocean basin west of 60W longitude. Also, points for days 6 and 7 for existing tropical cyclones east of 140W longitude,[10] and days 3–7 to possible future tropical cyclones, are coordinated between the medium range pressures desk and NHC each day at 1700 UTC during the hurricane season. This coordination call began between the Extended Forecast Section and the Miami Hurricane Warning Office prior to 1959.[11]
Within the WPC tropical program, the lead forecaster on shift, who prepares the day 1 QPF, is to provide the rainfall statement for tropical cyclones that are expected to make landfall. This statement is included in the Public Advisory issued by the NHC, and is a forecast of expected rainfall amounts that will occur with the tropical cyclone.[12]
Finally, the WPC surface analysis desk has the responsibility for issuing Public Advisories whenever a tropical cyclone has made landfall in the U.S. or adjacent parts of Mexico, has weakened below tropical storm status (i.e. to a tropical depression or post-tropical cyclone or low) and is not expected to re-emerge over water as a tropical cyclone, yet the system is still capable of producing flooding type rains. This WPC Public Advisory will continue to be issued until the flooding rainfall threat is over. The advisory will contain information on how much rainfall has occurred with a particular tropical system, and will also include forecast information on the remnants of the system.[9] This responsibility has been held by the center since 1973.
Short-term forecasts (mesoscale discussions)
Short-term forecasts are made at the meteorological watch (metwatch) desk. It issues mesoscale precipitation discussions (MPDs) as flash flood guidance for NWS forecast offices (NWSFOs), NWS River Forecast Centers (RFCs), the media, emergency managers, and other users. MPDs contain technical discussions concerning heavy rainfall events and expected impacts on flash flooding. They are ideally issued 1–6 hours preceding an event, include graphical descriptions of the details and the area covered. Their size typically is about half the size of Kansas. There are three headlines ordered by severity: "flash flooding likely", "flash flooding possible", or "flash flooding unlikely".[13] Mesoscale discussions (MDs) once were issued by the Storm Prediction Center (SPC) for both convective (MCDs) and precipitation (MPDs) events but WPC now covers this heavy rainfall function.
International desks
The International desks have a variety of responsibilities, primarily the training of foreign visitors in the use of Numerical Weather Prediction products. The International desk routinely hosts visitors from Central and South America and the Caribbean. Visiting meteorologists train, and also generate forecasts for their own national centers, and assist WPC forecasters with QPF related to tropical cyclones in Central America and the Caribbean.[9]
This page is based on this Wikipedia article Text is available under the CC BY-SA 4.0 license; additional terms may apply. Images, videos and audio are available under their respective licenses.