| Timeline of the 2002 Pacific hurricane season | |||||
|---|---|---|---|---|---|
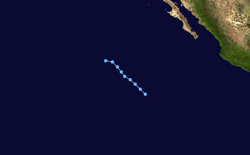
 Season summary map | |||||
| Season boundaries | |||||
| First system formed | May 24, 2002 | ||||
| Last system dissipated | November 16, 2002 | ||||
| Strongest system | |||||
| Name | Kenna | ||||
| Maximum winds | 270 km/h (165 mph) (1-minute sustained) | ||||
| Lowest pressure | 913 hPa (mbar) | ||||
| Longest lasting system | |||||
| Name | Fausto | ||||
| Duration | 11.50 days | ||||
| |||||
The 2002 Pacific hurricane season consisted of the events that occurred in the annual cycle of tropical cyclone formation over the Pacific Ocean north of the equator and east of the International Date Line. The official bounds of each Pacific hurricane season are dates that conventionally delineate the period each year during which tropical cyclones tend to form in the basin according to the National Hurricane Center (NHC), beginning on May 15 in the Eastern Pacific proper (east of 140°W) and June 1 in the Central Pacific (140°W to the International Date Line), and ending on November 30 in both areas. However, tropical cyclogenesis is possible at any time of year. [1] The first tropical cyclone of the season, Hurricane Alma, developed on May 24; the final system, Tropical Depression Sixteen-E, dissipated on November 16.
Contents
- Timeline of events
- May
- June
- July
- August
- September
- October
- November
- Notes
- See also
- References
- External links
Nineteen tropical depressions developed during the 2002 season, with fifteen further strengthening into named tropical storms; [nb 1] eight became hurricanes, of which six attained major hurricane status. [nb 2] [2] [3] : 2379 Activity was generally near normal, with the number of tropical storms and hurricanes matching the respective 1991–2020 averages; however, the number of major hurricanes was above the average of four for the same period. [1] [3] : 2379 Hurricanes Elida, Hernan, and Kenna achieved Category 5 strength on the Saffir–Simpson scale, tying a record set in 1994 for the most storms to do so in one season since reliable records began in 1971. [4]
Hurricane Kenna in late October was by far the most impactful storm of the season. After weakening from its peak intensity—which was marked by a minimum barometric pressure of 913 mbar (26.96 inHg), making it the fourth-most intense Pacific hurricane on record [5] —Kenna made landfall on the coast of western Mexico at Category 4 status with maximum sustained winds of 140 mph (220 km/h). These winds, combined with a storm surge of up to 16 feet (4.9 m), devastated the area surrounding the fishing village of San Blas, Nayarit, where as many as 95% of homes were damaged or destroyed; four people were killed. [3] : 2390 [6] The name Kenna would later be retired on account of the hurricane's effects in Mexico. [7]
Aside from Kenna, effects on land were relatively light during the season. Tropical Storm Julio struck southern Mexico in late September, causing torrential rainfall; flash floods damaged structures, and slick roads contributed to a bus accident that killed three people. [8] Tropical Storms Boris and Iselle generated heavy rainfall in Mexico without coming ashore, while Tropical Depression Eleven-E prompted the issuance of a tropical storm warning and hurricane watch for portions of the Baja California peninsula but dissipated off the coast without impact. [9] [10] [11] Hurricanes Alma and Fausto were noted for unusual meteorological feats, though neither storm affected land; Alma followed 2001's Hurricane Adolph as only the second known Pacific major hurricane in the month of May, [12] while Fausto regenerated into a tropical storm far to the north of the Hawaiian Islands, where tropical cyclones are rarely observed. [2]
Prior to 2015, two time zones were utilized in the Eastern Pacific basin: Pacific east of 140°W, and Hawaii−Aleutian from 140°W to the International Date Line. [13] [14] For convenience, each event is listed in Coordinated Universal Time (UTC) first, using the 24-hour clock (where 00:00 = midnight UTC), [15] with the respective local time included in parentheses. Figures for maximum sustained winds and position estimates are rounded to the nearest five units (knots, miles, or kilometers) and averaged over one minute, following National Hurricane Center practice. Direct wind observations are rounded to the nearest whole number. Atmospheric pressures are listed to the nearest millibar and nearest hundredth of an inch of mercury. This timeline documents the formation of tropical cyclones as well as the strengthening, weakening, landfalls, extratropical transitions, and dissipations during the season. It also includes information that was not released while the storm was active, meaning that data from post-storm reviews by the National Hurricane Center and the Central Pacific Hurricane Center is included.