List of the most intense tropical cyclones Last updated December 12, 2025
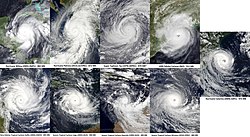
Taken by various of satellites throughout the modern era, these are the most intense tropical cyclones in each basin. Out of all these tropical cyclones, Typhoon Tip had the lowest atmospheric pressure measured in a tropical cyclone, at 870 mbar (25.69 inHg) . It is the third image in the first row. This is a list of the most intense tropical cyclones as measured by minimum atmospheric pressure at sea level. Although maximum sustained winds are often used to measure intensity as they commonly cause notable impacts over large areas, and most popular tropical cyclone scales are organized around sustained wind speeds, variations in the averaging period of winds in different basins make inter-comparison difficult. In addition, other impacts like rainfall, storm surge, area of wind damage, and tornadoes can vary significantly in storms with similar wind speeds. The minimum central pressure at sea level is often used to compare tropical cyclones because the measurements are easier and use consistent methodology worldwide, in contrast to difficult-to-estimate maximum sustained winds whose measurement methods vary widely. Tropical cyclones can attain some of the lowest pressures over large areas on Earth. However, although there is a strong connection between lowered pressures and higher wind speeds, storms with the lowest pressures may not have the highest wind speeds, as each storm's relationship between wind and pressure is slightly different. [ 1]
In the most recent and reliable records, most tropical cyclones which attained a pressure of 900 hPa (mbar ) (26.56 inHg ) or less have occurred in the Western North Pacific Ocean. The strongest tropical cyclone recorded worldwide, as measured by minimum central pressure , was Typhoon Tip , which reached a pressure of 870 hPa (25.69 inHg) on October 12, 1979. [ 2] Furthermore, on October 23, 2015, Hurricane Patricia attained the strongest 1-minute sustained winds on record at 185 knots (95 m/s; 215 mph; 345 km/h) . [ 3]
Data for the most intense tropical cyclones globally are provided below, then subdivided by basin . Data listed are provided by the official Regional Specialized Meteorological Centre , unless otherwise noted.
North Atlantic Ocean Hurricane Allen at peak intensity, peaking with the highest winds in a tropical cyclone ever recorded in the Atlantic basin
Hurricane Wilma at peak intensity, peaking with the lowest pressure in a tropical cyclone ever recorded in the Atlantic basin
The most intense storm in the North Atlantic by lowest pressure was Hurricane Wilma . The strongest storm by 1-minute sustained winds was Hurricane Allen .
Storms which reached a minimum central pressure of 920 millibars (27.17 inHg) or less are listed. Storm information has been compiled back to 1851, though measurements were rarer until aircraft reconnaissance started in the 1940s, and inexact estimates were still predominant until dropsondes were implemented in the 1970s. [ 4]
Cyclone Season Peak classification Peak 1-min Pressure "Cuba" 1924 Category 5 hurricane
270 km/h (165 mph) 910 hPa (26.87 inHg) "Cuba" 1932 Category 5 hurricane
280 km/h (175 mph) 915 hPa (27.02 inHg) "Labor Day" 1935 Category 5 hurricane
295 km/h (185 mph) 892 hPa (26.34 inHg) "Great Atlantic" 1944 Category 5 hurricane
260 km/h (160 mph) 918 hPa (27.11 inHg) Janet 1955 Category 5 hurricane
280 km/h (175 mph) 914 hPa (26.99 inHg) Esther 1961 Category 5 hurricane
260 km/h (160 mph) 919 hPa (27.14 inHg) Hattie 1961 Category 5 hurricane
270 km/h (165 mph) 914 hPa (26.99 inHg) Camille 1969 Category 5 hurricane
280 km/h (175 mph) 900 hPa (26.58 inHg) Allen 1980 Category 5 hurricane
305 km/h (190 mph) 899 hPa (26.55 inHg) Gloria 1985 Category 4 hurricane
230 km/h (145 mph) 919 hPa (27.14 inHg) Gilbert 1988 Category 5 hurricane
295 km/h (185 mph) 888 hPa (26.22 inHg) Hugo 1989 Category 5 hurricane
260 km/h (160 mph) 918 hPa (27.11 inHg) Opal 1995 Category 4 hurricane
240 km/h (150 mph) 916 hPa (27.05 inHg) Mitch 1998 Category 5 hurricane
285 km/h (180 mph) 905 hPa (26.72 inHg) Isabel 2003 Category 5 hurricane
270 km/h (165 mph) 915 hPa (27.02 inHg) Ivan 2004 Category 5 hurricane
270 km/h (165 mph) 910 hPa (26.87 inHg) Katrina 2005 Category 5 hurricane
280 km/h (175 mph) 902 hPa (26.64 inHg) Rita 2005 Category 5 hurricane
285 km/h (180 mph) 895 hPa (26.43 inHg) Wilma 2005 Category 5 hurricane
295 km/h (185 mph) 882 hPa (26.05 inHg) Dean 2007 Category 5 hurricane
280 km/h (175 mph) 905 hPa (26.72 inHg) Irma 2017 Category 5 hurricane
285 km/h (180 mph) 914 hPa (26.99 inHg) Maria 2017 Category 5 hurricane
280 km/h (175 mph) 908 hPa (26.81 inHg) Michael 2018 Category 5 hurricane
260 km/h (160 mph) 919 hPa (27.14 inHg) Dorian 2019 Category 5 hurricane
295 km/h (185 mph) 910 hPa (26.87 inHg) Iota 2020 Category 4 hurricane
250 km/h (155 mph) 917 hPa (27.08 inHg) Milton 2024 Category 5 hurricane
285 km/h (180 mph) 895 hPa (26.43 inHg) Erin 2025 Category 5 hurricane
260 km/h (160 mph) 915 hPa (27.02 inHg) Humberto 2025 Category 5 hurricane
260 km/h (160 mph) 918 hPa (27.11 inHg) Melissa 2025 Category 5 hurricane
295 km/h (185 mph) 892 hPa (26.34 inHg) Source: Atlantic Hurricane Best Track File 1851–2024 (NHC ) [ 5]
Eastern Pacific Ocean Hurricane Patricia shortly after peak intensity, highest global sustained winds and lowest pressure in the Western Hemisphere
Hurricane Ioke at its record peak intensity, also the most intense hurricane ever recorded in the Central Pacific
The most intense storm in the Eastern Pacific Ocean by both sustained winds and central pressure was Hurricane Patricia . Its sustained winds of 345 km/h (215 mph) are also the highest on record globally.
Storms with a minimum central pressure of 925 hPa (27.32 inHg) or less are listed. Storm information was less reliably documented and recorded before 1949, and most storms since are only estimated because landfalls (and related reconnaissance) are less common in this basin. [ 6]
Cyclone Season Peak classification Peak 1-min Pressure Ava 1973 Category 5 hurricane
260 km/h (160 mph) 915 hPa (27.02 inHg) Annette 1976 Category 4 hurricane
220 km/h (140 mph) 925 hPa (27.32 inHg) Trudy 1990 Category 4 hurricane
250 km/h (155 mph) 924 hPa (27.29 inHg) Gilma 1994 Category 5 hurricane
260 km/h (160 mph) 920 hPa (27.17 inHg) Olivia 1994 Category 4 hurricane
240 km/h (150 mph) 923 hPa (27.26 inHg) Guillermo 1997 Category 5 hurricane
260 km/h (160 mph) 919 hPa (27.14 inHg) Linda 1997 Category 5 hurricane
295 km/h (185 mph) 902 hPa (26.64 inHg) Juliette 2001 Category 4 hurricane
230 km/h (145 mph) 923 hPa (27.26 inHg) Elida 2002 Category 5 hurricane
260 km/h (160 mph) 921 hPa (27.20 inHg) Hernan 2002 Category 5 hurricane
260 km/h (160 mph) 921 hPa (27.20 inHg) Kenna 2002 Category 5 hurricane
270 km/h (165 mph) 913 hPa (26.96 inHg) Ioke 2006 Category 5 hurricane
260 km/h (160 mph) 915 hPa (27.02 inHg) Rick 2009 Category 5 hurricane
285 km/h (180 mph) 906 hPa (26.75 inHg) Celia 2010 Category 5 hurricane
260 km/h (160 mph) 921 hPa (27.20 inHg) Marie 2014 Category 5 hurricane
260 km/h (160 mph) 918 hPa (27.11 inHg) Odile 2014 Category 4 hurricane
220 km/h (140 mph) 918 hPa (27.11 inHg) Patricia 2015 Category 5 hurricane
345 km/h (215 mph) 872 hPa (25.75 inHg) Walaka 2018 Category 5 hurricane
260 km/h (160 mph) 921 hPa (27.20 inHg) Willa 2018 Category 5 hurricane
260 km/h (160 mph) 925 hPa (27.32 inHg) Otis 2023 Category 5 hurricane
270 km/h (165 mph) 922 hPa (27.23 inHg) Source: East Pacific Hurricane Best Track File 1949–2024 (NHC ) [ 7]
Western Pacific Ocean Typhoon Tip at its record peak intensity on October 12 The most intense storm by lowest pressure and peak 10-minute sustained winds was Typhoon Tip , which was also the most intense tropical cyclone ever recorded in terms of minimum central pressure.
Storms with a minimum pressure of 899 hPa (26.55 inHg) or less are listed. Storm information was less reliably documented and recorded before 1950. [ 6]
Cyclone Year Peak classification Peak 10-min Pressure Unnamed 1927 Unknown
Not specified 887 hPa (26.19 inHg) [ 8] Allyn 1949 Violent typhoon
Not specified 884 hPa (26.10 inHg) Clara 1950 Violent typhoon
Not specified 899 hPa (26.55 inHg) Marge 1951 Violent typhoon
Not specified 886 hPa (26.16 inHg) Wilma 1952 Violent typhoon
Not specified 893 hPa (26.37 inHg) Nina 1953 Violent typhoon
Not specified 885 hPa (26.13 inHg) Ida 1954 Violent typhoon
Not specified 890 hPa (26.28 inHg) Ida 1958 Violent typhoon
Not specified 877 hPa (25.90 inHg) Vera 1959 Violent typhoon
Not specified 895 hPa (26.43 inHg) Joan 1959 Violent typhoon
Not specified 885 hPa (26.13 inHg) Nancy 1961 Violent typhoon
Not specified 882 hPa (26.05 inHg) Violet 1961 Violent typhoon
Not specified 895 hPa (26.43 inHg) Emma 1962 Violent typhoon
Not specified 890 hPa (26.28 inHg) Karen 1962 Violent typhoon
Not specified 894 hPa (26.40 inHg) Sally 1964 Violent typhoon
220 km/h (140 mph) 895 hPa (26.43 inHg) Wilda 1964 Violent typhoon
Not specified 895 hPa (26.43 inHg) Opal 1964 Violent typhoon
Not specified 895 hPa (26.43 inHg) Kit 1966 Violent typhoon
Not specified 880 hPa (25.99 inHg) Elsie 1969 Violent typhoon
Not specified 895 hPa (26.43 inHg) Viola 1969 Violent typhoon
Not specified 896 hPa (26.46 inHg) Hope 1970 Violent typhoon
Not specified 895 hPa (26.43 inHg) Amy 1971 Violent typhoon
Not specified 890 hPa (26.28 inHg) Irma 1971 Violent typhoon
Not specified 885 hPa (26.13 inHg) Patsy 1973 Violent typhoon
Not specified 895 hPa (26.43 inHg) Nora 1973 Violent typhoon
Not specified 875 hPa (25.84 inHg) June 1975 Violent typhoon
Not specified 875 hPa (25.84 inHg) Louise 1976 Violent typhoon
205 km/h (125 mph) 895 hPa (26.43 inHg) Rita 1978 Violent typhoon
220 km/h (140 mph) 880 hPa (25.99 inHg) Tip 1979 Violent typhoon
260 km/h (160 mph) 870 hPa (25.69 inHg) Wynne 1980 Violent typhoon
220 km/h (140 mph) 890 hPa (26.28 inHg) Elsie 1981 Violent typhoon
220 km/h (140 mph) 895 hPa (26.43 inHg) Mac 1982 Violent typhoon
220 km/h (140 mph) 895 hPa (26.43 inHg) Abby 1983 Violent typhoon
230 km/h (145 mph) 895 hPa (26.43 inHg) Forrest 1983 Violent typhoon
205 km/h (125 mph) 885 hPa (26.13 inHg) Marge 1983 Violent typhoon
205 km/h (125 mph) 895 hPa (26.43 inHg) Vanessa 1984 Violent typhoon
220 km/h (140 mph) 880 hPa (25.99 inHg) Dot 1985 Violent typhoon
220 km/h (140 mph) 895 hPa (26.43 inHg) Betty 1987 Violent typhoon
205 km/h (125 mph) 890 hPa (26.28 inHg) Flo 1990 Violent typhoon
220 km/h (140 mph) 890 hPa (26.28 inHg) Ruth 1991 Violent typhoon
215 km/h (130 mph) 895 hPa (26.43 inHg) Yuri 1991 Violent typhoon
220 km/h (140 mph) 895 hPa (26.43 inHg) Megi 2010 Violent typhoon
230 km/h (145 mph) 885 hPa (26.13 inHg) Haiyan 2013 Violent typhoon
230 km/h (145 mph) 895 hPa (26.43 inHg) Meranti 2016 Violent typhoon
220 km/h (140 mph) 890 hPa (26.28 inHg) Surigae 2021 Violent typhoon
220 km/h (140 mph) 895 hPa (26.43 inHg) Source: Western North Pacific Typhoon Best Track File 1951–2025 (JMA ) [ 9]
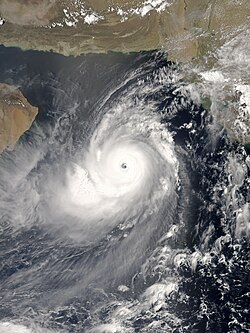
North Indian Ocean The most intense tropical cyclone in the North Indian Ocean by both sustained winds and central pressure was the 1999 Odisha cyclone , with 3-minute sustained winds of 260 km/h (160 mph) and a minimum pressure of 912 hPa (26.93 inHg) .
Storms with an intensity of 950 hPa (28.05 inHg) or less are listed.
Cyclone Season Peak classification Peak 3-min Pressure Refs Two 1963 Extremely severe cyclonic storm
195 km/h (120 mph) 947 hPa (27.96 inHg) Three 1963 Super cyclonic storm
240 km/h (150 mph) 920 hPa (27.17 inHg) 1977 Andhra Pradesh 1977 Super cyclonic storm
230 km/h (145 mph) 943 hPa (27.85 inHg) [ 10] Unnamed 1978 Extremely severe cyclonic storm
205 km/h (125 mph) 940 hPa (27.76 inHg) [ 11] 1978 Sri Lanka 1978 Super cyclonic storm
220 km/h (140 mph) 938 hPa (27.70 inHg) [ 11] Unnamed 1979 Extremely severe cyclonic storm
185 km/h (115 mph) 936 hPa (27.64 inHg) [ 12] BOB 01 1982 Extremely severe cyclonic storm
215 km/h (130 mph) 940 hPa (27.76 inHg) [ 13] Gay 1989 Super cyclonic storm
230 km/h (145 mph) 930 hPa (27.46 inHg) [ 13] 1990 Andhra Pradesh 1990 Super cyclonic storm
235 km/h (145 mph) 920 hPa (27.17 inHg) [ 13] 1991 Bangladesh 1991 Super cyclonic storm
235 km/h (145 mph) 918 hPa (27.11 inHg) [ 13] 1994 BOB 02 1994 Extremely severe cyclonic storm
215 km/h (130 mph) 940 hPa (27.76 inHg) [ 13] 1999 Pakistan 1999 Extremely severe cyclonic storm
195 km/h (120 mph) 946 hPa (27.94 inHg) [ 13] 1999 Odisha 1999 Super cyclonic storm
260 km/h (160 mph) 912 hPa (26.93 inHg) [ 13] 2001 Gujarat 2001 Extremely severe cyclonic storm
215 km/h (130 mph) 932 hPa (27.52 inHg) [ 13] Gonu 2007 Super cyclonic storm
240 km/h (150 mph) 920 hPa (27.17 inHg) [ 13] Sidr 2007 Extremely severe cyclonic storm
215 km/h (130 mph) 944 hPa (27.88 inHg) [ 13] Giri 2010 Extremely severe cyclonic storm
195 km/h (120 mph) 950 hPa (28.05 inHg) [ 13] Phailin 2013 Extremely severe cyclonic storm
215 km/h (130 mph) 940 hPa (27.76 inHg) [ 13] Hudhud 2014 Extremely severe cyclonic storm
185 km/h (115 mph) 950 hPa (28.05 inHg) [ 13] Nilofar 2014 Extremely severe cyclonic storm
205 km/h (125 mph) 950 hPa (28.05 inHg) [ 13] Chapala 2015 Extremely severe cyclonic storm
215 km/h (130 mph) 940 hPa (27.76 inHg) [ 13] Fani 2019 Extremely severe cyclonic storm
215 km/h (130 mph) 932 hPa (27.52 inHg) Kyarr 2019 Super cyclonic storm
240 km/h (150 mph) 922 hPa (27.23 inHg) Amphan 2020 Super cyclonic storm
240 km/h (150 mph) 920 hPa (27.17 inHg) Tauktae 2021 Extremely severe cyclonic storm
185 km/h (115 mph) 950 hPa (28.05 inHg) Mocha 2023 Extremely severe cyclonic storm
215 km/h (130 mph) 938 hPa (27.70 inHg)
South-West Indian Ocean The most intense tropical cyclone in the South-West Indian Ocean was Cyclone Gafilo . By 10-minute sustained wind speed, the strongest tropical cyclone in the South-West Indian Ocean was Cyclone Fantala .
Storms with an intensity of 920 hPa (27.17 inHg) or less are listed. Storm information was less reliably documented and recorded before 1985. [ 6]
Cyclone Season Peak classification Peak 10-min Pressure Chris–Damia 1981–82 Intense tropical cyclone
215 km/h (130 mph) 898 hPa (26.52 inHg) [ 14] Geralda 1993–94 Intense tropical cyclone
205 km/h (125 mph) 905 hPa (26.72 inHg) [ 15] Litanne 1993–94 Intense tropical cyclone
195 km/h (120 mph) 910 hPa (26.87 inHg) [ 15] Marlene 1994–95 Intense tropical cyclone
185 km/h (115 mph) 920 hPa (27.17 inHg) [ 16] Bonita 1995–96 Intense tropical cyclone
185 km/h (115 mph) 920 hPa (27.17 inHg) [ 17] Daniella 1996–97 Intense tropical cyclone
195 km/h (120 mph) 915 hPa (27.02 inHg) [ 18] Hudah 1999–2000 Very Intense tropical cyclone
220 km/h (140 mph) 905 hPa (26.72 inHg) [ 19] Dina 2001–02 Intense tropical cyclone
215 km/h (130 mph) 910 hPa (26.87 inHg) [ 20] Guillaume 2001–02 Intense tropical cyclone
205 km/h (125 mph) 920 hPa (27.17 inHg) [ 20] Hary 2001–02 Very Intense tropical cyclone
220 km/h (140 mph) 905 hPa (26.72 inHg) [ 20] Kalunde 2002–03 Intense tropical cyclone
215 km/h (130 mph) 905 hPa (26.72 inHg) Gafilo 2003–04 Very Intense tropical cyclone
230 km/h (145 mph) 895 hPa (26.43 inHg) [ 21] Adeline–Juliet 2004–05 Very Intense tropical cyclone
220 km/h (140 mph) 905 hPa (26.72 inHg) [ 22] Bento 2004–05 Intense tropical cyclone
215 km/h (130 mph) 915 hPa (27.02 inHg) [ 23] Carina 2005–06 Intense tropical cyclone
205 km/h (125 mph) 915 hPa (27.02 inHg) [ 24] Hondo 2007–08 Intense tropical cyclone
215 km/h (130 mph) 915 hPa (27.02 inHg) [ 25] Edzani 2009–10 Very Intense tropical cyclone
220 km/h (140 mph) 910 hPa (26.87 inHg) [ 26] Bruce 2013–14 Very Intense tropical cyclone
220 km/h (140 mph) 920 hPa (27.17 inHg) Colin 2013–14 Intense tropical cyclone
205 km/h (125 mph) 915 hPa (27.02 inHg) Hellen 2013–14 Very Intense tropical cyclone
230 km/h (145 mph) 915 hPa (27.02 inHg) Bansi 2014–15 Very Intense tropical cyclone
220 km/h (140 mph) 910 hPa (26.87 inHg) Eunice 2014–15 Very Intense tropical cyclone
230 km/h (145 mph) 915 hPa (27.02 inHg) Fantala 2015–16 Very Intense tropical cyclone
250 km/h (155 mph) 910 hPa (26.87 inHg) Darian 2022–23 Very Intense tropical cyclone
220 km/h (140 mph) 920 hPa (27.17 inHg)
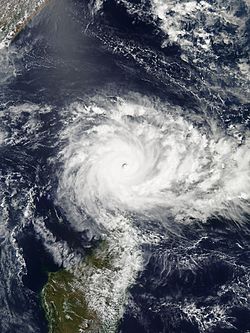
Australian region The most intense tropical cyclone(s) in the Australian Region were cyclones Gwenda and Inigo . By 10-minute sustained wind speed, the strongest were Cyclone Orson , Cyclone Monica and Cyclone Marcus .
Storms with an intensity of 920 hPa (27.17 inHg) or less are listed. Storm information was less reliably documented and recorded before 1985. [ 6]
Cyclone Season Peak classification Peak 10-min Pressure Mahina 1898–99 Unknown
Not specified 914 hPa (26.99 inHg) [ nb 1] Joan 1975–76 Category 5 severe tropical cyclone
215 km/h (130 mph) 915 hPa (27.02 inHg) Amy 1979–80 Category 5 severe tropical cyclone
215 km/h (130 mph) 915 hPa (27.02 inHg) Kathy 1983–84 Category 5 severe tropical cyclone
205 km/h (125 mph) 916 hPa (27.05 inHg) Orson 1988–89 Category 5 severe tropical cyclone
250 km/h (155 mph) 904 hPa (26.70 inHg) Graham 1991–92 Category 5 severe tropical cyclone
205 km/h (125 mph) 915 hPa (27.02 inHg) Rewa 1993–94 Category 5 severe tropical cyclone
205 km/h (125 mph) 920 hPa (27.17 inHg) Theodore 1993–94 Category 5 severe tropical cyclone
205 km/h (125 mph) 910 hPa (26.87 inHg) Chloe 1994–95 Category 5 severe tropical cyclone
220 km/h (140 mph) 920 hPa (27.17 inHg) Pancho-Helinda 1996–97 Category 5 severe tropical cyclone
215 km/h (130 mph) 915 hPa (27.02 inHg) Thelma 1998–99 Category 5 severe tropical cyclone
220 km/h (140 mph) 920 hPa (27.17 inHg) Vance 1998–99 Category 5 severe tropical cyclone
215 km/h (130 mph) 910 hPa (26.87 inHg) Frederic-Evrina 1998–99 Category 5 severe tropical cyclone
205 km/h (125 mph) 920 hPa (27.17 inHg) Gwenda 1998–99 Category 5 severe tropical cyclone
220 km/h (140 mph) 900 hPa (26.58 inHg) John 1999–2000 Category 5 severe tropical cyclone
205 km/h (125 mph) 915 hPa (27.02 inHg) Paul 1999–2000 Category 5 severe tropical cyclone
220 km/h (140 mph) 915 hPa (27.02 inHg) Chris 2001–02 Category 5 severe tropical cyclone
205 km/h (125 mph) 915 hPa (27.02 inHg) Inigo 2002–03 Category 5 severe tropical cyclone
230 km/h (145 mph) 900 hPa (26.58 inHg) Fay 2003–04 Category 5 severe tropical cyclone
215 km/h (130 mph) 910 hPa (26.87 inHg) Floyd 2005–06 Category 4 severe tropical cyclone
195 km/h (120 mph) 916 hPa (27.05 inHg) Glenda 2005–06 Category 5 severe tropical cyclone
205 km/h (125 mph) 910 hPa (26.87 inHg) Monica 2005–06 Category 5 severe tropical cyclone
250 km/h (155 mph) 916 hPa (27.05 inHg) George 2006–07 Category 5 severe tropical cyclone
205 km/h (125 mph) 902 hPa (26.64 inHg) Marcus 2017–18 Category 5 severe tropical cyclone
250 km/h (155 mph) 905 hPa (26.72 inHg) Darian 2022–23 Category 5 severe tropical cyclone
230 km/h (145 mph) 915 hPa (27.02 inHg) Ilsa 2022–23 Category 5 severe tropical cyclone
230 km/h (145 mph) 915 hPa (27.02 inHg) Source: Database of past tropical cyclone tracks (BOM ) [ 29]
South Pacific Ocean Cyclone Zoe at peak intensity and also the second most intense tropical cyclone in the Southern Hemisphere.
A total of 16 cyclones are listed down below reaching/surpassing an intensity of 920 hPa (27.17 inHg), with most of them occurring during El Niño seasons. Tropical cyclones that have been recorded since the start of the 1969–70 Tropical Cyclone year and have reached their peak intensity to the west of 160E are included in the list. The most intense tropical cyclone in the south Pacific, Cyclone Winston of 2016, is also the most intense storm in the Southern Hemisphere.
Storms with an intensity of 920 hPa (27.17 inHg) or less are listed.
Cyclone Season Peak classification Peak 10-min Pressure Oscar 1982–83 Category 4 severe tropical cyclone
185 km/h (115 mph) 920 hPa (27.17 inHg) Hina 1984–85 Category 5 severe tropical cyclone
220 km/h (140 mph) 910 hPa (26.87 inHg) Fran 1991–92 Category 5 severe tropical cyclone
205 km/h (125 mph) 920 hPa (27.17 inHg) Ron 1997–98 Category 5 severe tropical cyclone
230 km/h (145 mph) 900 hPa (26.58 inHg) Susan 1997–98 Category 5 severe tropical cyclone
230 km/h (145 mph) 900 hPa (26.58 inHg) Beni 2002–03 Category 5 severe tropical cyclone
205 km/h (125 mph) 920 hPa (27.17 inHg) Dovi 2002–03 Category 5 severe tropical cyclone
205 km/h (125 mph) 920 hPa (27.17 inHg) Erica 2002–03 Category 5 severe tropical cyclone
215 km/h (130 mph) 915 hPa (27.02 inHg) Zoe 2002–03 Category 5 severe tropical cyclone
240 km/h (150 mph) 890 hPa (26.28 inHg) Heta 2003–04 Category 5 severe tropical cyclone
215 km/h (130 mph) 915 hPa (27.02 inHg) Meena 2004–05 Category 5 severe tropical cyclone
215 km/h (130 mph) 915 hPa (27.02 inHg) Olaf 2004–05 Category 5 severe tropical cyclone
215 km/h (130 mph) 915 hPa (27.02 inHg) Percy 2004–05 Category 5 severe tropical cyclone
230 km/h (145 mph) 900 hPa (26.58 inHg) Ului 2009–10 Category 5 severe tropical cyclone
215 km/h (130 mph) 915 hPa (27.02 inHg) Pam 2014–15 Category 5 severe tropical cyclone
250 km/h (155 mph) 896 hPa (26.46 inHg) Winston 2015–16 Category 5 severe tropical cyclone
280 km/h (175 mph) 884 hPa (26.10 inHg) Harold 2019–20 Category 5 severe tropical cyclone
230 km/h (145 mph) 920 hPa (27.17 inHg) Yasa 2020–21 Category 5 severe tropical cyclone
230 km/h (145 mph) 917 hPa (27.08 inHg) Kevin 2022–23 Category 5 severe tropical cyclone
230 km/h (145 mph) 913 hPa (26.96 inHg)
South Atlantic Ocean Hurricane Catarina near peak intensity Until recently, it was not known that tropical cyclones could exist in the southern Atlantic. However, Hurricane Catarina in 2004, to date the only hurricane in the south Atlantic, brought additional review. A subsequent study found that there was an average of 1–2 subtropical or tropical cyclones per year in the Southern Atlantic in recent decades. [ 30] No official database of South Atlantic cyclones exists, but a partial list of notable tropical and subtropical systems is listed.
Cyclone Season Peak classification Peak 1-min Pressure Unnamed 1991 Tropical storm
65 km/h (40 mph) Unknown (Unknown) Catarina 2004 Category 2 hurricane
155 km/h (100 mph) 972 hPa (28.70 inHg) Anita 2010 Tropical storm
85 km/h (50 mph) 995 hPa (29.38 inHg) Arani 2011 Subtropical storm
85 km/h (50 mph) 989 hPa (29.21 inHg) Bapo 2015 Subtropical storm
65 km/h (40 mph) 992 hPa (29.29 inHg) Cari 2015 Subtropical storm
65 km/h (40 mph) 998 hPa (29.47 inHg) Deni 2016 Subtropical storm
75 km/h (45 mph) 998 hPa (29.47 inHg) Eçaí 2016 Subtropical storm
100 km/h (65 mph) 992 hPa (29.29 inHg) Guará 2017 Subtropical storm
75 km/h (45 mph) 996 hPa (29.41 inHg) Iba 2019 Tropical storm
85 km/h (50 mph) 1,006 hPa (29.71 inHg) Jaguar 2019 Subtropical storm
65 km/h (40 mph) 1,010 hPa (29.83 inHg) Kurumí 2020 Subtropical storm
65 km/h (40 mph) 998 hPa (29.47 inHg) Mani 2020 Subtropical storm
65 km/h (40 mph) 1,004 hPa (29.65 inHg) Oquira 2020 Subtropical storm
65 km/h (40 mph) 998 hPa (29.47 inHg) 01Q 2021 Tropical storm
65 km/h (40 mph) 990 hPa (29.23 inHg) Potira 2021 Subtropical storm
75 km/h (45 mph) 1,006 hPa (29.71 inHg) Raoni 2021 Subtropical storm
95 km/h (60 mph) 986 hPa (29.12 inHg) Ubá 2021 Subtropical storm
65 km/h (40 mph) 995 hPa (29.38 inHg) Yakecan 2022 Subtropical storm
95 km/h (60 mph) 990 hPa (29.23 inHg) Akará 2024 Tropical storm
85 km/h (50 mph) 994 hPa (29.35 inHg) Biguá 2024 Subtropical storm
95 km/h (60 mph) 998 hPa (29.47 inHg)
Notes ↑ Unofficially estimated as 880 mbar, pending review. [ 27] [ 28] References ↑ Kossin, James (February 2015). "Hurricane Wind–Pressure Relationship and Eyewall Replacement Cycles" . Weather and Forecasting . 30 (1): 177– 181. Bibcode :2015WtFor..30..177K . doi : 10.1175/WAF-D-14-00121.1 . S2CID 123146418 . ↑ Dunnavan, George M; Diercks, John W (November 1, 1980). "An Analysis of Super Typhoon Tip (October 1979)" . Monthly Weather Review . 108 (11): 1915– 1923. Bibcode :1980MWRv..108.1915D . doi : 10.1175/1520-0493(1980)108< 1915:AAOSTT> 2.0.CO; 2 . ↑ Sanchez, Ray (October 23, 2015). "Hurricane Patricia weakens, but still 'extremely dangerous' . CNN . Retrieved October 10, 2018 . ↑ Mirnane, Richard; Liu, Kam-Biu (2004). Hurricanes and Typhoons: Past, Present, and Future (PDF) . Columbia University Press. ↑ "Atlantic hurricane best track (HURDAT version 2)" (Database). United States National Hurricane Center . April 4, 2025. public domain . 1 2 3 4 "ATCR report plan" . www.usno.navy.mil . Archived from the original on December 24, 2009. Retrieved 2017-10-21 . ↑ National Hurricane Center ; Hurricane Research Division ; Central Pacific Hurricane Center (April 26, 2024). "The Northeast and North Central Pacific hurricane database 1949–2023" . United States National Oceanic and Atmospheric Administration's National Weather Service. Archived from the original on May 29, 2024. here . public domain . ↑ C. L. Jordan (September 1959). "A Reported Sea Level Pressure of 877 MB" (PDF) . Monthly Weather Review . 87 (9): 365– 366. Bibcode :1959MWRv...87..365J . doi :10.1175/1520-0493(1959)087< 0365:wnarsl> 2.0.co; 2 . Retrieved May 9, 2017 . ↑ "Western North Pacific Typhoon best track file 1951–2025" . Japan Meteorological Agency . 2010-01-13. Retrieved 2010-01-13 . ↑ Pant, P S; Ramakrishnan, A R; Jamdunathan, R (1980). "Cyclones and Depressions over the Indian Seas in 1977" (PDF) . Mausam . 31 (3): 337– 356. doi :10.54302/mausam.v31i3.3533 . S2CID 246784388 . 1 2 Srinivasan, V; Ramakrishnan, A R; Jamdunathan, R. "Cyclones and Depressions over the Indian Seas in 1978" (PDF) . Mausam . 31 (4): 495– 506. doi :10.54302/mausam.v31i4.3444 . S2CID 246781079 . ↑ Mukherjee, A K; Ramakrishnan, A R; Jamdunathan, R (1981). "Cyclones and Depressions over the Indian Seas in 1979" (PDF) . Mausam . 32 (2): 115– 126. doi :10.54302/mausam.v32i2.3398 . S2CID 246848511 . 1 2 3 4 5 6 7 8 9 10 11 12 13 14 15 "IMD Best track data 1982-2022" (xls) . India Meteorological Department. here . ↑ "Cyclone Damia Best track" . Météo-France. 2001-05-16. Retrieved 2010-01-08 . 1 2 La Réunion Tropical Cyclone Centre. Cyclone Season 1993–1994 in the South-West Indian Ocean 42, 65. Retrieved December 22, 2013 . ↑ La Réunion Tropical Cyclone Centre. Cyclone Season 1994–1995 in the South-West Indian Ocean 67. Retrieved December 22, 2013 . ↑ La Réunion Tropical Cyclone Centre. Cyclone Season 1995–1996 in the South-West Indian Ocean 25. Retrieved December 22, 2013 . ↑ La Réunion Tropical Cyclone Centre. Cyclone Season 1996–1997 in the South-West Indian Ocean 33. Retrieved December 22, 2013 . ↑ La Réunion Tropical Cyclone Centre (2001). Cyclone Season 1999–2000 in the South-West Indian Ocean 72. ISBN 2-9511665-3-2 . Retrieved December 22, 2013 . 1 2 3 La Réunion Tropical Cyclone Centre (2004). Cyclone Season 2001–2002 in the South-West Indian Ocean 4. ISBN 2-9511665-6-7 . Retrieved December 22, 2013 . ↑ La Réunion Tropical Cyclone Centre (2006). Cyclone Season 2003–2004 in the South-West Indian Ocean 67. ISBN 2-9511665-8-3 . Retrieved December 22, 2013 . ↑ La Réunion Tropical Cyclone Centre (November 27, 2009). "Very Intense Tropical Cyclone Adeline-Juliet" . Météo France. Archived from the original on December 24, 2013. Retrieved December 22, 2013 . ↑ La Réunion Tropical Cyclone Centre (November 27, 2009). "Intense Tropical Cyclone Bento" . Météo France. Archived from the original on December 24, 2013. Retrieved December 22, 2013 . ↑ La Réunion Tropical Cyclone Centre (2006). South-West Indian Ocean Cyclone Season 2005–2006 6. ISBN 2-9511665-9-1 . Retrieved December 22, 2013 . ↑ La Réunion Tropical Cyclone Centre (November 27, 2009). "Very Intense Tropical Cyclone Hondo" . Météo France. Archived from the original on December 24, 2013. Retrieved December 22, 2013 . ↑ La Réunion Tropical Cyclone Centre (August 31, 2010). "Very Intense Tropical Cyclone Edzani" . Météo France. Archived from the original on December 24, 2013. Retrieved December 22, 2013 . ↑ Kerr, Jack (26 December 2014). "Tropical Cyclone Mahina: Bid to have deadly March 1899 weather event upgraded in record books" . Australian Broadcasting Corporation . Archived from the original on 2 April 2015. Retrieved 6 March 2015 . ↑ Masters, Jeffrey. "World Storm Surge Records" . Weather Underground . Retrieved 6 December 2017 . ↑ "Australian Tropical Cyclone Database" (CSV) . Australian Bureau of Meteorology. 2025-04-23. Retrieved 2025-04-23 . here . ↑ Evans, Jenny L; Braun, Aviva J (2012). "A Climatology of Subtropical Cyclones in the South Atlantic" . Journal of Climate . 25 (21). American Meteorological Society: 7328– 7340. Bibcode :2012JCli...25.7328E . doi : 10.1175/JCLI-D-11-00212.1 . This page is based on this
Wikipedia article Text is available under the
CC BY-SA 4.0 license; additional terms may apply.
Images, videos and audio are available under their respective licenses.