
Typhoon Tip, known in the Philippines as Super Typhoon Warling, was an exceptionally large, extremely powerful, and long-lived tropical cyclone that traversed the Western Pacific for 20 days, shattering multiple records worldwide. The forty-third tropical depression, nineteenth tropical storm, twelfth typhoon, and third super typhoon of the 1979 Pacific typhoon season, Tip developed out of a disturbance within the monsoon trough on October 4 near Pohnpei in Micronesia. Initially, Tropical Storm Roger to the northwest hindered the development and motion of Tip, though after the storm tracked farther north, Tip was able to intensify. After passing Guam, Tip rapidly intensified and reached peak sustained winds of 305 km/h (190 mph) and a worldwide record-low sea-level pressure of 870 hPa (25.69 inHg) on October 12. At its peak intensity, Tip was the largest tropical cyclone on record, with a wind diameter of 2,220 km (1,380 mi). Tip slowly weakened as it continued west-northwestward and later turned to the northeast, in response to an approaching trough. The typhoon made landfall in southern Japan on October 19, and became an extratropical cyclone shortly thereafter. Tip's extratropical remnants continued moving east-northeastward, until they dissipated near the Aleutian Islands on October 24.

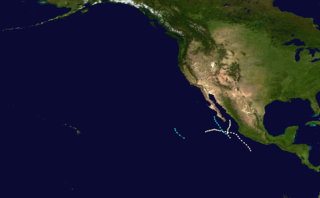
Hurricane John, also known as Typhoon John, was the farthest-traveling tropical cyclone ever observed worldwide. It was also the longest-lasting tropical cyclone on record globally at the time, until it was surpassed by Cyclone Freddy in 2023. John formed during the 1994 Pacific hurricane season, which had above-average activity due to the El Niño of 1994–1995, and peaked as a Category 5 hurricane on the Saffir–Simpson scale, the highest categorization for hurricanes.

The 1940 Atlantic hurricane season was a generally average period of tropical cyclogenesis in 1940. Though the season had no official bounds, most tropical cyclone activity occurred during August and September. Throughout the year, fourteen tropical cyclones formed, of which nine reached tropical storm intensity; six were hurricanes. None of the hurricanes reached major hurricane intensity. Tropical cyclones that did not approach populated areas or shipping lanes, especially if they were relatively weak and of short duration, may have remained undetected. Because technologies such as satellite monitoring were not available until the 1960s, historical data on tropical cyclones from this period are often not reliable. As a result of a reanalysis project which analyzed the season in 2012, an additional hurricane was added to HURDAT. The year's first tropical storm formed on May 19 off the northern coast of Hispaniola. At the time, this was a rare occurrence, as only four other tropical disturbances were known to have formed prior during this period; since then, reanalysis of previous seasons has concluded that there were more than four tropical cyclones in May before 1940. The season's final system was a tropical disturbance situated in the Greater Antilles, which dissipated on November 8.
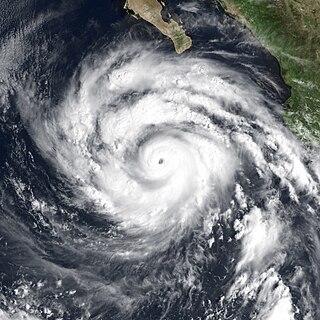
Hurricane Linda was an extremely powerful tropical cyclone that was, at the time, the most intense eastern Pacific hurricane on record, until it was surpassed 18 years later by Patricia. Forming from a tropical wave on September 9, 1997, Linda steadily intensified and reached hurricane status within 36 hours of developing. The storm rapidly intensified, reaching sustained winds of 185 mph (295 km/h) and an estimated central pressure of 902 millibars (26.6 inHg); both were records for the eastern Pacific until Hurricane Patricia surpassed them in 2015. The hurricane was briefly forecast to move toward southern California, but instead, it turned out to sea and lost its status as a tropical cyclone on September 17, before dissipating on September 21. Linda was the fifteenth tropical cyclone, thirteenth named storm, seventh hurricane, and fifth major hurricane of the 1997 Pacific hurricane season. Linda was also the most intense tropical cyclone worldwide in 1997.

The 1929 Atlantic hurricane season was a near average season in terms of accumulated cyclone energy, but is among the least active Atlantic hurricane seasons on record in terms of storms forming, with only five tropical cyclones forming. Three of them intensified into a hurricane, with one strengthening further into a major hurricane. The first tropical cyclone of the season developed in the Gulf of Mexico on June 27. Becoming a hurricane on June 28, the storm struck Texas, bringing strong winds to a large area. Three fatalities were reported, while damage was conservatively estimated at $675,000 (1929 USD).

The 1973 Pacific hurricane season was an above average season, with twelve named tropical cyclones in total. Seven storms became hurricanes, of which three were major. The season officially started May 15, 1973, in the eastern Pacific, and June 1, 1973, in the central Pacific, and lasted until November 30, 1973. These dates conventionally delimit the period of each year when most tropical cyclones form in the northeastern Pacific Ocean.

An Atlantic hurricane is a type of tropical cyclone that forms in the Atlantic Ocean primarily between June and November. The terms "hurricane", "typhoon", and "tropical cyclone" can be used interchangeably to describe this weather phenomenon. These storms are continuously rotating around a low pressure center, which causes stormy weather across a large area, which is not limited to just the eye of the storm. They are organized systems of clouds and thunderstorms that originate over tropical or subtropical waters and have closed low-level circulation, and should not be confused with tornadoes, which are just another type of cyclone. They form over low pressure systems. In the North Atlantic and the Eastern Pacific, the term "hurricane" is used, whereas "typhoon" is used in the Western Pacific near Asia. The more general term "cyclone" is used in the rest of the ocean basins, namely the South Pacific and Indian Ocean.

Hurricane Ioke, also referred to as Typhoon Ioke, was a record-breaking, long-lived and extremely powerful tropical cyclone that traversed the Pacific for 17 days, becoming a Category 5 hurricane on the Saffir–Simpson scale on three different occasions. It was the most intense hurricane ever recorded in the Central Pacific, as well as the fifth-most intense Pacific hurricane on record, tied with 1973's Hurricane Ava. It also generated the most accumulated cyclone energy for a single storm, until Cyclone Freddy surpassed its record in 2023. Ioke was the ninth named storm, fifth hurricane, and third major hurricane of the active 2006 Pacific hurricane season.
Extratropical cyclones, sometimes called mid-latitude cyclones or wave cyclones, are low-pressure areas which, along with the anticyclones of high-pressure areas, drive the weather over much of the Earth. Extratropical cyclones are capable of producing anything from cloudiness and mild showers to severe hail, thunderstorms, blizzards, and tornadoes. These types of cyclones are defined as large scale (synoptic) low pressure weather systems that occur in the middle latitudes of the Earth. In contrast with tropical cyclones, extratropical cyclones produce rapid changes in temperature and dew point along broad lines, called weather fronts, about the center of the cyclone.

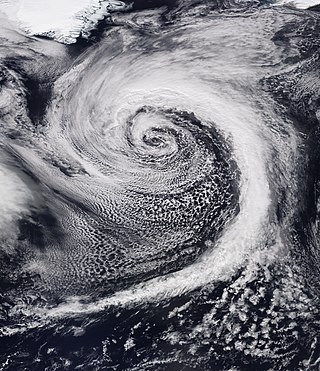
Hurricane Guillermo was the ninth-most intense Pacific hurricane on record, attaining peak winds of 160 mph (260 km/h) and a barometric pressure of 919 hPa (27.14 inHg). Forming out of a tropical wave on July 30, 1997, roughly 345 mi (555 km) south of Salina Cruz, Mexico, Guillermo tracked in a steady west-northwestward direction while intensifying. The system reached hurricane status by August 1 before undergoing rapid intensification the following day. At the end of this phase, the storm attained its peak intensity as a powerful Category 5 hurricane. The storm began to weaken during the afternoon of August 5 and was downgraded to a tropical storm on August 8. Once entering the Central Pacific Hurricane Center's area of responsibility, Guillermo briefly weakened to a tropical depression before re-attaining tropical storm status. On August 15, the storm reached an unusually high latitude of 41.8°N before transitioning into an extratropical cyclone. The remnants persisted for more than a week as they tracked towards the northeast and later south and east before being absorbed by a larger extratropical system off the coast of California on August 24.

The 1917 Nueva Gerona hurricane was the most intense tropical cyclone to strike the Florida Panhandle until Hurricane Opal in 1995. The eighth tropical cyclone and fourth tropical storm of the season, this system was identified as a tropical storm east of the Lesser Antilles on September 20. After crossing the Lesser Antilles, the system entered the Caribbean Sea and achieved hurricane intensity on September 21. After becoming a Category 2 hurricane, the storm struck the northern coast of Jamaica on September 23. Early on September 25, the cyclone reached Category 4 status and attained maximum sustained winds of 150 mph (240 km/h) soon thereafter. Later that day, the hurricane made landfall in eastern Pinar del Río Province, Cuba. The system entered the Gulf of Mexico shortly thereafter and weakened slightly. Recurving to the northeast, the hurricane briefly threatened Louisiana before turning toward Florida. Early on September 29, the hurricane made landfall near Fort Walton Beach, Florida, with winds of 115 mph (185 km/h). Once over land, the cyclone rapidly weakened and transitioned into an extratropical cyclone before dissipating on September 30.

During 2010, with only 64 named systems, was considered as one of the least active years for tropical cyclones on record. During the year, tropical cyclones formed within seven different tropical cyclone basins, located within various parts of the Atlantic, Pacific and Indian Oceans. During the year, a total of 111 tropical cyclones developed, with 64 of them being named by either a Regional Specialized Meteorological Center (RSMC) or a Tropical Cyclone Warning Center (TCWC). The most active basin was the North Atlantic, which documented 19 named systems, while the North Indian Ocean, despite only amounting to five named systems, was its basin's most active since 1998. Conversely, both the West Pacific typhoon and East Pacific hurricane seasons experienced the fewest cyclones reaching tropical storm intensity in recorded history, numbering 14 and 8, respectively. Activity across the southern hemisphere's three basins—South-West Indian, Australian, and South Pacific—was spread evenly, with each region recording 7 named storms apiece. The southern hemisphere's strongest tropical cyclone was Cyclone Edzani, which bottomed out with a barometric pressure of 910 mbar in the South-West Indian Ocean. Nineteen Category 3 tropical cyclones formed, including four Category 5 tropical cyclones in the year. The accumulated cyclone energy (ACE) index for the 2010, as calculated by Colorado State University was 573.8 units.

Severe Tropical Cyclone Joan was an intense tropical cyclone that ravaged areas of Western Australia. Forming out of a tropical low on 30 November 1975, Joan gradually intensified as it tracked towards the west. After attaining Category 5 intensity on 5 December, the storm abruptly began to track southward and accelerated. The following day, the cyclone reached its peak intensity with winds of 215 km/h (130 mph) and a barometric pressure of 915 hPa (27.02 inHg). Joan only weakened slightly before making landfall in the vicinity of Mundabullagana. The cyclone rapidly weakened after landfall before dissipating over Western Australia on 12 December.
The 1953 Pacific hurricane season was the least active season on record. The season officially began on May 15 in the northeast Pacific Ocean and on June 1 in the central northern Pacific. They ended on November 30. These dates conventionally delimit the time of year when most tropical cyclones form in northeast Pacific Ocean. Before the satellite age started in the 1960s, data prior to that time on Pacific hurricanes is extremely unreliable as most east Pacific storms are of no threat to land.

Hurricane Patricia was the most intense tropical cyclone ever recorded in the Western Hemisphere and the second-most intense worldwide in terms of barometric pressure. It also featured the highest one-minute maximum sustained winds ever recorded in a tropical cyclone. Originating from a sprawling disturbance near the Gulf of Tehuantepec in mid-October 2015, Patricia was first classified a tropical depression on October 20. Initial development was slow, with only modest strengthening within the first day of its classification. The system later became a tropical storm and was named Patricia, the twenty-fourth named storm of the annual hurricane season. Exceptionally favorable environmental conditions fueled explosive intensification on October 22. A well-defined eye developed within an intense central dense overcast and Patricia grew from a tropical storm to a Category 5 hurricane in just 24 hours—a near-record pace. The magnitude of intensification was poorly forecast and both forecast models and meteorologists suffered from record-high prediction errors.
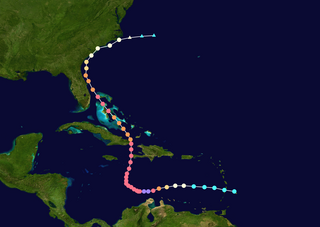
Hurricane Matthew was the first Category 5 Atlantic hurricane since Felix in 2007 and the southernmost Category 5 Atlantic hurricane on record. The system originated from a tropical wave that emerged off the west coast of Africa on September 22, and ultimately dissipated as an extratropical cyclone near Atlantic Canada on October 10. Late on September 29, it began a period of explosive intensification that brought it to Category 5 strength early on October 1. It weakened slightly and remained a Category 4 until its landfalls in Haiti and Cuba, afterwards it traversed through the Bahamas and paralleled the coast of Florida until making landfall in South Carolina as a Category 1 hurricane. Matthew later transitioned into a post-tropical cyclone on October 10.

During 1996, tropical cyclones formed within seven different tropical cyclone basins, located within various parts of the Atlantic, Pacific, and Indian Oceans. During the year, a total of 139 tropical cyclones formed in bodies of water known as tropical cyclone basins. 90 of them were named by various weather agencies when they attained maximum sustained winds of 35 knots. The strongest tropical cyclone of the year was Cyclone Daniella, peaking with a pressure of 915 hPa (27.02 inHg) in the open waters of the Indian Ocean. Hurricane Fran and Typhoon Herb tie for the costliest storm of the year, both with a damage cost of $5 billion. The deadliest tropical cyclone of the year was the 1996 Andhra Pradesh cyclone, which was blamed for over 1,000 fatalities as it directly affected the state of Andhra Pradesh in India. Five Category 5 tropical cyclones were formed in 1996. The accumulated cyclone energy (ACE) index for the 1996, as calculated by Colorado State University was 960 units.


