It has been suggested that Tropical Storm Lester (2004) be merged into this article. (Discuss) Proposed since February 2024. |
2004 Pacific hurricane season | |
---|---|
Seasonal boundaries | |
First system formed | May 22, 2004 |
Last system dissipated | October 26, 2004 |
Strongest storm | |
Name | Javier |
• Maximum winds | 150 mph (240 km/h) (1-minute sustained) |
• Lowest pressure | 930 mbar (hPa; 27.46 inHg) |
Seasonal statistics | |
Total depressions | 17, 1 unofficial |
Total storms | 12 |
Hurricanes | 6 |
Major hurricanes (Cat. 3+) | 3 |
Total fatalities | None, 3 missing |
Total damage | None |
Related articles | |
The 2004 Pacific hurricane season was unusual in that no tropical cyclones of at least tropical storm intensity made landfall, the first such occurrence since 1991. The season was also below-average in terms of named storms and hurricanes, near-average in terms of major hurricanes. The season officially began on May 15 in the eastern Pacific, and on June 1 in the central Pacific; it officially ended in both basins on November 30. [1] These dates conventionally delimit the period during each year when a majority of tropical cyclones form. The season was reflected by an accumulated cyclone energy (ACE) index of 71 units.
Impact throughout the season was minimal and no deaths were recorded. In early August, the remnants of Hurricane Darby aided in localized heavy rainfall in Hawaii, causing minor street and stream flooding; coffee and macadamia trees were damaged as well. In early September, Hurricane Howard resulted in significant flooding across Baja California Peninsula that damaged agricultural land and 393 homes. Large swells also resulted in about 1,000 lifeguard rescues in California. In mid-September, Javier caused three fishermen to go missing and helped alleviate a multi-year drought across the Southwest United States. It produced record rainfall in the state of Wyoming. In mid- to late October, Tropical Storm Lester and Tropical Depression Sixteen-E caused localized flooding; the latter may have produced a tornado near Culiacán, Mexico.
Source | Date | Named storms | Hurricanes | Major hurricanes | Ref |
Average (1966–2003) | 16 | 9 | 3 | ||
Record high activity | 27 | 16 (tie) | 11 | ||
Record low activity | 8 (tie) | 3 | 0† (tie) | ||
SMN | January 2004 | 15 | 6 | 3 | [2] |
SMN | May 17, 2004 | 14 | 7 | 2 | [3] |
NOAA | May 21, 2004 | 13–15 | 6-8 | 2-4 | [4] |
SMN | August 2004 | 13 | 6 | 3 | [5] |
Actual activity | 12 | 6 | 3 | ||
In January 2004, the Servicio Meteorológico Nacional (SMN) released their first prediction for tropical cyclone activity throughout the Northeast Pacific. Based on a Neutral El Niño Southern Oscillation (ENSO), a total of 15 named storms, 6 hurricanes, and 3 major hurricanes was forecast. [2] These values were slightly altered in May to 14 named storms, 7 hurricanes, and 2 major hurricanes, [3] and again in August to 13 named storms, 6 hurricanes, and 3 major hurricanes. [5]
On May 17, the National Oceanic and Atmospheric Administration issued its seasonal forecast for the 2004 central Pacific season, predicting four or five tropical cyclones to form or cross into the basin. Likewise to the SMN, near average activity was expected largely as a result of a Neutral ENSO. [6] The organization issued its experimental eastern Pacific outlook on May 21, highlighting a 45 percent change of below-average activity, 45 percent chance of near-average activity, and only a 10 percent chance of above-average activity in the basin. A total of 13 to 15 named storms, 6 to 8 hurricanes, and 2 to 4 major hurricanes was forecast. [4]
Rank | Season | ACE value |
---|---|---|
1 | 1977 | 22.3 |
2 | 2010 | 51.2 |
3 | 2007 | 51.6 |
4 | 1996 | 53.9 |
5 | 2003 | 56.6 |
6 | 1979 | 57.4 |
7 | 2004 | 71.1 |
8 | 1981 | 72.8 |
9 | 2013 | 74.8 |
10 | 2020 | 77.3 |
Activity was below average throughout the season. Altogether there were 12 named storms, 6 of which became hurricanes, and 3 of those intensified into major hurricanes, compared to the long-term average of 16 named storms, 9 hurricanes, and 3 major hurricanes. [8]
The season's first storm, Agatha, developed on May 22. [9] No tropical cyclones developed during June, below the average of 2 named storms and 1 hurricane, and also the first time since 1969 that the month was cyclone-free. [10] The first hurricane of the season was Celia, which briefly reached Category 1 strength on July 22. [11] It was soon followed by Darby, the first major Hurricane of the season and the first in the Eastern Pacific since Kenna in 2002. [12] Later, on September 14, Javier attained sustained winds of 150 mph (240 km/h), making it the strongest hurricane of the season. [13]
Overall wind energy output was reflected with an ACE index value of 71 units for the season. [14] Although vertical wind shear was near average and ocean temperatures were slightly warmer than average south of Mexico, anomalously cool waters and drier than average air mass existed in the central portions of the eastern Pacific. Anomalously strong mid-level ridging extending from the Atlantic to northern Mexico steered a majority of the season's cyclones toward this inhospitable region and also acted to steer all the system of tropical storm intensity or stronger away from land. [15]
Tropical storm (SSHWS) | |
Duration | May 22 – May 24 |
---|---|
Peak intensity | 60 mph (95 km/h) (1-min); 997 mbar (hPa) |
A nearly stationary trough stretched from the eastern Pacific into the eastern Caribbean Sea during mid-May. An ill-defined tropical wave crossed Central America on May 17 and interacted with the trough, eventually leading to the formation of a tropical depression at 00:00 UTC on May 22. The newly formed cyclone moved northwest parallel to the coastline of Mexico while steadily organizing in a low wind shear regime, intensifying into Tropical Storm Agatha by 12:00 UTC that day and attaining peak winds of 60 mph (97 km/h) twelve hours later. Increasingly cool ocean temperatures and a drier air mass caused Agatha to weaken quickly thereafter, and it degenerated into a remnant low by 12:00 UTC on May 24. The post-tropical cyclone drifted aimlessly before dissipating well south of the Baja California Peninsula on May 26. [9]
Tropical depression (SSHWS) | |
Duration | July 2 – July 3 |
---|---|
Peak intensity | 35 mph (55 km/h) (1-min); 1007 mbar (hPa) |
A westward-moving tropical wave from Africa crossed Central America into the eastern Pacific in late June, coalescing into a tropical depression at 12:00 UTC on July 2 well southwest of the southern tip of the Baja California Peninsula. [16] Steered westward by low-level flow, the depression failed to organize amid wind shear and cooler sea surface temperatures, [17] instead degenerating into a remnant low at 00:00 UTC on July 4. The post-tropical cyclone dissipated a day later. [16]
Tropical depression (SSHWS) | |
Duration | July 5 – July 5 |
---|---|
Peak intensity | 30 mph (45 km/h) (1-min); 1007 mbar (hPa) |
An organized region of convection within the Intertropical Convergence Zone developed into a tropical depression at 03:00 UTC on July 5 while located roughly 700 mi (1,100 km) south-southeast of Johnston Atoll, becoming the farthest-south-forming central Pacific tropical cyclone since Tropical Storm Hali (1992). Steered westward, the depression failed to intensify due to its quick forward motion despite a seemingly favorable environment, and it quickly dissipated at 00:00 UTC on July 6. [18]
Tropical storm (SSHWS) | |
Duration | July 12 – July 15 |
---|---|
Peak intensity | 65 mph (100 km/h) (1-min); 991 mbar (hPa) |
A tropical wave crossed Central America on July 8, developing into a tropical depression at 12:00 UTC on July 12 while located about 335 mi (539 km) southwest of Zihuatanejo, Mexico; six hours later, the depression intensified into Tropical Storm Blas. Steered swiftly northwestward around a mid-level ridge over the southwestern United States, the cyclone steadily intensified and reached peak winds of 65 mph (105 km/h) early on July 13 as a large and robust convective canopy became evident. Blas began a steady weakening trend as it tracked over increasingly cool sea surface temperatures, weakening to a tropical depression at 18:00 UTC on July 14 and degenerating into a large remnant low twelve hours later. The post-tropical cyclone decelerated and curved northeastward, dissipating well west of central Baja California early on July 19. [19]
Category 1 hurricane (SSHWS) | |
Duration | July 19 – July 25 |
---|---|
Peak intensity | 85 mph (140 km/h) (1-min); 981 mbar (hPa) |
A vigorous tropical wave entered the East Pacific on July 13, acquiring sufficient organization to be declared a tropical depression at 00:00 UTC on July 19 while located about 620 mi (1,000 km) south-southwest of the southern tip of the Baja California Peninsula. Directed west-northwest around a subtropical ridge, the cyclone steadily intensified amongst a favorable environment, becoming Tropical Storm Celia at 12:00 UTC that same day and further strengthening into a Category 1 hurricane on the Saffir–Simpson hurricane wind scale, the season's first, at 00:00 UTC on July 22. After attaining peak winds of 85 mph (137 km/h) six hours later, an increasingly unfavorable environment began to hinder the system. Celia weakened to a tropical storm at 18:00 UTC on July 22 and eventually degenerated into a remnant low at 00:00 UTC on July 26. The post-tropical cyclone dissipated about 1,740 mi (2,800 km) west-southwest of the southern tip of the Baja California Peninsula later that morning. [20]
Category 3 hurricane (SSHWS) | |
Duration | July 26 – August 1 |
---|---|
Peak intensity | 120 mph (195 km/h) (1-min); 957 mbar (hPa) |
A tropical depression formed at 12:00 UTC on July 26 while positioned about 760 mi (1,220 km) south-southwest of Cabo San Lucas, Mexico from a tropical wave that entered the eastern Pacific nearly a week prior. The system quickly intensified as it curved west-northwest around a subtropical ridge, becoming Tropical Storm Darby at 00:00 UTC on July 27 and strengthening into a Category 1 hurricane early the next day. After attaining its peak as the season's first major hurricane with winds of 120 mph (190 km/h), increasing wind shear and cooler sea surface temperatures begin to weaken the cyclone. It weakened to a tropical storm at 12:00 UTC on July 30 and further to a tropical depression a day later as it entered the jurisdiction of the Central Pacific Hurricane Center. [12] At 12:00 UTC on August 1, Darby dissipated about 850 mi (1,370 km) east of the Hawaiian Islands. [18]
Although Darby produced no impacts to land as a tropical cyclone, its remnant moisture field combined with an upper-level trough over Hawaii to produce an unstable atmosphere. General rainfall amounts of 2–5 in (51–127 mm) were recorded across the Big Island and Oahu, with a localized peak of 9.04 in (230 mm) in Kaneohe; this led to flooding and several road closures. Minor stream flooding was observed on the southeast flank of Mount Haleakalā. A rainfall total of 3.06 in (78 mm) was recorded at the Honolulu International Airport, contributing to the wettest August on record in the city. [21] Some coffee and macadamia nut trees were damaged. [22]
Tropical depression (SSHWS) | |
Duration | August 1 – August 2 |
---|---|
Peak intensity | 30 mph (45 km/h) (1-min); 1008 mbar (hPa) |
Operationally, an area of disturbed weather was thought to have coalesced into a tropical depression at 09:00 UTC on July 29 while located well southwest of the Baja California Peninsula. The depression was only expected to intensify slightly before entering cooler waters and interacting with outflow from nearby Hurricane Darby. [23] By late that evening, however, its presentation on satellite imagery more resembled a trough, and the NHC discontinued advisories. [24] In post-season analysis, the organization determined that the depression did not form until 06:00 UTC on August 1 and lasted but 24 hours. [25]
Tropical storm (SSHWS) | |
Duration | August 19 – August 24 |
---|---|
Peak intensity | 70 mph (110 km/h) (1-min); 989 mbar (hPa) |
A tropical wave interacted with a disturbance embedded in the ITCZ in mid-August, leading to the designation of a tropical depression at 06:00 UTC on August 19 while located 1,440 mi (2,320 km) east-southeast of Hilo, Hawaii. The cyclone moved west-northwest following formation, steered around a subtropical ridge. It intensified into Tropical Storm Estelle at 06:00 UTC on August 20 and attained peak winds of 70 mph (110 km/h) at 12:00 UTC the next morning as it crossed into the central Pacific. [26] Thereafter, increasing wind shear caused Estelle to a steady weakening trend. At 00:00 UTC on August 23, the cyclone decelerated to a tropical depression while turning west-southwest, and at 18:00 UTC the following day, it further degenerated into a remnant low. The post-tropical cyclone continued on a west-southwest trajectory prior to dissipating south-southeast of the Big Island at 00:00 UTC on August 26. [18]
Category 1 hurricane (SSHWS) | |
Duration | August 23 – August 26 |
---|---|
Peak intensity | 85 mph (140 km/h) (1-min); 979 mbar (hPa) |
A tropical wave, the remnants of Tropical Storm Earl in the Atlantic, crossed into the eastern Pacific in mid-August and steadily organized to become a tropical depression at 06:00 UTC on August 23 well south of the coastline of Mexico. The depression intensified into Tropical Storm Frank six hours later as banding features and central convection increased. Steered northwest within a favorable environment, the cyclone rapidly intensified into a Category 1 hurricane by 18:00 UTC and ultimately attained peak winds of 85 mph (137 km/h) twelve hours later. Frank steadily weakened thereafter as it entered cooler ocean temperatures, degenerating into a remnant low at 06:00 UTC on August 26. The remnant low drifted southwest before diffusing into a trough well south of the Baja California Peninsula the following day. [27]
Tropical depression (SSHWS) | |
Duration | August 23 – August 26 |
---|---|
Peak intensity | 35 mph (55 km/h) (1-min); 1005 mbar (hPa) |
A tropical wave crossed Central America on August 15, only slowing organizing into a tropical depression at 18:00 UTC on August 23 while located about 920 mi (1,480 km) west-southwest of Cabo San Lucas, Mexico. Steered north-northwest and eventually west, the cyclone failed to intensify further into a tropical storm amid cool sea surface temperatures and southerly wind shear, and it instead degenerated into a remnant low at 18:00 UTC on August 26. The post-tropical cyclone turned west-southwest before dissipating about 1,095 mi (1,762 km) east of Hilo, Hawaii early on August 28. [28]
Tropical storm (SSHWS) | |
Duration | August 26 – August 30 |
---|---|
Peak intensity | 65 mph (100 km/h) (1-min); 995 mbar (hPa) |
A westward-moving tropical wave entered the eastern Pacific in late August, acquiring sufficient organization to be declared a tropical depression at 12:00 UTC on August 26 about 605 miles (974 km) south-southeast of the Baja California Peninsula. The depression intensified into Tropical Storm Georgette six hours later as its satellite presentation improved, and it reached peak winds of 65 mph (105 km/h) at 12:00 UTC on August 27. Increasingly hostile upper-level winds began to impinge on the west-northwest-moving tropical cyclone shortly thereafter, ultimately causing it to degenerate into a remnant low by 18:00 UTC on August 30. The post-tropical cyclone continued its forward course until dissipating early on September 3. [29]
Category 4 hurricane (SSHWS) | |
Duration | August 30 – September 5 |
---|---|
Peak intensity | 140 mph (220 km/h) (1-min); 943 mbar (hPa) |
A westward-moving tropical wave from Africa entered the eastern Pacific in late August, organizing into a tropical depression at 12:00 UTC on August 30 south of the coastline of Mexico. The depression intensified into Tropical Storm Howard twelve hours later and further developed into a hurricane at 06:00 UTC on September 1. On its northwest track, a favorable environment regime prompted the cyclone to begin a period of rapid intensification, and it attained its peak as a Category 4 hurricane with winds of 140 mph (230 km/h) at 12:00 UTC on September 2. Cooler ocean temperatures led to a steady weakening trend thereafter, and Howard degenerated into a remnant low at 18:00 UTC on September 5. The low turned southwest before dissipating over open waters on September 10. [30]
Although the storm remained offshore, the outer bands of the storm produced significant flooding across the Baja California peninsula, [31] which damaged agricultural land and at least 393 homes. [32] Swells reached 18 ft (5.5 m) along the Baja California coastline and 12 ft (3.7 m) along the California coastline; about 1,000 lifeguard rescues took place in California due to the waves. [33] [34] Moisture from the storm enhanced rainfall in parts of Arizona, leading to minor accumulations. [35]
Category 1 hurricane (SSHWS) | |
Duration | September 8 – September 16 |
---|---|
Peak intensity | 75 mph (120 km/h) (1-min); 987 mbar (hPa) |
A tropical wave, possibly responsible for the formation of Hurricane Frances in the Atlantic, entered the eastern Pacific in early September, gaining sufficient organization to be declared a tropical depression at 06:00 UTC on September 8 about 530 miles (850 km) south of Cabo San Lucas, Mexico. The system tracked west, intensifying into Tropical Storm Isis twelve hours after being designated, but weakening back to a tropical depression early on September 10, amid persistent wind shear. Upper-level winds decreased by September 12, allowing Isis to regain tropical storm intensity by 00:00 UTC, and eventually peak as a Category 1 hurricane with winds of 75 mph (121 km/h), at 12:00 UTC on September 15. After conducting a clockwise loop, the hurricane entered cooler waters and began to weaken; it degenerated into a remnant low at 18:00 UTC on the next day. The low drifted southwest and then west, before dissipating well east of Hawaii on September 21. [36]
Category 4 hurricane (SSHWS) | |
Duration | September 10 – September 19 |
---|---|
Peak intensity | 150 mph (240 km/h) (1-min); 930 mbar (hPa) |
A tropical wave entered the eastern Pacific in early September, organizing into a tropical depression at 18:00 UTC on September 10 south of the Gulf of Tehuantepec. Under light shear, the depression intensified into Tropical Storm Javier at 12:00 UTC the next morning and into a hurricane at 18:00 UTC on September 12. The cyclone soon began a period of rapid intensification as it alternated on a west-northwest to northwest course, ultimately peaking as a Category 4 hurricane with winds of 150 mph (240 km/h) at 00:00 UTC on September 14 as a distinct pinhole eye became evident on satellite imagery. Cooler waters, strong southwesterly shear, and an eyewall replacement cycle all weakened Javier thereafter; it fell to tropical depression intensity early on September 19 before crossing Baja California and degenerated into a remnant low at 18:00 UTC that day over the Gulf of California. The low crossed the state of Sonora before dissipating over mountainous terrain on September 20. [13]
As a tropical cyclone, Javier produced moderate rainfall peaking at 3.14 in (80 mm) in Bacanuchi, Mexico. [37] Three fishermen went missing offshore the coastline due to high surf. [38] As a post-tropical cyclone, the storm's remnant moisture overspread the Southwest United States, alleviating a multi-year drought. [39] Accumulations peaked at 7 in (180 mm) in Walnut Creek, Arizona, with lighter totals across the Four Corners and upper Midwest. [40] The remnants of Javier produced 2 in (51 mm) of rain in Wyoming, cementing its status as the wettest tropical cyclone in the reliable record there. [41]
Tropical storm (SSHWS) | |
Duration | October 4 – October 6 |
---|---|
Peak intensity | 45 mph (75 km/h) (1-min); 1004 mbar (hPa) |
An area of disturbed weather developed within the ITCZ well southwest of mainland Mexico, coalescing into a tropical depression at 18:00 UTC on October 4. The depression strengthened into Tropical Storm Kay twelve hours later, and it attained peak winds of 45 mph (72 km/h) at 12:00 UTC the next morning as suggested by satellite intensity estimates. Moderate northerly shear caused core convection to decrease as the system moved west-northwest, resulting in Kay degenerating into a remnant low at 12:00 UTC on October 6 over open ocean. The low-level swirl curved southwestward and dissipated the next day. [42]
Tropical storm (SSHWS) | |
Duration | October 11 – October 13 |
---|---|
Peak intensity | 50 mph (85 km/h) (1-min); 1000 mbar (hPa) |
An area of disturbed weather south of the Gulf of Tehuantepec organized into a tropical depression at 18:00 UTC on October 11. Steered northwest to west-northwest by a mid-level ridge to its north and a broad cyclonic circulation to its southwest, the depression intensified into Tropical Storm Lester at 18:00 UTC the next day. The system was initially forecast to become a hurricane amid light shear; however, interaction with the coastline of Mexico and the nearby cyclonic circulation instead caused Lester to weaken. Observations from a reconnaissance aircraft indicated the storm degenerated into a trough at 18:00 UTC on October 13. [43]
As the cyclone paralleled the coastline of Mexico, a tropical storm warning was hoisted from Punta Maldonado, Guerrero, to Lázaro Cárdenas, Michoacán. Rainfall accumulations of 3–5 in (76–127 mm) were observed across Oaxaca and Guerrero, leading to localized flooding. [43]
Tropical depression (SSHWS) | |
Duration | October 25 – October 26 |
---|---|
Peak intensity | 35 mph (55 km/h) (1-min); 1004 mbar (hPa) |
A tropical wave entered the eastern Pacific in mid-October, interacting with two previous tropical waves that resulted in a large area of disturbed weather. The system organized into a tropical depression at 00:00 UTC on October 25 about 315 miles (507 km) south-southeast of the Baja California Peninsula. Initially, the cyclone was characterized by a large area of deep convection enhanced from an upper-level trough. This same trough soon imparted strong wind shear, preventing intensification. The depression moved into Sinaloa early that same day and dissipated over the Sierra Madre Occidental at 18:00 UTC on October 26. [44]
The depression produced locally heavy rainfall across western Mexico, resulting in some localized flooding. [44] Culiacán International Airport recorded a peak wind gust of 80 mph (130 km/h), suggesting a tornado may have occurred nearby. [45] The remnant mid-level circulation associated with the cyclone interacted with a frontal system to produce strong thunderstorms across the southern Great Plains. [44]
On August 14, the Japan Meteorological Agency had stated that Tropical Storm Malakas had briefly exited the West Pacific basin and entered the Central Pacific basin, as a weakening tropical depression. [46]
The following list of names was used for named storms that formed in the North Pacific east of 140°W in 2004. [47] This is the same list used for the 1998 season. [48] No names were retired from this list by the World Meteorological Organization following the season, and it was used again for the 2010 season. [49]
|
For storms that form in the North Pacific between 140°W and the International Date Line, the names come from a series of four rotating lists. Names are used one after the other without regard to year, and when the bottom of one list is reached, the next named storm receives the name at the top of the next list. [47] No named storms formed within the region in 2004. Named storms in the table above that crossed into the area during the year are noted (*). [18]
This is a table of all of the storms that formed in the 2004 Pacific hurricane season. It includes their name, duration, peak classification and intensities, areas affected, damage, and death totals. Deaths in parentheses are additional and indirect (an example of an indirect death would be a traffic accident), but were still related to that storm. Damage and deaths include totals while the storm was extratropical, a wave, or a low, and all of the damage figures are in 2004 USD.
Saffir–Simpson scale | ||||||
TD | TS | C1 | C2 | C3 | C4 | C5 |
Storm name | Dates active | Storm category at peak intensity | Max 1-min wind mph (km/h) | Min. press. (mbar) | Areas affected | Damage (USD) | Deaths | Ref(s) | ||
---|---|---|---|---|---|---|---|---|---|---|
Agatha | May 22–24 | Tropical storm | 60 (95) | 997 | Revillagigedo Islands, Clarion Island, Southwestern Mexico | None | None | |||
Two-E | July 2–3 | Tropical depression | 35 (55) | 1007 | None | None | None | |||
One-C | July 5 | Tropical depression | 30 (45) | 1007 | None | None | None | |||
Blas | July 12–15 | Tropical storm | 65 (100) | 991 | Northwestern Mexico, Baja California Peninsula, Southwestern United States | None | None | |||
Celia | July 19–25 | Category 1 hurricane | 85 (140) | 981 | None | None | None | |||
Darby | July 26 – August 1 | Category 3 hurricane | 120 (195) | 957 | None | Minimal | None | |||
Six-E | August 1–2 | Tropical depression | 30 (45) | 1008 | None | None | None | |||
Estelle | August 19–24 | Tropical storm | 70 (110) | 989 | None | None | None | |||
Frank | August 23–26 | Category 1 hurricane | 85 (140) | 979 | Baja California Peninsula | None | None | |||
Nine-E | August 23–26 | Tropical depression | 35 (55) | 1005 | None | None | None | |||
Georgette | August 26–30 | Tropical storm | 65 (100) | 995 | None | None | None | |||
Howard | August 30 – September 5 | Category 4 hurricane | 140 (220) | 943 | Baja California Peninsula, Western United States, California, Arizona | Minimal | None | |||
Isis | September 8–16 | Category 1 hurricane | 75 (120) | 987 | None | None | None | |||
Javier | September 10–19 | Category 4 hurricane | 150 (240) | 930 | Baja California Peninsula, Northwestern Mexico, Southwestern United States, Arizona, Texas | Minimal | 3 missing | |||
Kay | October 4–6 | Tropical storm | 45 (75) | 1004 | None | None | None | |||
Lester | October 11–13 | Tropical storm | 50 (85) | 1000 | Southwestern Mexico | None | None | |||
Sixteen-E | October 25–26 | Tropical depression | 35 (55) | 1004 | Baja California Peninsula, Northwestern Mexico, Southwestern United States, Texas, California | None | None | |||
Season aggregates | ||||||||||
17 systems | May 22 – October 26 | 150 (240) | 930 | Minimal | None |
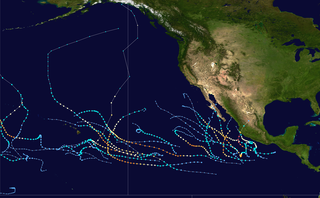
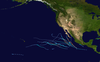
The 2005 Pacific hurricane season was a near-average Pacific hurricane season which produced fifteen named storms, seven hurricanes and two major hurricanes. It was also the second consecutive season in which no tropical cyclone of at least tropical storm intensity made landfall. The season officially began on May 15 in the East Pacific Ocean, and on June 1 in the Central Pacific; they ended on November 30. These dates conventionally delimit the period of each year when most tropical cyclones form in the Pacific basin. However, the formation of tropical cyclones is possible at any time of the year.
The 2003 Pacific hurricane season was the first season to feature no major hurricanes since 1977. The season officially began on May 15, 2003 in the Eastern North Pacific, and on June 1 in the Central ; both ended on November 30. These dates, adopted by convention, historically describe the period in each year when most tropical cyclogenesis occurs in these regions of the Pacific. The season featured 16 tropical storms, 7 of which intensified into hurricanes, which was then considered an average season. Damage across the basin reached US$129 million, and 23 people were killed by the storms.
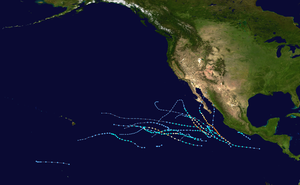
The 1999 Pacific hurricane season was one of the least active Pacific hurricane seasons on record. The season officially began on May 15 in the Eastern Pacific, and on June 1 in the Central Pacific; in both basins, it ended on November 30. These dates conventionally delimit the period during which most tropical cyclones form in the northeastern Pacific Ocean. The first tropical cyclone of the season, Hurricane Adrian, developed on June 18, while the final storm of the season, Tropical Storm Irwin, dissipated on October 11. No storms developed in the Central Pacific during the season. However, two storms from the Eastern Pacific, Dora and Eugene, entered the basin, with the former entering as a hurricane and becoming the second farthest travelling Pacific hurricane on record.
The 2008 Pacific hurricane season was a near-average Pacific hurricane season which featured seventeen named storms, though most were rather weak and short-lived. Only seven storms became hurricanes, of which two intensified into major hurricanes. This season was also the first since 1996 to have no cyclones cross into the central Pacific. The season officially began on May 15 in the eastern Pacific and on June 1 in the central Pacific. It ended in both regions on November 30. These dates, adopted by convention, historically describe the period in each year when most tropical cyclone formation occurs in these regions of the Pacific. This season, the first system, Tropical Storm Alma, formed on May 29, and the last, Tropical Storm Polo, dissipated on November 5.
The 2012 Pacific hurricane season was a moderately active Pacific hurricane season that saw an unusually high number of tropical cyclones pass west of the Baja California Peninsula. The season officially began on May 15 in the eastern Pacific Ocean, and on June 1 in the central Pacific (from 140°W to the International Date Line, north of the equator; they both ended on November 30. These dates conventionally delimit the period of each year when most tropical cyclones form in these regions of the Pacific Ocean. However, the formation of tropical cyclones is possible at any time of the year. This season's first system, Tropical Storm Aletta, formed on May 14, and the last, Tropical Storm Rosa, dissipated on November 3.
The 2009 Pacific hurricane season was the most active Pacific hurricane season since 1997. The season officially started on May 15 in the East Pacific Ocean, and on June 1 in the Central Pacific; they both ended on November 30. These dates conventionally delimit the period of each year when most tropical cyclones form in the Eastern Pacific tropical cyclone basin; however, tropical cyclone formation is possible at any time of the year. The first system of the season, Tropical Depression One-E, developed on June 18, and the last, Hurricane Neki, dissipated on October 27, keeping activity well within the bounds of the season.
The 2013 Pacific hurricane season was an above average Pacific hurricane season with 21 tropical cyclones forming. Of these, 20 became named storms – 18 in the Eastern Pacific basin, and 2 in the Central Pacific basin. Of the 18 named storms in the east, 9 became hurricanes, with one, Raymond, becoming the season's only major hurricane. In the central, neither named storm became a hurricane. It was also a below-normal season in terms of Accumulated cyclone energy (ACE), as many of its systems were weak and short-lived. The season officially began on May 15 in the Eastern Pacific and started on June 1 in the Central Pacific; both ended on November 30. These dates conventionally delimit the period of each year when most tropical development occurs in these North Pacific basins. The first cyclone, Tropical Storm Alvin, formed on May 15, and the last, Tropical Storm Sonia, dissipated on November 4.
The 2014 Pacific hurricane season was the fifth-busiest season since reliable records began in 1949, alongside the 2016 season. The season officially started on May 15 in the East Pacific Ocean, and on June 1 in the Central Pacific; they both ended on November 30. These dates conventionally delimit the period of each year when most tropical cyclones form in the Pacific basin.
The 2015 Pacific hurricane season is the second-most active Pacific hurricane season on record, with 26 named storms, only behind the 1992 season. A record-tying 16 of those storms became hurricanes, and a record 11 storms further intensified into major hurricanes throughout the season. The Central Pacific, the portion of the Northeast Pacific Ocean between the International Date Line and the 140th meridian west, had its most active year on record, with 16 tropical cyclones forming in or entering the basin. Moreover, the season was the third-most active season in terms of accumulated cyclone energy, amassing a total of 290 units. The season officially started on May 15 in the Eastern Pacific and on June 1 in the Central Pacific; they both ended on November 30. These dates conventionally delimit the period of each year when most tropical cyclones form in the Northeast Pacific basin. However, the formation of tropical cyclones is possible at any time of the year. This was shown when a tropical depression formed on December 31. The above-average activity during the season was attributed in part to the very strong 2014–16 El Niño event.
The 2016 Pacific hurricane season was tied as the fifth-most active Pacific hurricane season on record, alongside the 2014 season. Throughout the course of the year, a total of 22 named storms, 13 hurricanes and six major hurricanes were observed within the basin. Although the season was very active, it was considerably less active than the previous season, with large gaps of inactivity at the beginning and towards the end of the season. It officially started on May 15 in the Eastern Pacific, and on June 1 in the Central Pacific ; they both ended on November 30. These dates conventionally delimit the period of each year when most tropical cyclones form in these regions of the Pacific Ocean. However, tropical development is possible at any time of the year, as demonstrated by the formation of Hurricane Pali on January 7, the earliest Central Pacific tropical cyclone on record. After Pali, however, no tropical cyclones developed in either region until a short-lived depression on June 6. Also, there were no additional named storms until July 2, when Tropical Storm Agatha formed, becoming the latest first-named Eastern Pacific tropical storm since Tropical Storm Ava in 1969.
The 2010 Pacific hurricane season was one of the least active seasons on record, featuring the fewest named storms since 1977. The season officially started on May 15 in the eastern Pacific—east of 140°W—and on June 1 in the central Pacific—between the International Date Line and 140°W—and lasted until November 30. These dates typically cover the period of each year when most tropical cyclones form in the eastern Pacific basin. The season's first storm, Tropical Storm Agatha, developed on May 29; the season's final storm, Tropical Storm Omeka, degenerated on December 21.
The 2012 Pacific hurricane season was an above-average year in which seventeen named storms formed. The hurricane season officially began on May 15 in the east Pacific—defined as the region east of 140°W—and on June 1 in the central Pacific—defined as the region west of 140°W to the International Date Line—and ended on November 30 in both regions. These dates conventionally delimit the period during each year when most tropical cyclones form in the northeastern Pacific Ocean. This year, the first storm of the season, Tropical Storm Aletta, formed on May 14, and the last, Tropical Storm Rosa, dissipated on November 3.
The 2013 Pacific hurricane season was an above-average year in which twenty named storms developed. The hurricane season officially began on May 15 in the East Pacific, coinciding with the formation of Tropical Storm Alvin, and on June 1 in the Central Pacific; it ended on November 30 in both basins. These dates conventionally delimit the period during each year when most tropical cyclones form. The final system of the year, Tropical Storm Sonia, dissipated on November 4.
The 2014 Pacific hurricane season was an event in the annual cycle of tropical cyclone formation. It officially began on May 15 in the eastern Pacific—defined as the region east of 140°W—and began on June 1 in the central Pacific, defined as the region west of 140°W to the International Date Line; both ended on November 30.
The 2015 Pacific hurricane season was the second-most active Pacific hurricane season on record, and featured the strongest tropical cyclone ever observed in the Western Hemisphere: Hurricane Patricia. The season officially started on May 15 in the Eastern Pacific—east of 140°W—and on June 1 in the Central Pacific—between the International Date Line and 140°W—and ended on November 30. These dates typically cover the period of each year when most tropical cyclones form in the Northeastern Pacific tropical cyclone basin. The season's first storm, Hurricane Andres, developed on May 28; the season's final storm, Tropical Depression Nine-C, dissipated on December 31, well after the official end of the season.
The 2016 Pacific hurricane season was an event in the annual cycle of tropical cyclone formation, in which tropical cyclones form in the eastern Pacific Ocean. The season officially started on May 15 in the eastern Pacific–east of 140°W–and on June 1 in the central Pacific–between the International Date Line and 140°W–and ended on November 30. These dates typically cover the period of each year when most tropical cyclones form in the eastern Pacific basin. However the first storm, Pali, formed 5 months before the official start of the season on January 7, which broke the record for having the earliest forming storm within the basin.
The 2019 Pacific hurricane season was an above average season which produced nineteen named storms, most of which were rather weak and short-lived. Only seven hurricanes formed, the fewest since 2010. The season officially began on May 15 in the East Pacific Ocean, and on June 1 in the Central Pacific; they both ended on November 30. These dates conventionally delimit the period of each year when most tropical cyclones form in the Pacific basin. This season was one of the latest-starting Pacific hurricane seasons on record, with the first tropical cyclone, Hurricane Alvin, forming on June 25. The final system, Tropical Depression Twenty-One-E, dissipated on November 18.
The 2018 Pacific hurricane season was an event in the annual cycle of tropical cyclone formation, in which tropical cyclones form in the eastern Pacific Ocean. The season officially started on May 15 in the eastern Pacific—east of 140°W—and began on June 1 in the central Pacific—the region between the International Date Line and 140°W, and ended on November 30. These dates typically cover the period of each year when most tropical cyclones form in the eastern Pacific basin. The season began with the formation of Tropical Depression One-E, which developed on May 10, and ended with the dissipation of the season's final storm, Tropical Storm Xavier, which dissipated as a tropical cyclone on November 5.
The 2020 Pacific hurricane season was a near average Pacific hurricane season in terms of named storms, featuring 17, but well below average season for hurricanes and major hurricanes, with only 4 hurricanes and 3 major hurricanes forming. Additionally, no tropical cyclones formed in the Central Pacific basin for the first time since 2017. The season officially began on May 15 in the East Pacific Ocean, and on June 1 in the Central Pacific (from 140°W to the International Date Line, north of the equator; they both ended on November 30. These dates conventionally delimit the period of each year when most tropical cyclones form in the respective regions. However, the formation of tropical cyclones is possible at any time of the year, as illustrated in 2020 by the formation of the season's first system, Tropical Depression One-E, on April 25. This was the earliest formation of a tropical cyclone on record in the eastern Pacific basin proper. The final system of the season was Tropical Storm Polo, which dissipated on November 19.
The 2020 Pacific hurricane season was an event in the annual cycle of tropical cyclone formation, in which tropical cyclones form in the Eastern Pacific Ocean. The season officially started on May 15 in the Eastern Pacific—east of 140°W—and began on June 1 in the Central Pacific—the region between the International Date Line and 140°W–and ended on November 30. These dates typically cover the period of each year when most tropical cyclones form in the Eastern Pacific basin according to the National Hurricane Center. However, tropical cyclones sometimes form outside the bounds of an official season, as was evidenced by the formation of Tropical Depression One-E on April 25. The season effectively ended with the dissipation of its final storm, Tropical Storm Polo, on November 19.
{{cite report}}
: CS1 maint: bot: original URL status unknown (link){{cite report}}
: CS1 maint: bot: original URL status unknown (link){{cite web}}
: CS1 maint: bot: original URL status unknown (link)