The 2004 Pacific hurricane season was an overall below-average Pacific hurricane season in which there were 12 named tropical storms, all of which formed in the eastern Pacific basin. Of these, 6 became hurricanes, and 3 of those intensified into major hurricanes. No storms made landfall in 2004, the first such occurrence since 1991. In addition to the season's 12 named storms, there were five tropical depressions that did not reach tropical storm status. One of them, Sixteen-E, made landfall in northwestern Sinaloa. The season officially began on May 15 in the eastern Pacific, and on June 1 in the central Pacific basin. It officially ended in both basins on November 30. These dates conventionally delimit the period during each year when most tropical cyclones form in each respective basin. These dates conventionally delimit the period during each year when a majority of tropical cyclones form. The season was reflected by an accumulated cyclone energy (ACE) index of 71 units.

The 2005 Pacific hurricane season was a near-average Pacific hurricane season which produced fifteen named storms, seven hurricanes and two major hurricanes. It was also the second consecutive season in which no tropical cyclone of at least tropical storm intensity made landfall. The season officially began on May 15 in the East Pacific Ocean, and on June 1 in the Central Pacific; they ended on November 30. These dates conventionally delimit the period of each year when most tropical cyclones form in the Pacific basin. However, the formation of tropical cyclones is possible at any time of the year.

The 2003 Pacific hurricane season was the first season to feature no major hurricanes since 1977. The season officially began on May 15, 2003 in the Eastern North Pacific, and on June 1 in the Central ; both ended on November 30. These dates, adopted by convention, historically describe the period in each year when most tropical cyclogenesis occurs in these regions of the Pacific. The season featured 16 tropical storms, 7 of which intensified into hurricanes, which was then considered an average season. Damage across the basin reached US$129 million, and 23 people were killed by the storms.
The 2001 Pacific hurricane season was a relatively near-average Pacific hurricane season which produced sixteen named storms, though most were rather weak and short-lived including one unnamed tropical storm which was operationally recognized as a tropical depression, the first such occurrence since 1996. Only eight hurricanes formed and two major hurricanes. The season officially began on May 15 in the East Pacific Ocean, and on June 1 in the Central Pacific; they ended on November 30. These dates conventionally delimit the period of each year when most tropical cyclones form in the Pacific basin. However, the formation of tropical cyclones is possible at any time of the year.

The 2000 Pacific hurricane season was an above-average Pacific hurricane season, although most of the storms were weak and short-lived. There were few notable storms this year. Tropical storms Miriam, Norman, and Rosa all made landfall in Mexico with minimal impact. Hurricane Daniel briefly threatened the U.S. state of Hawaii while weakening. Hurricane Carlotta was the strongest storm of the year and the second-strongest June hurricane in recorded history. Carlotta killed 18 people when it sank a freighter. Overall, the season was significantly more active than the previous season, with 19 tropical storms. In addition, six hurricanes developed. Furthermore, there were total of two major hurricanes.

The 1998 Pacific hurricane season was a fairly average Pacific hurricane season. Despite this, it had nine hurricanes and six major hurricanes, which was well above average. The season officially started on May 15 in the eastern Pacific and on June 1 in the central Pacific, and ended on November 30; these dates conventionally delimit the period during which most tropical cyclones form in that region. The first tropical cyclone developed on June 11, about ten days later than the normal start of the season. The final storm of the year, Hurricane Madeline, dissipated on October 20. Storm activity in the Central Pacific Hurricane Center's warning zone was low, with just one tropical depression observed in the region. Two tropical cyclones from the eastern Pacific also entered the central Pacific; the former did so as a hurricane.

The 1995 Pacific hurricane season was the least active Pacific hurricane season since 1979, and marked the beginning of a multi-decade period of low activity in the basin. Of the eleven tropical cyclones that formed during the season, four affected land, with the most notable storm of the season being Hurricane Ismael, which killed at least 116 people in Mexico. The strongest hurricane in the season was Hurricane Juliette, which reached peak winds of 150 mph (240 km/h), but did not significantly affect land. Hurricane Adolph was an early-season Category 4 hurricane. Hurricane Henriette brushed the Baja California Peninsula in early September.

The 1993 Pacific hurricane season included more than double the average number of major hurricanes – Category 3 or stronger cyclones on the Saffir–Simpson scale. This activity was the result of an El Niño event, which is the main factor contributing to above-average activity across the Pacific basin. The season featured 15 named storms, 11 hurricanes, and 9 major hurricanes. While the number of named storms was near the long-term average, the number of hurricanes was above the average of 8, and the number of major hurricanes far exceeded the long-term average of 4. Seasonal activity began on May 17 and ended on November 8, within the confines of a traditional hurricane season which begins on May 15 in the East Pacific and June 1 in the Central Pacific. The season ends on November 30 in both basins. These dates conventionally delimit the period during each year when most tropical cyclones form.

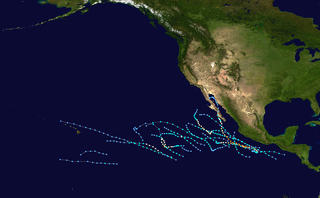
The 1992 Pacific hurricane season is the most active Pacific hurricane season on record, featuring 27 named storms. The season also produced the second-highest ACE value on record in the basin, only surpassed by the 2018 season. The 1992 season officially started on May 15 in the eastern Pacific, and on June 1 in the central Pacific, and lasted until November 30. These dates conventionally delimit the period of each year when most tropical cyclones form in the northeastern Pacific Ocean. However, tropical cyclogenesis is possible at any time of the year, as demonstrated by the development of Hurricane Ekeka on January 28, and Tropical Storm Hali two months later.

The 1991 Pacific hurricane season was a near-average Pacific hurricane season. The worst storm this year was Tropical Storm Ignacio, which killed 23 people in Mexico and injured 40 others. Elsewhere, Hurricane Fefa caused flooding in Hawaii. Hurricane Kevin was the strongest system of the season and became the then longest-lasting hurricane in the eastern north Pacific basin at the time, and Hurricane Nora was the strongest November storm to that point. The season officially started on May 15, 1991, in the eastern Pacific, and on June 1, 1991, in the central Pacific. It lasted until November 30, 1991, in both basins. These dates conventionally delimit the period of each year when most tropical cyclones form in the northeastern Pacific Ocean.

The 1990 Pacific hurricane season was a very active season which observed 21 named storms within the basin. The season also produced the fourth highest ACE index value on record. The season was officially started on May 15 in the eastern Pacific, and on June 1 in the central Pacific, and lasted until November 30. These dates conventionally delimit the period of each year when most tropical cyclones form in the northeastern Pacific Ocean. However, the formation of tropical cyclones is possible at any time of the year, as illustrated in 1990 by the formation of the season's first named storm, Hurricane Alma, on May 12. At the time, this was the earliest formation of a tropical storm on record in the eastern Pacific

The 2008 Pacific hurricane season was a near-average Pacific hurricane season which featured seventeen named storms, though most were rather weak and short-lived. Only seven storms became hurricanes, of which two intensified into major hurricanes. This season was also the first since 1996 to have no cyclones cross into the central Pacific. The season officially began on May 15 in the eastern Pacific and on June 1 in the central Pacific. It ended in both regions on November 30. These dates, adopted by convention, historically describe the period in each year when most tropical cyclone formation occurs in these regions of the Pacific. This season, the first system, Tropical Storm Alma, formed on May 29, and the last, Tropical Storm Polo, dissipated on November 5.

Hurricane Isaac was a large and powerful Cape Verde hurricane that lasted through late September and early October 2000. The thirteenth tropical cyclone, ninth named storm, and the fifth hurricane of 2000 Atlantic hurricane season, Isaac developed from a tropical wave south of Cape Verde on September 21. The depression intensified, and on the following day, it was upgraded to Tropical Storm Isaac. Due to conductive atmospheric conditions, Isaac continued to strengthen, and attained hurricane intensity on September 23. Isaac managed to become a Category 3 hurricane on September 24, before steadily weakening shortly thereafter. By September 26, the storm had deteriorated to a Category 1 hurricane. However, it again encountered favorable conditions, which caused Isaac to re-intensify.

The 2012 Pacific hurricane season was a moderately active Pacific hurricane season that saw an unusually high number of tropical cyclones pass west of the Baja California Peninsula. The season officially began on May 15 in the eastern Pacific Ocean, and on June 1 in the central Pacific (from 140°W to the International Date Line, north of the equator; they both ended on November 30. These dates conventionally delimit the period of each year when most tropical cyclones form in these regions of the Pacific Ocean. However, the formation of tropical cyclones is possible at any time of the year. This season's first system, Tropical Storm Aletta, formed on May 14, and the last, Tropical Storm Rosa, dissipated on November 3.
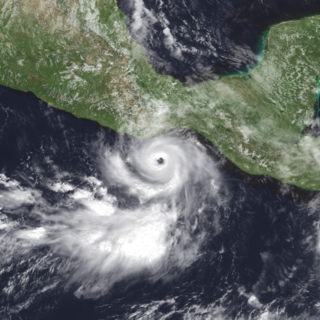
Hurricane Lester was a small but powerful tropical cyclone that caused heavy flooding in Central America and southern Mexico in October 1998. Lester was the fifteenth tropical cyclone, twelfth named storm and eighth hurricane of the 1998 Pacific hurricane season. Lester originated from a tropical wave that emerged off the coast of Africa on September 29. Under favorable conditions, the storm was classified as a tropical depression on October 15. The depression was upgraded to a tropical storm later that day and a hurricane on October 16. After undergoing fluctuations in intensity, Lester reached peak winds of 115 mph (185 km/h), a Category 3 hurricane on the Saffir-Simpson Hurricane Scale. After several days, it degenerated into a tropical storm on October 26, and dissipated shortly after. The hurricane made its closest approach to land on October 28, producing moderate winds and heavy rainfall. A mudslide triggered by the precipitation killed two children, although damage is unknown.

The 2006 Pacific hurricane season was the first above-average season since 1997 which produced twenty-five tropical cyclones, with nineteen named storms, though most were rather weak and short-lived. There were eleven hurricanes, of which six became major hurricanes. Following the inactivity of the previous seasons, forecasters predicted that season would be only slightly above active. It was also the first time since 2003 in which one cyclone of at least tropical storm intensity made landfall. The season officially began on May 15 in the East Pacific Ocean, and on June 1 in the Central Pacific; they ended on November 30. These dates conventionally delimit the period of each year when most tropical cyclones form in the Pacific basin. However, the formation of tropical cyclones is possible at any time of the year.
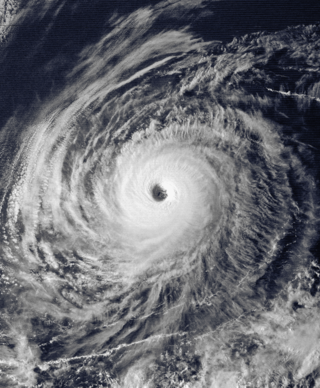
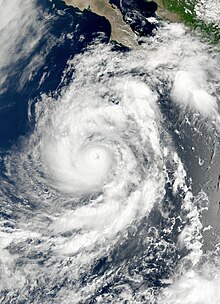
Hurricane Tina was the strongest and longest-lived storm of the 1992 Pacific hurricane season, which also threatened land for a brief period. The twenty-fourth tropical cyclone, twenty-second tropical storm, fourteenth hurricane, and eighth major hurricane of the record breaking season, Tina formed from a tropical wave on September 17. The storm moved towards the west and strengthened into a hurricane. A breakdown in a ridge and to the north and a trough then re-curved Tina to the northeast and towards land, still moving slowly and gradually slowing down. The trough broke down and was replaced by a strong ridge. Tina then changed direction again and headed out to sea. It intensified into a Category 4 storm with winds of 150 mph (240 km/h) and a central pressure of 932 millibars. Tina then slowly weakened as it turned to the north. Tropical Depression Tina dissipated on October 11, shortly after entering the Central Pacific Hurricane Center's area of responsibility. Although the tropical cyclone never made landfall, heavy rains were recorded across western Mexico. While at peak intensity, the storm also displayed annular characteristics.

The 2009 Pacific hurricane season was the most active Pacific hurricane season since 1997. The season officially started on May 15 in the East Pacific Ocean, and on June 1 in the Central Pacific; they both ended on November 30. These dates conventionally delimit the period of each year when most tropical cyclones form in the Eastern Pacific tropical cyclone basin; however, tropical cyclone formation is possible at any time of the year. The first system of the season, Tropical Depression One-E, developed on June 18, and the last, Hurricane Neki, dissipated on October 27, keeping activity well within the bounds of the season.

The 2016 Pacific hurricane season was tied as the fifth-most active Pacific hurricane season on record, alongside the 2014 season. Throughout the course of the year, a total of 22 named storms, 13 hurricanes and six major hurricanes were observed within the basin. Although the season was very active, it was considerably less active than the previous season, with large gaps of inactivity at the beginning and towards the end of the season. It officially started on May 15 in the Eastern Pacific, and on June 1 in the Central Pacific ; they both ended on November 30. These dates conventionally delimit the period of each year when most tropical cyclones form in these regions of the Pacific Ocean. However, tropical development is possible at any time of the year, as demonstrated by the formation of Hurricane Pali on January 7, the earliest Central Pacific tropical cyclone on record. After Pali, however, no tropical cyclones developed in either region until a short-lived depression on June 6. Also, there were no additional named storms until July 2, when Tropical Storm Agatha formed, becoming the latest first-named Eastern Pacific tropical storm since Tropical Storm Ava in 1969.

The 2022 Pacific hurricane season was an above average hurricane season in the eastern North Pacific basin, with nineteen named storms, ten hurricanes, and four major hurricanes. Two of the storms crossed into the basin from the Atlantic. In the central North Pacific basin, no tropical cyclones formed. The season officially began on May 15 in the eastern Pacific, and on June 1 in the central; both ended on November 30. These dates historically describe the period each year when most tropical cyclogenesis occurs in these regions of the Pacific and are adopted by convention.