Hurricane Sergio (2018)

Last updated

Map key
  Tropical depression (≤38 mph, ≤62 km/h)
  Tropical storm (39–73 mph, 63–118 km/h)
  Category 1 (74–95 mph, 119–153 km/h)
  Category 2 (96–110 mph, 154–177 km/h)
  Category 3 (111–129 mph, 178–208 km/h)
  Category 4 (130–156 mph, 209–251 km/h)
  Category 5 (≥157 mph, ≥252 km/h)
  Unknown
Storm type
Disc Plain black.svg Tropical cyclone
Solid black.svg Subtropical cyclone
ArrowUp.svg Extratropical cyclone, remnant low, tropical disturbance, or monsoon depression

The origins of Hurricane Sergio can be traced to a weather system that was located over northwestern South America on September 24. Although uncertain, there is a possibility that Sergio arose from a tropical wave that departed from the west coast of Africa on September 13. [1] The National Hurricane Center (NHC) forecast on September 25 that a low-pressure area would form a few hundred miles south of the Gulf of Tehuantepec in about two days. [3] A low-pressure system materialized a few hundred miles south-southeast of Mexico's southern coast around 12:00  UTC on September 26. [4] The NHC continued to track the disturbance for a few more days as the system traveled west-northwest, [5] before it developed into Tropical Storm Sergio on September 29 at 12:00 UTC, while approximately 385 mi (620 km) south of Zihuatanejo, Mexico. [1] [6] Unlike most other tropical cyclones, Sergio did not possess an inner wind core. Instead, the maximum sustained winds were located in a rainband approximately 125 mi (201 km) east of the center. [7]

Hurricane Sergio acquiring annular characteristics on October 7 Sergio 2018-10-07 2125Z.jpg
Hurricane Sergio acquiring annular characteristics on October 7

Despite being located within a favorable environment of warm sea surface temperatures and low wind shear, Sergio only gradually intensified over the next couple of days, the system becoming a Category 1 hurricane on October 2 at 00:00 UTC. Meanwhile, the storm tracked just south of west as a mid-level ridge developed to the north. [1] At that point, the storm had developed a well-defined eye surrounded by −85 °C (−121 °F) clouds. [8] The hurricane then began a period of rapid intensification, reaching Category 3 major hurricane status by 18:00 UTC. [1] The wind speed then leveled off for about 18 hours as the system underwent an eyewall replacement cycle. [1] At the same time, the mid-level ridge had weakened, resulting in the storm traveling to the northwest. [9] Sergio then began another period of intensification, becoming the eighth Category 4 hurricane of the season on October 4 at 00:00 UTC, breaking the old record of seven set in 2015. [1] [10] Six hours later, the system peaked with maximum sustained winds of 140 mph (230 km/h) and a minimum central pressure of 942 mbar (27.8 inHg), while located about 825 mi (1,328 km) southwest of Cabo San Lucas. The storm maintained peak intensity for 12 hours before weakening due to another eyewall replacement cycle. [1] As a result, its structure deteriorated, the eye fading and the surrounding cloud tops warming. [11] A faraway mid-latitude ridge caused Sergio to turn towards the southwest from October 5–6. [1]

After bottoming out as a low-end Category 3 hurricane on October 5 at 06:00 UTC, Sergio began to intensify once more, reaching a secondary peak with winds of 125 mph (201 km/h) on October 6 at 00:00 UTC. [1] After maintaining its intensity for 18 hours, the hurricane began to weaken around 00:00 UTC on October 7 due to upwelling and a third eyewall replacement cycle. [1] [12] Soon after, Sergio began another turn, rotating from the southwest to the northeast over the next few days due to the influence of a mid-latitude trough. [1] It unexpectedly acquired some annular characteristics early on October 7, with the eye having doubled in size while most of the banding features disappeared. [13] The system gradually weakened over the next two days, falling to tropical storm status on October 9 at 18:00 UTC, due to cooling sea surface temperatures. Sergio made landfall near Los Castros, Baja California Sur, around 12:00 UTC on October 12, as a 50 mph (80 km/h) tropical storm. After crossing over the Baja California Peninsula and traversing the Gulf of California, the storm made a second landfall near Guaymas, Sonora, as a tropical depression around 18:00 UTC, before dissipating over northwest Mexico around midnight. [1] Its remnants continued northeastward, causing heavy rainfall and tornadoes in the United States. [14]

Sergio's slow movement speed and large size resulted in the ocean cooling 4.5–9.4 °F (−15.3 – −12.6 °C) as a result of its passage. [15] Rainfall from Sergio was discovered to contain 11.8% less Oxygen-18 than expected of convective-based storms across the Sonora River Basin. [16]

Preparations and impact

Mexico

Tropical Storm Sergio approaching the Baja California Peninsula on October 11 Sergio 2018-10-11 2104Z.jpg
Tropical Storm Sergio approaching the Baja California Peninsula on October 11

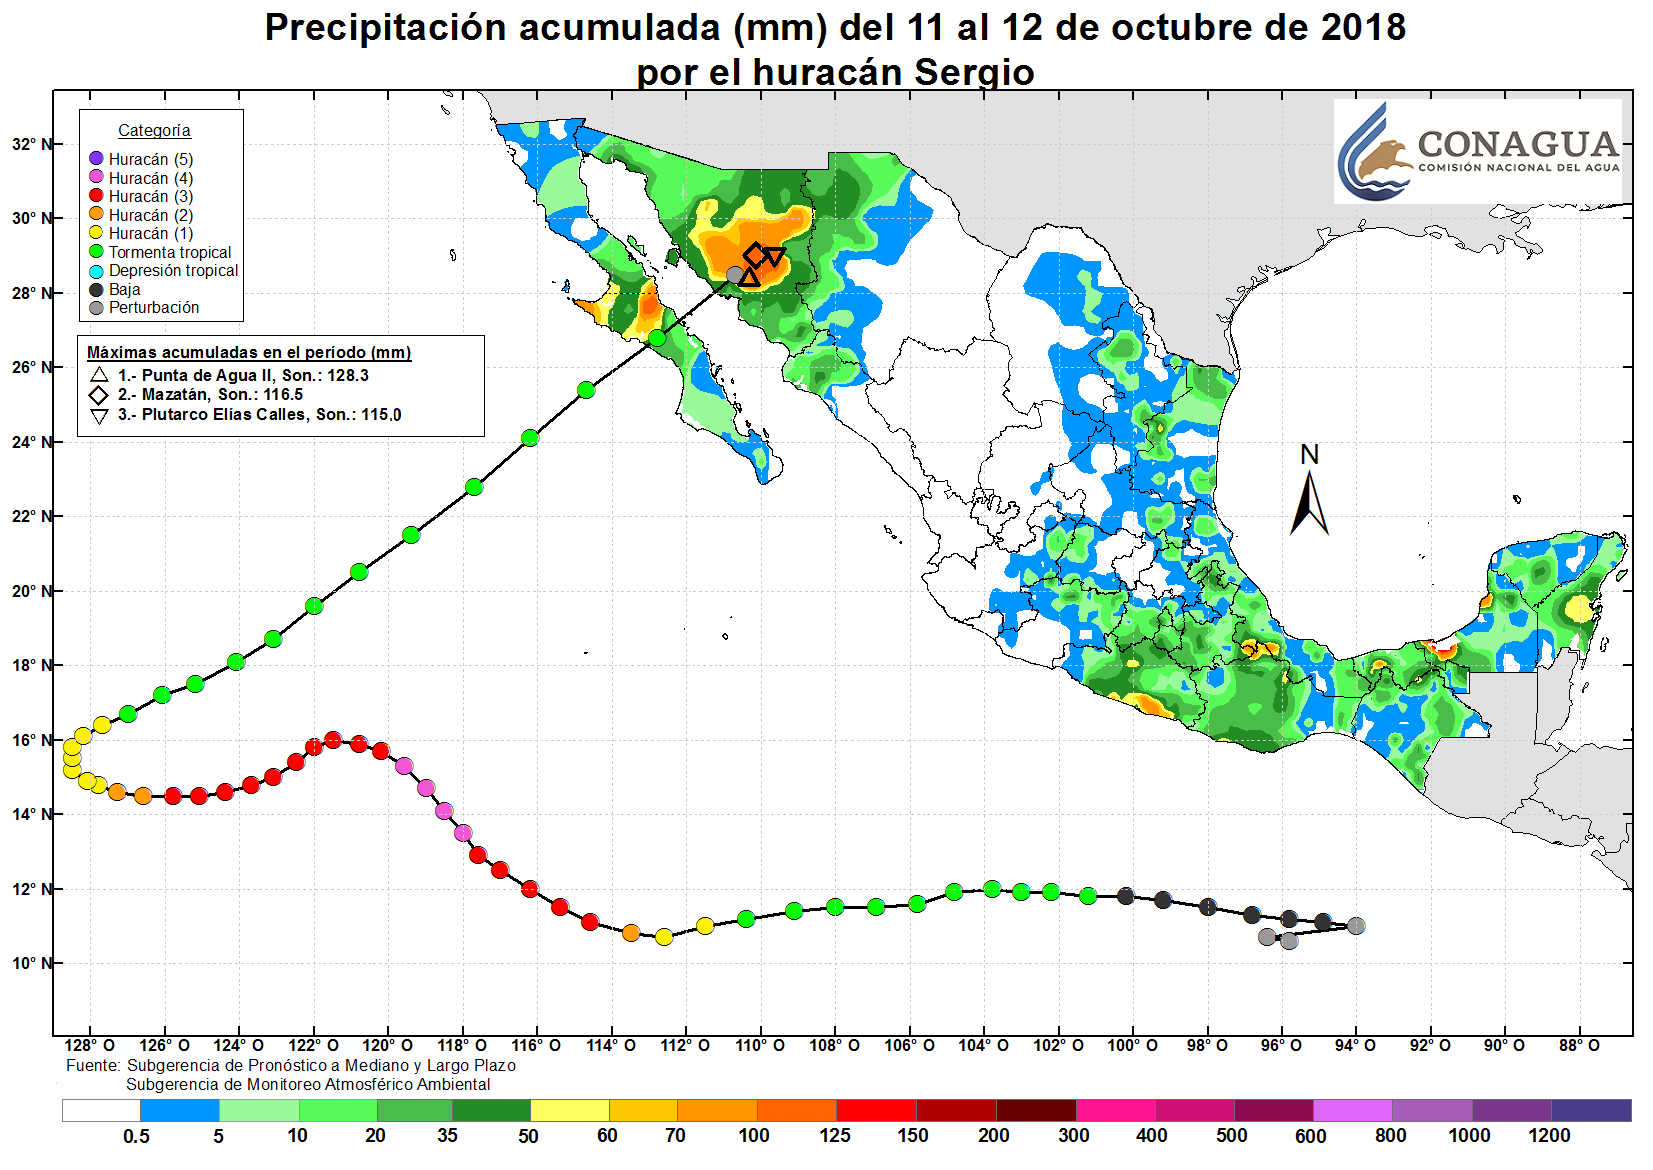
The Government of Mexico issued a tropical storm watch on October 10 along the western coast of the Baja California Peninsula from Punta Eugenia to Cabo San Lázaro and along the eastern coast from Bahia San Juan Bautista  [ sv ] to San Evaristo. As Sergio rapidly approached the peninsula on the next day, the tropical storm watch on the west coast was upgraded to a tropical storm warning, while the watches on the east coast were upgraded to warnings later in the day. All watches and warnings were discontinued as Sergio moved inland. [1] Civil protection agencies in Baja California, Baja California Sur, and Sonora issued yellow alerts, indicative of moderate danger, in anticipation of severe weather conditions. [17] Several municipalities around the landfall area in Sonora had orange alerts, which signaled high danger. [18] Plan DN-III-E and the Marine Plan were activated in advance for Baja California Sur, allowing the Mexican Army to help with disaster relief efforts and rescue operations. [17] A blue alert, meaning minimal danger, was issued for Sinaloa and emergency shelters were opened due to rainfall and Sergio's proximity. [19]

Sergio made landfall in western Baja California Sur and later in Sonora, [1] bringing heavy rains and strong winds to northern Mexico. [20] In Baja California Sur, Sergio's impact was mainly minimal, with homes experiencing power outages [1] and roof damage. [21] Multiple roads and schools in Loreto were damaged. In Sonora, almost 400 people had to evacuate to a temporary shelter as a result of flooding. [22] Strong winds up to 43 mph (70 km/h) downed trees, utility poles, and damaged homes and businesses in Guaymas, causing approximately MX$40 million (US$2.12 million) in damage [23] as well as several power outages. Hermosillo experienced street flooding which impeded traffic and overflowed sewers in several areas; multiple power outages also occurred. [24] [25] A concert scheduled to take place in the city was canceled in the interest of public safety. [26] In Punta de Aqua II, over 5.05 in (128 mm) of rain was reported. Mazatán and Plutarco Elías Calles reported rainfall totals of 4.59 in (117 mm) and 4.53 in (115 mm), respectively. [20] The Puerto Peñasco Municipality was impacted, causing flood damage to houses in the region. [27] More than 1,000 schools were closed in Chihuahua and classes in 72 municipalities of Sinaloa were suspended. [22] [28] In the Chihuahuan municipality of Nuevo Casas Grandes, heavy rainfall flooded streets and houses. [29] Throughout the state of Michoacán, the combined effects from Sergio and nearby Hurricane Rosa destroyed 86,000 acres (35,000 ha) of crops. [30]

United States

High waves from Sergio affected Hawaii and its remnants moved into Arizona, California and Texas, generating heavy rains and spawning multiple tornadoes. [14] [31] Sergio produced 10–15 feet (3.0–4.6 m) waves and rip currents along the shores of Hawaii's Big Island, Maui, Molokai, and Oahu on October 10. [32] As a result, high surf advisories were issued for east-facing shores. These swells gradually relaxed over the next couple of days. [33] No injuries or damage was reported in Hawaii. [32]

In Arizona, a Pacific upper-level low and remnant moisture from Sergio led to heavy rainfall; some areas in Phoenix recorded rainfall totals of 3 in (80 mm) and ankle-deep flooding. The Arizona State Fair was closed for the first time in "recent memory" due to flooding. [34] Damage on the fairgrounds and to the surrounding roads was estimated at US$50,000. [35] A portion of Old U.S. Route 80 was closed between Gila Bend and Buckeye after rainfall exceeding 1 in (25 mm) per hour caused flooding in the area. [36] Moderate to heavy rainfall in the deserts southeast of Phoenix caused flash flooding, halting traffic on State Route 187 between state routes 87 and 387. [37] Runoff from heavy rainfall in the Maricopa Mountains flowed across State Route 238, resulting in multiple closures from Mobile to Bosque and US$2,000 in damage. Numerous other road closures occurred throughout the Phoenix Metropolitan Area as a result of flash floods, damage in the region totaling approximately US$73,000. [38] Moisture from Sergio's remnants also entered Southern California, producing thunderstorms mainly to the south of Point Conception. [39] Widespread storms caused flash floods throughout the Coachella Valley, with a 12-hour rainfall total of 0.72 in (18 mm) observed at Palm Desert. [40] In nearby Indio, hail up to 1 in (25 mm) in diameter was reported. [41] Floodwaters up to 1.5 ft (0.46 m) deep were reported on a segment of Interstate 10 near Cactus City. [42] Multiple flood-related road closures also occurred near Rimlon and Thousand Palms. [43] [44] [45]

The remnants of Sergio moved through Texas from October 12–13, producing severe thunderstorms that caused US$475,000 in damage throughout the state. [46] About US$15,000 in damage was reported after 69 mph (111 km/h) wind gusts damaged a storage unit between Eureka and Mildred. [47] Wind gusts of 75 mph (121 km/h) caused about US$4,000 in damage to power lines and a carport near Greenwood. [48] Outside of Shiloh, 75 mph (121 km/h) wind gusts destroyed a metal barn and either damaged or destroyed multiple trees, resulting in US$5,000 in damage. [49] Wind gusts between 65–70 mph (105–113 km/h) were reported [lower-alpha 1] in numerous other counties. [50] There were also reports of hail in several counties. Just outside Baxter, hail 1.5 in (38 mm) in diameter fell on several properties, causing US$5,000 in damage. [51] Flash flooding affected the state, resulting in multiple road closures. In Wink, the intersection of State Highway 115 and Wildcat Drive was closed due to flooding. [52] Outside of Midland, State Highway 158 experienced flooding near Interstate 20. [53]

At least ten tornadoes spawned in Texas as a result of the increased moisture. [14] [54] An EF2 tornado near Knickerbocker extensively damaged a metal building and either uprooted or snapped many trees, causing US$200,000 in damage. [55] In Brady, an EF0 tornado uprooted one tree, which caused another to fall on a home, which triggered roof damage, resulting in US$150,000 in damage. [56] Approximately US$25,000 in damage occurred near Sardis when an EF0 tornado damaged a corner of a gymnasium, broke out windows on cars, bent down light-poles and handicap signs in a parking lot, and threw a trailer into a nearby field. [57] Two tornadoes occurred near Chat. The first was an EF0 tornado that damaged a few trees as well as shingles and fences at multiple homes, generating US$15,000 in damage. [58] The second was an EF1 tornado that substantially damaged one home, damaged the roof and deck of another, destroyed a shed, and tossed a boat and RV trailer, resulting in about US$50,000 in damage. [59] An EF0 tornado near Brandon caused about US$5,000 in tree damage. [60] At least four more EF0 tornadoes occurred: [lower-alpha 1] two in Navarro County, [61] [62] one in Freestone County, [63] and one in Panola County. [64]

See also

Notes

  1. A major hurricane is one that ranks at Category 3 or higher on the Saffir–Simpson scale. [2]
  2. All damage values are in 2018 USD unless otherwise stated.
  1. 1 2 No significant damage was reported.

Related Research Articles

<span class="mw-page-title-main">2008 Atlantic hurricane season</span> Hurricane season in the Atlantic Ocean

The 2008 Atlantic hurricane season was the most destructive Atlantic hurricane season since 2005, causing over 1,000 deaths and nearly $50 billion in damage. The season ranked as the third costliest ever at the time, but has since fallen to ninth costliest. It was an above-average season, featuring sixteen named storms, eight of which became hurricanes, and five which further became major hurricanes. It officially started on June 1 and ended on November 30. These dates conventionally delimit the period of each year when most tropical cyclones form in the Atlantic basin. However, the formation of Tropical Storm Arthur caused the season to start one day early. It was the only year on record in which a major hurricane existed in every month from July through November in the North Atlantic. Bertha became the longest-lived July tropical cyclone on record for the basin, the first of several long-lived systems during 2008.

<span class="mw-page-title-main">Tornado outbreak of April 30 – May 2, 1967</span>

A destructive severe weather episode affected portions of the Midwestern and Southern United States from April 30–May 2, 1967. It consisted of two consecutive tornado outbreaks that generated at least 38 tornadoes, causing 13 fatalities and 90 injuries. All of the deaths occurred on April 30, which is known as the 1967 Iowa–Minnesota tornado outbreak, or Black Sunday, to residents of Iowa and southern Minnesota. That day spawned a total of 21 tornadoes, devastating the towns of Albert Lea and Waseca, Minnesota.

On May 24–25, 1957, a tornado outbreak primarily affected the Western High Plains, Central Great Plains, and Central Oklahoma/Texas Plains of the United States. 45 tornadoes touched down over the area, most of which took place across northern and western Texas, in addition to southern Oklahoma. Overall activity initiated over eastern New Mexico and spread northeastward as far as southwestern Wisconsin. The strongest tornado, which occurred in southern Oklahoma on May 24, was assigned a rating of F4 near Lawton. Anomalously, some tornadoes touched down during the early morning hours, rather than late afternoon or early evening, when daytime heating typically peaks.

<span class="mw-page-title-main">Hurricane Rick (2009)</span> Category 5 Pacific hurricane in 2009

Hurricane Rick was the third-most intense Pacific hurricane on record and the second-most intense tropical cyclone worldwide in 2009, only behind Typhoon Nida. Developing off the southern coast of Mexico on October 15, Rick traversed an area with favorable environmental conditions, favoring rapid intensification, allowing it to become a hurricane within 24 hours of being declared a tropical depression. An eye began to form during the afternoon of October 16; once fully formed, the storm underwent another period of rapid strengthening. During the afternoon of October 17, the storm attained Category 5 status on the Saffir–Simpson hurricane wind scale. Several hours later, Rick attained its peak intensity as the third-strongest Pacific hurricane on record with winds of 180 mph (290 km/h) and a barometric pressure of 906 mbar.

<span class="mw-page-title-main">2015 Pacific hurricane season</span> Hurricane season in the Pacific Ocean

The 2015 Pacific hurricane season is the second-most active Pacific hurricane season on record, with 26 named storms, only behind the 1992 season. A record-tying 16 of those storms became hurricanes, and a record 11 storms further intensified into major hurricanes throughout the season. The Central Pacific, the portion of the Northeast Pacific Ocean between the International Date Line and the 140th meridian west, had its most active year on record, with 16 tropical cyclones forming in or entering the basin. Moreover, the season was the third-most active season in terms of accumulated cyclone energy, amassing a total of 290 units. The season officially started on May 15 in the Eastern Pacific and on June 1 in the Central Pacific; they both ended on November 30. These dates conventionally delimit the period of each year when most tropical cyclones form in the Northeast Pacific basin. However, the formation of tropical cyclones is possible at any time of the year. This was shown when a tropical depression formed on December 31. The above-average activity during the season was attributed in part to the very strong 2014–16 El Niño event.

<span class="mw-page-title-main">2019 Atlantic hurricane season</span> Hurricane season in the Atlantic Ocean

The 2019 Atlantic hurricane season was the fourth consecutive above-average and damaging season dating back to 2016. However, many were weak and short-lived, especially towards the end of the season. Six of those named storms achieved hurricane status, while three intensified into major hurricanes. Two storms became Category 5 hurricanes, marking the fourth consecutive season with at least one Category 5 hurricane, the third consecutive season to feature at least one storm making landfall at Category 5 intensity, and the seventh on record to have multiple tropical cyclones reaching Category 5 strength. The season officially began on June 1 and ended on November 30. These dates historically describe the period each year when most tropical cyclones form in the Atlantic basin and are adopted by convention. However, tropical cyclogenesis is possible at any time of the year, as demonstrated by the formation of Subtropical Storm Andrea on May 20, making this the fifth consecutive year in which a tropical or subtropical cyclone developed outside of the official season.

<span class="mw-page-title-main">2018 Pacific hurricane season</span> Hurricane season in the Pacific Ocean

The 2018 Pacific hurricane season was one of the most active Pacific hurricane seasons on record, producing the highest accumulated cyclone energy value on record in the basin. The season had the fourth-highest number of named storms – 23, tied with 1982. The season also featured eight landfalls, six of which occurred in Mexico. The season officially began on May 15 in the Eastern Pacific, and on June 1 in the Central Pacific; they both ended on November 30. These dates conventionally delimit the period of each year when most tropical cyclones form in the Pacific basin. However, tropical cyclone formation is possible at any time of the year, as illustrated when the first tropical depression formed on May 10, five days prior to the official start of the season.

<span class="mw-page-title-main">2019 Pacific hurricane season</span> Hurricane season in the Pacific Ocean

The 2019 Pacific hurricane season was a near average season which produced nineteen named storms, though most were rather weak and short-lived. Only seven hurricanes formed, the fewest since 2010. The season officially began on May 15 in the East Pacific Ocean, and on June 1 in the Central Pacific; they both ended on November 30. These dates conventionally delimit the period of each year when most tropical cyclones form in the Pacific basin. This season was one of the latest-starting Pacific hurricane seasons on record, with the first tropical cyclone, Hurricane Alvin, forming on June 25. The final system, Tropical Depression Twenty-One-E, dissipated on November 18.

<span class="mw-page-title-main">Tornadoes of 2018</span>

This page documents notable tornadoes and tornado outbreaks worldwide in 2018. Strong and destructive tornadoes form most frequently in the United States, Brazil, Bangladesh and Eastern India, but they can occur almost anywhere under the right conditions. Tornadoes also develop occasionally in southern Canada during the Northern Hemisphere's summer and somewhat regularly at other times of the year across Europe, Asia, Argentina and Australia. Tornadic events are often accompanied with other forms of severe weather, including strong thunderstorms, strong winds, and hail.

<span class="mw-page-title-main">Hurricane Bud (2018)</span> Category 4 Pacific hurricane in 2018

Hurricane Bud was a Category 4 hurricane that brought winds and severe flooding to Mexico throughout its existence as a tropical cyclone in June 2018. It was the second named storm, hurricane, and major hurricane of the 2018 Pacific hurricane season. Bud originated from a tropical wave that departed from Western Africa on May 29. It traveled across the Atlantic Ocean before entering the Northeast Pacific Ocean late on June 6. The system moved towards the northwest and steadily organized, becoming a tropical depression on June 9 and Tropical Storm Bud early the next day. Favorable upper-level winds, ample moisture aloft, and warm sea surface temperatures allowed the storm to rapidly intensify to a hurricane late on June 10, and further to a major hurricane on the following day. Bud ultimately peaked the next morning with maximum sustained winds of 140 mph (230 km/h) and a minimum central pressure of 943 mbar. Its track curved more northward while the storm rapidly succumbed to the effects of upwelling. Bud made landfall on Baja California Sur as a minimal tropical storm early on June 15. On the next day, land interaction and increasing wind shear caused Bud to degenerate into a post-tropical cyclone. It opened up into a trough of low-pressure on June 16. The remnants of Bud moved towards the Southwestern United States, bringing tropical moisture and gusty winds to the region.

<span class="mw-page-title-main">Tropical Storm Gordon (2018)</span> Atlantic tropical storm in 2018

Tropical Storm Gordon was a strong tropical storm that caused damage along the Gulf Coast of the United States in early September 2018. The seventh named storm of the 2018 Atlantic hurricane season, Gordon developed from a tropical wave that was first monitored in the Caribbean Sea on August 30. The wave moved west-northwestward toward the east coast of Florida while gradually organizing. The disturbance was marked as Potential Tropical Cyclone Seven on September 2 while near the Bahamas, and early the next day, it became Tropical Storm Gordon. The system made landfall on the southwest coast of Florida shortly afterwards. Steady intensification began after it moved off the coast of Florida and into the Gulf of Mexico. Gordon reached its peak intensity as a high-end tropical storm late on September 4 before making landfall just east of Pascagoula, Mississippi shortly afterwards. Gordon then rapidly weakened as it tracked inland, and degenerated into a remnant low on September 6. Gordon's remnants lingered over Arkansas for two days, before opening up into a low-pressure trough on September 8. At least three deaths were attributed to the storm, and Gordon caused approximately $200–250 million in damages.

<span class="mw-page-title-main">Tropical Depression Nineteen-E (2018)</span> Pacific tropical depression in 2018

Tropical Depression Nineteen-E was a weak yet costly tropical cyclone that caused significant flooding throughout Northwestern Mexico and several states within the United States in September 2018. The storm was also the first known tropical cyclone to form over the Gulf of California. Nineteen-E originated from a tropical wave that left the west coast of Africa on August 29 to 30. It continued westward, crossed over Central America, and entered the northeastern Pacific Ocean by September 7. It then meandered to the southwest of Mexico for the next several days as it interacted with a mid-to-upper level trough. The National Hurricane Center (NHC) continued to track the disturbance for the next several days as it traveled northward. A surface trough developed over the Baja California peninsula on September 18. Despite disorganization and having close proximity to land, the disturbance developed into a tropical depression in the Gulf of California on September 19, after having developed a circulation center and more concentrated convection. The system peaked with maximum sustained winds of 35 mph (55 km/h) and a minimum central pressure of 1002 mbar.

<span class="mw-page-title-main">Hurricane Rosa (2018)</span> Category 4 Pacific hurricane

Hurricane Rosa brought widespread flooding to northwestern Mexico and the Southwestern United States in late September 2018, and was the first tropical cyclone to make landfall in Baja California since Nora in 1997. The seventeenth named storm, tenth hurricane, and seventh major hurricane of the 2018 Pacific hurricane season; Rosa originated from an Atlantic tropical wave that crossed the West African coast on September 6. The wave proceeded westward across the Atlantic, traversing Central America before entering the Gulf of Tehuantepec on September 22. There, the weather system acquired cyclonic features and became a tropical storm on September 25. Within a favorable atmosphere, Rosa entered a period of rapid intensification on September 27, peaking as a Category 4 hurricane with maximum sustained winds of 150 mph (240 km/h) a day later. Over the next few days, Rosa turned north and then northeast while steadily weakening, making landfall in Baja California as a tropical depression on October 2. After crossing over into the Gulf of California, the remnant system split apart and merged with an upper-level low off the coast of California by October 3.

<span class="mw-page-title-main">Hurricane Barry (2019)</span> Category 1 Atlantic hurricane in 2019

Hurricane Barry was an asymmetrical Category 1 hurricane that was the wettest tropical cyclone on record in Arkansas and the fourth-wettest in Louisiana. The second tropical or subtropical storm and first hurricane of the 2019 Atlantic hurricane season, Barry originated as a mesoscale convective vortex over southwestern Kansas on July 2. The system eventually emerged into the Gulf of Mexico from the Florida Panhandle on July 10, whereupon the National Hurricane Center (NHC) designated it as a potential tropical cyclone. Early on July 11, the system developed into a tropical depression, and strengthened into a tropical storm later that day. Dry air and wind shear caused most of the convection, or thunderstorms, to be displaced south of the center. Nevertheless, Barry gradually intensified. On July 13, Barry attained its peak intensity as Category 1 hurricane with 1-minute sustained winds of 75 mph (120 km/h) and a minimum central pressure of 993 millibars (29.3 inHg). At 15:00 UTC, Barry made its first landfall at Marsh Island, and another landfall in Intracoastal City, Louisiana, both times as a Category 1 hurricane. Barry quickly weakened after landfall, falling to tropical depression status on July 15. The storm finally degenerated into a remnant low over northern Arkansas on the same day, subsequently opening up into a trough on July 16. The storm's remnants persisted for another few days, while continuing its eastward motion, before being absorbed into another frontal storm to the south of Nova Scotia on July 19.

<span class="mw-page-title-main">Hurricane Lorena (2019)</span> Category 1 Pacific hurricane in 2019

Hurricane Lorena was a strong Pacific hurricane in September 2019 that brought heavy rainfall, flooding, and mudslides to Southwestern Mexico and the Baja California Peninsula and also brought severe weather to the U.S. state of Arizona. Lorena was the thirteenth named storm and seventh and final hurricane of the 2019 Pacific hurricane season. A tropical wave, originally from the North Atlantic, entered the East Pacific basin on September 16. With increasing thunderstorm development, Lorena formed as a tropical storm on September 17 alongside Tropical Storm Mario. Lorena made its passage northwestward and quickly gained strength before it made landfall as a Category 1 hurricane in Jalisco on September 19. Due to interaction with the mountainous terrain, Lorena weakened back to a tropical storm. After moving into the warm ocean temperatures of the Gulf of California, however, Lorena re-strengthened into a hurricane, and reached its peak intensity with 1-minute sustained winds of 85 mph (137 km/h) and a minimum barometric pressure of 985 millibars (29.1 inHg) Lorena made a second landfall in the Mexican state of Baja California Sur, and quickly weakened thereafter. Lorena weakened to a tropical storm over the Gulf of California, and became a remnant low on September 22, shortly after making landfall in Sonora as a tropical depression. The remnant low moved inland over Mexico, and eventually dissipated inland over Arizona on September 24.

<span class="mw-page-title-main">Hurricane Dolores (2015)</span> Category 4 Pacific hurricane in 2015

Hurricane Dolores was a powerful and moderately damaging tropical cyclone whose remnants brought record-breaking heavy rains and strong winds to California. The seventh named storm, fourth hurricane, and third major hurricane of the record-breaking 2015 Pacific hurricane season, Dolores formed from a tropical wave on July 11. The system gradually strengthened, attaining hurricane status on July 13. Dolores rapidly intensified as it neared the Baja California peninsula, finally peaking as a Category 4 hurricane on the Saffir–Simpson scale with winds of 130 mph (215 km/h) on July 15. An eyewall replacement cycle began and cooler sea-surface temperatures rapidly weakened the hurricane, and Dolores weakened to a tropical storm two days later. On July 18, Dolores degenerated into a remnant low west of the Baja California peninsula.

<span class="mw-page-title-main">Weather of 2021</span>

The following is a list of weather events that occurred in 2021. The year began with La Niña conditions. There were several natural disasters around the world from various types of weather, including blizzards, cold waves, droughts, heat waves, tornadoes, and tropical cyclones. In December, powerful Typhoon Rai moved through the southern Philippines, killing 410 people and becoming the deadliest single weather event of the year. The costliest event of the year, and the costliest natural disaster on record in the United States, was from a North American cold wave in February 2021, which caused $196.4 billion (USD) in damage; the freezing temperatures and widespread power outages in Texas killed hundreds of people. Another significant natural disaster was Hurricane Ida, which struck southeastern Louisiana and later flooded the Northeastern United States, resulting in $70 billion (USD) in damage. December saw two record-breaking tornado outbreaks, only four days apart from each other. In Europe, the European Severe Storms Laboratory documented 1,482 weather-related injuries and 568 weather-related fatalities. The National Oceanic and Atmospheric Administration documented 796 weather-related fatalities and at least 1,327 weather-related injuries in the United States and the territories of the United States.

The following is a list of weather events that occurred in 2018.

References

  1. 1 2 3 4 5 6 7 8 9 10 11 12 13 14 15 16 Blake, Eric S. (February 26, 2019). Tropical Cyclone Report: Hurricane Sergio (PDF) (Report). National Hurricane Center. Archived (PDF) from the original on March 6, 2019. Retrieved March 4, 2019.
  2. "Saffir-Simpson Hurricane Wind Scale". National Hurricane Center. Archived from the original on June 20, 2020. Retrieved June 22, 2020.
  3. Zelinsky, David (September 26, 2018). Tropical Weather Outlook [500 PM PDT, Tue Sep 25, 2018] (Report). NHC Graphical Outlook Archive. National Hurricane Center. Archived from the original on October 8, 2018. Retrieved October 6, 2018.
  4. Roberts, Dave (September 26, 2018). Tropical Weather Outlook [500 AM PDT, Wed Sep 26, 2018] (Report). NHC Graphical Outlook Archive. National Hurricane Center. Archived from the original on October 8, 2018. Retrieved October 6, 2018.
  5. Stewart, Stacy (September 29, 2018). Tropical Weather Outlook [1100 PM PDT, Fri Sep 28, 2018] (Report). NHC Graphical Outlook Archive. National Hurricane Center. Archived from the original on October 8, 2018. Retrieved October 7, 2018.
  6. Beven, Jack (September 29, 2018). Tropical Storm Sergio Special Advisory Number 1 (Report). National Hurricane Center. Archived from the original on October 2, 2019. Retrieved October 7, 2018.
  7. Beven, Jack (September 29, 2018). Tropical Storm Sergio Discussion Number 2 (Report). National Hurricane Center. Archived from the original on October 2, 2019. Retrieved October 7, 2018.
  8. Beven, Jack (October 2, 2018). Hurricane Sergio Discussion Number 11 (Report). National Hurricane Center. Archived from the original on October 2, 2019. Retrieved October 7, 2018.
  9. Brown, Daniel (October 3, 2018). Hurricane Sergio Discussion Number 17 (Report). National Hurricane Center. Archived from the original on October 2, 2019. Retrieved October 7, 2018.
  10. Blake, Eric (October 4, 2018). Hurricane Sergio Discussion Number 19 (Report). National Hurricane Center. Archived from the original on October 2, 2019. Retrieved October 7, 2018.
  11. Brennan, Michael (October 5, 2018). Hurricane Sergio Discussion Number 23 (Report). National Hurricane Center. Archived from the original on October 2, 2019. Retrieved October 7, 2018.
  12. Stewart, Stacy (October 7, 2018). Hurricane Sergio Discussion Number 31 (Report). National Hurricane Center. Archived from the original on October 2, 2019. Retrieved October 7, 2018.
  13. Zelinsky, David (October 7, 2018). Hurricane Sergio Discussion Number 33 (Report). National Hurricane Center. Archived from the original on October 2, 2019. Retrieved October 8, 2018.
  14. 1 2 3 "Remnant of Former Hurricane Sergio Triggered Flooding Rain, Some Tornadoes in the Southern Plains". The Weather Channel. Archived from the original on December 25, 2019. Retrieved November 25, 2018.
  15. Combot, Clement; Quilfen, Yves; Mouche, Alexis; Gourrion, Jerome; de Boyer Montegut, Clement; Chapron, Bertrand; Tournadre, Jean (2020). "Space-based observations of surface signatures in the wakes of the 2018 Eastern Pacific tropical cyclones" (PDF). Journal of Operational Oceanography. Copernicus Marine Service. 13 (4). doi:10.1080/1755876X.2020.1785097. S2CID   222073829. Archived (PDF) from the original on January 15, 2022. Retrieved January 22, 2022.
  16. Rodríguez Castañeda, José Luis; Lagunes, Alejandro Jiménez; Murillo, Ricardo Sánchez; Adams, David; Quezadas, Juan Pérez (January 2021). "Isotopic variability (δ18O, δ2H and d-excess) during rainfall events of the north American monsoon across the Sonora River Basin, Mexico". Journal of South American Earth Sciences. Science Direct. 105: 6. Bibcode:2021JSAES.10502928Q. doi:10.1016/j.jsames.2020.102928. S2CID   225139701. Archived from the original on December 11, 2021. Retrieved December 28, 2021.
  17. 1 2 "Lluvia afectara 24 estados por la tormenta tropical "Sergio"". El Universal (in Spanish). October 12, 2018. Archived from the original on July 24, 2019. Retrieved July 24, 2019.
  18. "El huracán Sergio se convierte en baja presión y afecta a Sonora". Diario de Yucatán (in Spanish). October 12, 2018. Archived from the original on July 31, 2019. Retrieved July 31, 2019.
  19. "Alerta Azul en Sinaloa por tormenta tropical Sergio". MSN Noticias (in Spanish). Microsoft News. October 10, 2018. Archived from the original on July 27, 2019. Retrieved July 27, 2019.
  20. 1 2 "Precipitación acumulada (mm) del 11 al 12 de octubre de 2018 por el huracan Sergio" (Map). gob.mx (in Spanish). Conagua. Archived from the original on August 19, 2020. Retrieved March 12, 2019.
  21. "Sergio se degrada a depresión tropical sobre Sonora". Expansion (in Spanish). CNN. October 12, 2018. Archived from the original on August 13, 2019. Retrieved August 13, 2019.
  22. 1 2 "Four northern states feel the effects of Tropical Storm Sergio". Mexico News Daily. October 13, 2018. Archived from the original on March 29, 2019. Retrieved October 17, 2018.
  23. Ojeda, Yesicka (October 17, 2018). "Pedirán recursos al Fonden tras daños que causó "Sergio"". El Imparcial (in Spanish). Archived from the original on October 23, 2018. Retrieved October 23, 2018.
  24. "Deja "Sergio" inundaciones en Guaymas y Hermosillo". El Imparcial. October 12, 2018. Archived from the original on July 29, 2019. Retrieved July 29, 2019.
  25. Paredes, Olivia (October 12, 2018). "Estas vialidades son las más afectadas por "Sergio" en Hermosillo". El Imparcial. Archived from the original on July 29, 2019. Retrieved July 29, 2019.
  26. "Luis Coronel y Cornelio Vega víctimas del huracán 'Sergio'". Ke Buena. October 12, 2018. Archived from the original on August 17, 2019. Retrieved July 31, 2019.
  27. Ruiz, Rubén A. (October 13, 2018). "Solicitan declarar a Puerto Peñasco como zona de desastre". El Imparcial. Archived from the original on July 28, 2019. Retrieved July 28, 2019.
  28. "Sergio ingresa a Sonora como depresión tropical". El Sol de Mexico (in Spanish). October 12, 2018. Archived from the original on July 24, 2019. Retrieved July 24, 2019.
  29. "Decenas de damnificados en NCG por lluvias que generó "Sergio"" (in Spanish). Puente Libre.mx. October 13, 2018. Archived from the original on July 31, 2019. Retrieved July 31, 2019.
  30. "Al menos 35.000 hectáreas de cultivo afectadas en México por fuertes lluvias". NTN 24 (in Spanish). September 30, 2018. Archived from the original on June 5, 2019. Retrieved June 5, 2019.
  31. Don (October 17, 2018). "Deadly floods hit Texas after extreme rainfall, state of emergency declared". The Watchers. Archived from the original on March 29, 2019. Retrieved November 29, 2018.
  32. 1 2 Event: High Surf in Hawaii [2018-10-10 09:00 HST-10] (Report). Storm Events Database. National Centers for Environmental Information. Archived from the original on April 13, 2020. Retrieved August 11, 2019.
  33. "October 10, 2018 Surf Forecast". Big Island Now. October 10, 2018. Archived from the original on August 15, 2019. Retrieved August 15, 2019.
  34. Cruz, Mike (October 13, 2018). "A first time for everything. Hurricane Sergio heavy rainfall, flooding close Arizona State Fair". Arizona Republic. Archived from the original on January 22, 2022. Retrieved October 17, 2018.
  35. Event: Flash Flood in Maricopa, AZ [2018-10-13 12:50 MST-7] (Report). Storm Events Database. National Centers for Environmental Information. Archived from the original on April 14, 2020. Retrieved July 22, 2019.
  36. Event: Flash Flood in Maricopa, AZ [2018-10-13 11:00 MST-7] (Report). Storm Events Database. National Centers for Environmental Information. Archived from the original on April 14, 2020. Retrieved July 22, 2019.
  37. Event: Flash Flood in Pinal, AZ [2018-10-13 09:00 MST-7] (Report). Storm Events Database. National Centers for Environmental Information. Archived from the original on April 14, 2020. Retrieved July 22, 2019.
  38. Event: Flash Flood in Maricopa, AZ [2018-10-13 08:30 MST-7] (Report). Storm Events Database. National Centers for Environmental Information. Archived from the original on April 13, 2020. Retrieved July 19, 2019.
  39. Area Forecast Discussion [1056 PM PDT Fri Oct 12 2018] (Report). National Weather Service Los Angeles/Oxnard CA. October 12, 2018. Archived from the original on April 13, 2020. Retrieved July 18, 2019.
  40. Event: Heavy Rain in Riverside, CA [2018-10-12 21:00 PST-8] (Report). Storm Events Database. National Centers for Environmental Information. Archived from the original on April 13, 2020. Retrieved July 19, 2019.
  41. Event: Hail in Indio, CA [2018-10-12 22:00 PST-8] (Report). Storm Events Database. National Centers for Environmental Information. Archived from the original on April 13, 2020. Retrieved July 19, 2019.
  42. Event: Flash Flood in Riverside, CA [2018-10-12 23:30 PST-8] (Report). National Centers for Environmental Information. Archived from the original on April 13, 2020. Retrieved July 19, 2019.
  43. Event: Flash Flood in Riverside, CA [2018-10-13 00:00 PST-8] (Report). Storm Events Database. National Centers for Environmental Information. Archived from the original on April 13, 2020. Retrieved July 19, 2019.
  44. Event: Flash Flood in Riverside, CA [2018-10-13 00:30 PST-8] (Report). Storm Events Database. National Centers for Environmental Information. Archived from the original on April 13, 2020. Retrieved July 19, 2019.
  45. Event: Flash Flood in Riverside, CA [2018-10-13 00:30 PST-8] (Report). Storm Events Database. National Centers for Environmental Information. Archived from the original on April 13, 2020. Retrieved July 19, 2019.
  46. Floyd, Caroline (October 16, 2018). "Stunning video shows bridge washed away in Texas flood". The Weather Network. Archived from the original on July 19, 2019. Retrieved October 20, 2018.
  47. Event: Thunderstorm Wind in Navarro, TX [2018-10-13 13:13 CST-6] (Report). Storm Events Database. National Centers for Environmental Information. Archived from the original on April 13, 2020. Retrieved July 23, 2019.
  48. Event: Thunderstorm Wind in Midland, TX [2018-10-13 03:05 CST-6] (Report). Storm Events Database. National Centers for Environmental Information. Archived from the original on April 13, 2020. Retrieved July 23, 2019.
  49. Event: Thunderstorm Wind in Limestone, TX [2018-10-13 14:24 CST-6] (Report). Storm Events Database. National Centers for Environmental Information. Archived from the original on April 14, 2020. Retrieved July 23, 2019.
  50. Event: Thunderstorm Wind in Nacogdoches, TX [2018-10-13 18:35 CST-6] (Report). Storm Events Database. National Centers for Environmental Information. Archived from the original on April 14, 2020. Retrieved July 23, 2019.
  51. Event: Hail in Henderson, TX [2018-10-13 14:10 CST-6] (Report). Storm Events Database. National Centers for Environmental Information. Archived from the original on April 13, 2020. Retrieved July 23, 2019.
  52. Event: Flash Flood in Winkler, TX [2018-10-13 02:00 CST-6] (Report). Storm Events Database. National Centers for Environmental Information. Archived from the original on April 13, 2020. Retrieved July 23, 2019.
  53. Event: Flash Flood in Midland, TX [2018-10-13 05:30 CST-6] (Report). Storm Events Database. National Centers for Environmental Information. Archived from the original on April 13, 2020. Retrieved July 23, 2019.
  54. Mitchell, Chaffin (October 14, 2018). "Tornadoes reported in Texas as storms push through, causing damage". AccuWeather. Archived from the original on July 23, 2019. Retrieved July 23, 2019.
  55. Event: Tornado in Tom Green, TX [2018-10-13 05:56 CST-6] (Report). Storm Events Database. National Centers for Environmental Information. Archived from the original on July 3, 2019. Retrieved July 23, 2019.
  56. Event: Tornado in McColloch, TX [2018-10-13 09:17 CST-6] (Report). Storm Events Database. National Centers for Environmental Information. Archived from the original on April 13, 2020. Retrieved July 23, 2019.
  57. Event: Tornado in Ellis, TX [2018-10-13 11:47 CST-6] (Report). Storm Events Database. National Centers for Environmental Information. Archived from the original on April 13, 2020. Retrieved July 23, 2019.
  58. Event: Tornado in Hill, TX [2018-10-13 11:52 CST-6] (Report). Storm Events Database. National Centers for Environmental Information. Archived from the original on April 13, 2020. Retrieved July 23, 2019.
  59. Event: Tornado in Hill, TX [2018-10-13 12:02 CST-6] (Report). Storm Events Database. National Centers for Environmental Information. Archived from the original on April 13, 2020. Retrieved July 23, 2019.
  60. Event: Tornado in Hill, TX [2018-10-13 12:13 CST-6] (Report). Storm Events Database. National Centers for Environmental Information. Archived from the original on April 13, 2020. Retrieved July 23, 2019.
  61. Event: Tornado in Navarro, TX [2018-10-13 13:13 CST-6] (Report). Storm Events Database. National Centers for Environmental Information. Archived from the original on April 13, 2020. Retrieved July 23, 2019.
  62. Event: Tornado in Navarro, TX [2018-10-13 12:50 CST-6] (Report). Storm Events Database. National Centers for Environmental Information. Archived from the original on April 13, 2020. Retrieved July 23, 2019.
  63. Event: Tornado in Freestone, TX [2018-10-13 15:03 CST-6] (Report). Storm Events Database. National Centers for Environmental Information. Archived from the original on April 13, 2020. Retrieved July 23, 2019.
  64. Event: Tornado in Panola, TX [2018-10-13 16:19 CST-6] (Report). Storm Events Database. National Centers for Environmental Information. Archived from the original on April 13, 2020. Retrieved July 23, 2019.
Hurricane Sergio
Sergio 2018-10-04 2040Z.jpg
Hurricane Sergio shortly after peak intensity on October 4

PD-icon.svg This article incorporates public domain material from websites or documents of the National Weather Service .