2008 Pacific hurricane season

Last updated

2008 Pacific hurricane season
2008 Pacific hurricane season summary map.png
Season summary map
Seasonal boundaries
First system formedMay 29, 2008
Last system dissipatedNovember 5, 2008
Strongest storm
Name Norbert
  Maximum winds130 mph (215 km/h)
(1-minute sustained)
  Lowest pressure945 mbar (hPa; 27.91 inHg)
Seasonal statistics
Total depressions19
Total storms17
Hurricanes7
Major hurricanes
(Cat. 3+)
2
Total fatalities46 total
Total damage$152.2 million (2008 USD)
Related articles
Pacific hurricane seasons
2006, 2007, 2008, 2009, 2010

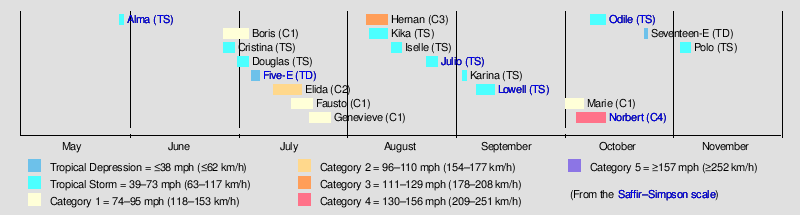
The 2008 Pacific hurricane season was a near-average Pacific hurricane season which featured seventeen named storms, though most were rather weak and short-lived. Only seven storms became hurricanes, of which two intensified into major hurricanes. This season was also the first since 1996 to have no cyclones cross into the central Pacific (between 140°W to the International Date Line). [1] The season officially began on May 15 in the eastern Pacific (east of 140°W) and on June 1 in the central Pacific. It ended in both regions on November 30. These dates, adopted by convention, historically describe the period in each year when most tropical cyclone formation occurs in these regions of the Pacific. This season, the first system, Tropical Storm Alma, formed on May 29, and the last, Tropical Storm Polo, dissipated on November 5.

Contents

During the season, 4 eastern Pacific systems (Julio, Karina, Lowell, and Marie) developed, at least in part, from tropical waves that had already produced named storms in the Atlantic basin. [2] Several storms affected land this year. Alma made landfall along the Pacific coast of Nicaragua, becoming the first known storm to do so. It killed 9 and caused over US$35 million in damage (value in 2008). Hurricane Norbert became the strongest hurricane to hit the western side of the Baja Peninsula on record, killing 25 and causing widespread damage over Baja California Sur, Sonora, and Sinaloa in Mexico. Tropical Depression Five-E made landfall along the south-western Mexican coastline in July 2008, producing heavy rainfall in parts of southwestern Mexico, which these rains triggered flooding that killed two people and left roughly $2.2 million in damages. Julio produced lightning and locally heavy rainfall, which left more than a dozen communities isolated due to flooding. The flooding damaged several houses and killed two people. Lowell left $15.5 million in damage as it made landfall in Baja California Peninsula as a tropical depression, and affected parts of West Coast and the Gulf Coast. Odile dumped squally rainfall on Central America as a tropical wave, while it brought heavy rainfall across southern Mexico.

Seasonal forecasts

Predictions of tropical activity in the 2007 season
SourceDateNamed
storms
HurricanesMajor
hurricanes
Ref
Average (1971–2005)14.58.44.3 [3]
Record high activity 27 16 11 [4]
Record low activity 8 3 0 [4]

SMN May 16, 20081572 [5]
CPC May 22, 200811–165–81–3 [6]

Actual activity
1772

On May 16, 2008, the Servicio Meteorológico Nacional posted their outlook for the 2008 Pacific hurricane season, forecasting 15 named storms, 7 hurricanes, and 2 major hurricanes. [5] Three days later, the National Oceanic and Atmospheric Administration's Central Pacific Hurricane Center released their forecast for the central Pacific, predicting three or four tropical cyclones to form or cross into the basin; an average season sees four or five tropical cyclones, of which two further intensify into hurricanes. [7] On May 22, meanwhile, the Climate Prediction Center released their outlook, forecasting a 70 percent probability of a below-average year, a 25 percent chance of a near-average year, and only a 5 percent chance of an above-average year. The organization predicted 11–16 named storms, 5–8 hurricanes, 1–3 major hurricanes, and an accumulated cyclone energy (ACE) index 40–100 percent of the long-term median. All three groups cited the effects of the ongoing La Niña, as well as the continuation of a multi-decadal decline in Pacific hurricane activity, as their reasoning behind the below-average forecasts. [6]

Seasonal summary

Tropical Storm Odile (2008)Hurricane Norbert (2008)Tropical Storm Lowell (2008)Tropical Storm Julio (2008)Tropical Depression Five-E (2008)Tropical Storm AlmaSaffir–Simpson scale2008 Pacific hurricane season

The accumulated cyclone energy (ACE) index for the 2008 Pacific hurricane season as calculated by Colorado State University using data from the National Hurricane Center was 83.8 units. [nb 1] [8] Broadly speaking, ACE is a measure of the power of a tropical or subtropical storm multiplied by the length of time it existed. It is only calculated for full advisories on specific tropical and subtropical systems reaching or exceeding wind speeds of 39 mph (63 km/h).

The activity of the season was relatively quiet overall, with 16 named storms, 7 hurricanes, 2 major hurricanes; 1 tropical storm formed in the Central Pacific. The main contributing factor to a slower season was the 2007–08 La Niña event in the equatorial Pacific; although cold ocean temperature anomalies dissipated during the early summer of 2008, a La Niña-like atmospheric circulation persisted. This led to anomalously strong easterly wind shear across the East Pacific, hindering the intensification of most tropical cyclones. In addition, water temperatures across the basin were cooler than in years past, though still near the long-term average.

The first storm of the year, Alma, developed on May 29 farther east than any other Eastern Pacific cyclone on record, excluding Atlantic systems that crossed over into the basin. Later that day, it made landfall on the Pacific coast of Central America, the first cyclone to do so since the 1949 Texas hurricane. June and July saw near average tropical cyclone activity, while August was a below-average month overall. September 2008 was the quietest since reliable records began in 1971, with a monthly ACE index only 9 percent of average. In terms of ACE, seasonal activity ended about 75 percent of the long-term median. [2]

Systems

Tropical Storm Alma

Tropical storm (SSHWS)
Alma 2008-05-29 1635Z.jpg   Alma 2008 track.png
DurationMay 29 – May 30
Peak intensity65 mph (100 km/h) (1-min);
994  mbar  (hPa)

A nearly stationary trough of low pressure formed over the extreme eastern Pacific in late May, and the system organized into a tropical depression around 00:00 UTC on May 29, becoming the easternmost-forming tropical cyclone on record in the basin. The newly formed system intensified into a tropical storm six hours later, earning the name Alma, and attained peak winds of 65 mph (105 km/h) around 18:00 UTC as an eye-like feature became apparent on satellite. Moving northward, Alma made landfall near León, Nicaragua, at that strength before rapidly weakening inland. Its low-level circulation dissipated over the mountains of western Honduras around 18:00 UTC on May 30, but remnant convective activity aided in the formation of Tropical Storm Arthur in the western Caribbean a day later. [9]

Alma produced devastating rainfall across Central America, with peak accumulations of 14.82 in (376.4 mm) in Quepos, Costa Rica. The nearby cities of Guanacaste and Puntarenas were most heavily affected with over 1,000 homes damaged, of which over 150 were destroyed. Throughout all of Costa Rica, more than 100 roads and bridges were damaged, leaving several communities isolated for several days. In Nicaragua, the departments of León and Chinandega saw approximately 200 homes damaged; across Honduras, an additional 175 homes were adversely impacted. Six people died in Honduras: a young girl who was swept away by a fast-moving river and five people who perished following the crash of TACA Flight 390. Two more deaths occurred in Nicaragua due to electrocutions from downed power lines, and one death occurred offshore when a fishing vessel sank. Nine people on boats went missing in the wake of the cyclone. [9]

Hurricane Boris

Category 1 hurricane (SSHWS)
Hurricane Boris 2008 July 1st.jpg   Boris 2008 track.png
DurationJune 27 – July 4
Peak intensity80 mph (130 km/h) (1-min);
985  mbar  (hPa)

A westward-moving tropical wave departed the western coast of Africa on June 14 and entered the eastern Pacific a week later. A broad surface low formed in association with the feature south of the Gulf of Tehuantepec on June 23, and its organization led to the development of a tropical depression around 06:00 UTC on June 27. The cyclone only slowly organized in a moderate wind shear regime, becoming Tropical Storm Boris six hours later and remaining fairly steady state for a few days thereafter. Shear lessened on June 29, allowing Boris to attain hurricane intensity two days later as an eye developed. This feature was temporarily eroded late on July 1, but reappeared by 06:00 UTC on July 2 when the cyclone attained peak winds of 80 mph (130 km/h). Cold waters and a more stable environment then prompted rapid weakening, and Boris ultimately degenerated to a remnant low by 12:00 UTC on July 4. The post-tropical cyclone continued westward until dissipating early on July 6. [10]

Tropical Storm Cristina

Tropical storm (SSHWS)
Cristina 28 jun 2008 2130Z.jpg   Cristina 2008 track.png
DurationJune 27 – June 30
Peak intensity50 mph (85 km/h) (1-min);
999  mbar  (hPa)

The season's third tropical depression developed around 18:00 UTC on June 27 from a tropical wave that crossed Central America four days prior. In an environment of low shear but abundant dry air and marginal ocean temperatures, the depression intensified into Tropical Storm Cristina around 12:00 UTC on June 28 before attaining peak winds of 50 mph (80 km/h) six hours later. The cyclone moved west-northwest and then west as high pressure expanded to its north. Abundant dry air and stronger upper-level winds capped the storm's organization to intermittent, amorphous bursts of convection that eventually dissipated, and Cristina degenerated to a remnant low around 18:00 UTC on June 30. The low turned southward before dissipating on July 3. [11]

Tropical Storm Douglas

Tropical storm (SSHWS)
Douglas Jul 2 2008 1800Z.jpg   Douglas 2008 track.png
DurationJuly 1 – July 4
Peak intensity40 mph (65 km/h) (1-min);
1003  mbar  (hPa)

An organized tropical wave departed the western coast of Africa on June 19 and reached the waters south of the Gulf of Tehuantepec late the next week. The system steadily congealed into a tropical depression by 18:00 UTC on July 1. Paralleling the coastline of southwestern Mexico, the depression intensified into Tropical Storm Douglas and attained peak winds of 40 mph (65 km/h) around 12:00 UTC the next morning, despite the effects of strong northeasterly wind shear. As upper-level winds increased further and Douglas tracked northwest into cooler waters, it began a weakening trend that ended in its degeneration to a remnant low around 06:00 UTC on July 4. The low turned west within low-level flow and dissipated two days later. [12]

Due to the proximity to land, outer rain bands associated with Douglas produced tropical storm force winds in Manzanillo, Mexico. [12] Minor flood damage was reported along the coastline in Colima, Jalisco, and Nayarit. [13] Due to the proximity to land, the outer bands of Douglas produced tropical storm force winds in Manzanillo, Mexico. [12] Minor flooding was reported along the coastline in Colima, Jalisco, and Nayarit. [13] Moisture associated with Douglas produced light rain over parts of Baja California Sur, with heavier amounts in Todos los Santos. [14]

Tropical Depression Five-E

Tropical depression (SSHWS)
05-E 06 jul 2008.jpg   Five-E 2008 track.png
DurationJuly 5 – July 7
Peak intensity35 mph (55 km/h) (1-min);
1005  mbar  (hPa)

A tropical wave departed the western coast of Africa on June 23 and began steady organization after entering the eastern Pacific over a week later. The system acquired sufficient organization to be declared a tropical depression around 18:00 UTC on July 5 and embarked on a northwesterly course parallel to the coastline of Mexico. The following day, however, a weakening mid-level ridge to its north directed the cyclone more poleward. [15] Strong easterly wind shear prevented the formation of banding features while keeping the overall cloud pattern disorganized, [16] and the depression moved ashore near Lázaro Cárdenas, Michoacán, early on July 7 without attaining tropical storm intensity. It dissipated over the mountainous terrain a few hours later. [15]

The tropical depression produced 5.11 inches (130 mm) of rain in Manzanillo, with other locations also experiencing isolated rainfall. [15] Cerro de Ortega, Colima reported 12.99 inches (330 mm) of rain in a 24-hour period. The community of Ometepec reported 7.88 inches (200 mm). Other locations reported moderate rainfall, ranging around 5–7 inches (130–180 mm). [17] One person was swept away by flood waters, reaching 1 m (3.3 ft) in depth. Heavy rains from the depression resulted in a traffic accident that killed one person and injured two others. [18] In all, damages from the storm amounted to MXN 30 million ($2.2 million). [19]

Hurricane Elida

Category 2 hurricane (SSHWS)
Elida Jul 16 2008 2120z.jpg   Elida 2008 track.png
DurationJuly 11 – July 19
Peak intensity105 mph (165 km/h) (1-min);
970  mbar  (hPa)

A tropical wave, indistinguishable in the Atlantic basin, crossed the coastline of Central America on July 8 and organized into a tropical depression three days later around 18:00 UTC. With a mid-level ridge extending from the Gulf of Mexico into western Mexico, the newly formed cyclone moved west-northwest within an increasingly favorable environment, intensifying into Tropical Storm Elida by 06:00 UTC on July 12 and becoming the season's first hurricane around 12:00 UTC on July 14. An abrupt increase in wind shear briefly weakened the storm the next day, but by 18:00 UTC on July 16, [20] the formation of an eye within Elida's round central dense overcast showcased its peak as a Category 2 hurricane with winds of 105 mph (170 km/h). [21] The system then tracked into cooler waters and stronger upper-level winds, causing it to fall below hurricane intensity by 06:00 UTC on July 18 and degenerate to a remnant low early the next morning, although it maintained a well-defined circulation. The low ultimately dissipated well east-southeast of Hawaii by 00:00 UTC on July 22. [20]

Due to the proximity of Elida to Mexico, the Government of Mexico warned residents about the possibility of heavy rains from the outer edges of the storm. [22] Thunderstorms related to Elida developed over Oaxaca, Guerrero, Michoacán, Colima and Jalisco. [23] In Nayarit, Elida produced storms that dropped torrential rainfall and hail that injured at least one person. The rainfall resulted in the formation of a lake roughly 45 cm (18 in) deep. Several trees feel, blocking streets for several hours. Street flooding reached a depth of 20 cm (7.9 in), inundating shops and some homes. [24] Indirect effects, such as large swells, were felt along the Mexican coastline as the storm produced waves up to 4 m (13 ft). [25] However, as trade winds increased during the middle of July, the remnants of Elida brought rainfall to east-facing slopes of the Island of Hawaii and Maui. Frequent rain showers produced 2 to 6 inches (51 to 152 mm) of precipitation in those regions, but no significant flooding occurred. [26]

Hurricane Fausto

Category 1 hurricane (SSHWS)
Fausto08.jpg   Fausto 2008 track.png
DurationJuly 16 – July 22
Peak intensity90 mph (150 km/h) (1-min);
977  mbar  (hPa)

A tropical wave exited western Africa on July 4, which moved westward across the Atlantic without development. It entered the eastern Pacific on July 12 and began to show signs of development the next day. On July 16, the system organized into Tropical Depression 7E, located about 550 mi (885 km) southeast of Acapulco, Mexico. Steered by a ridge to the north, the system moved generally northwestward throughout its duration. [27] With thunderstorms located around the circulation amid moderate wind shear, [28] the depression quickly intensified into Tropical Storm Fausto. As a large cyclone, Fausto slowly intensified, with relaxing wind shear and warm waters. [27] Although the circulation was occasionally exposed from the thunderstorms, [29] a banding eye feature began to develop on July 18. [30] Fausto attained hurricane status later that day. On July 20, Fausto attained peak winds of 90 mph (145 km/h) and a minimum pressure of 977 mbar (hPa; 28.85  inHg). Around that time, the hurricane passed between the islands of Clarion and Socorro. Cooler waters caused Fausto to weaken, [27] diminishing convective activity. [31] On July 21, the hurricane weakened to a tropical storm, and further to a tropical depression the next day. With little or no remaining convection, the system degenerated into a remnant low-pressure area as it traveled towards the west-northwest. The remnants of Fausto dissipated on July 24, while located about 1,065 mi (1,715 km) west of Cabo San Lucas. [27]

The outer bands of Fausto produced moderate rainfall over portions of Sinaloa, Mexico, peaking at 1.9 in (50 mm). [32] Several hours before the center of Fausto passed between Clarion Island and Socorro Island, sustained winds on Clarion were recorded at 64 mph (103 km/h) with gusts to 94 mph (151 km/h). Nearby Socorro recorded sustained winds of 79 mph (127 km/h) with gusts to 109 mph (175 km/h). Little or no damage was recorded on the islands. The hurricane-force winds reported on Socorro was recorded as Fausto made its closest approach to the island about 115 mi (185 km) to the southwest. However, due to the distance from the center of Fausto, these winds are suspected to be overestimated. [27] Along the coastline of Mexico, waves up to 8 ft (2.4 m) were recorded in relation to Fausto. [33]

Hurricane Genevieve

Category 1 hurricane (SSHWS)
Genevieve 2008-07-25 2115Z.jpg   Genevieve 2008 track.png
DurationJuly 21 – July 27
Peak intensity75 mph (120 km/h) (1-min);
987  mbar  (hPa)

A tropical wave moved off Africa on July 6, spawning an area of low pressure over the western Caribbean Sea ten days later. After crossing into the eastern Pacific, the disturbance organized into a tropical depression around 12:00 UTC on July 21 and intensified into Tropical Storm Genevieve six hours later. Moderate easterly wind shear gave way to more favorable upper-level winds following formation, but the system soon tracked over cooler ocean waters caused by Hurricane Fausto, limiting its development. By July 25, however, Genevieve moved into warmer waters and attained its peak as a Category 1 hurricane with winds of 75 mph (120 km/h); [34] its satellite presentation at this time was characterized by hints of an eye within a small central dense overcast. [35] Encountering strong northerly wind shear, the cyclone began a steady weakening trend shortly thereafter and ultimately degenerated to a remnant low around 12:00 UTC on July 27. The low continued west and dissipated four days later. [34]

Hurricane Hernan

Category 3 hurricane (SSHWS)
Hernan 2008-08-09 1905Z.jpg   Hernan 2008 track.png
DurationAugust 6 – August 12
Peak intensity120 mph (195 km/h) (1-min);
956  mbar  (hPa)

On July 24, a tropical wave exited the west coast of Africa, which traversed the Atlantic Ocean and eventually entered the eastern Pacific on August 2. There, it interacted with a broad area of cyclonic flow south of Mexico. [36] Its associated convection increased and organized around a low-pressure area. [37] [38] On August 6, the NHC designated the system as Tropical Depression Nine-E about 775 mi (1,245 km) south-southwest of the southern tip of Baja California Sur. A ridge over Mexico steered the depression to the northwest and later in a general westward direction. On August 7, the NHC upgraded the depression to Tropical Storm Hernan. [36] Although Hernan was located over warm waters, moderate wind shear prevented the storm from intensifying quickly. [39] An eye feature formed as wind shear diminished, signaling that Hernan intensified into a hurricane on August 8. [40] [41] [42] After the eye became more defined, Hernan was upgraded to a major hurricane on August 9, reaching peak winds of 120 mph (195 km/h). [43] [36]

After reaching its peak, Hernan underwent an eyewall replacement cycle while also moving over cooler waters; this caused the hurricane to weaken. [36] The new eye deteriorated as the outflow diminished. [44] [45] [46] Early on August 11, Hernan was downgraded to a tropical storm. [47] Deep convection diminished around the center of the storm [48] and by August 12, almost all of the deep convection dissipated as Hernan continued to weaken. [49] On August 13, Hernan degenerated into a remnant low after it lost its remaining thunderstorms. The low continued to the west-southwest over the next several days before dissipating 460 mi (740 km) southeast of the Island of Hawaii on August 16. [36] The remnant low-pressure area of Hernan later brought moisture to the island of Hawaii, causing cloud and shower activity. The associated rainfall was light and insignificant. [50]

Tropical Storm Kika

Tropical storm (SSHWS)
Kika 2008-08-10 2130Z.jpg   Kika 2008 track.png
DurationAugust 7 – August 12 (Crossed basin)
Peak intensity40 mph (65 km/h) (1-min);
1007  mbar  (hPa)

On the morning of August 5, the CPHC began monitoring an area of low pressure 1,200 mi (1,930 km) east-southeast of Hilo, Hawaii; [51] the system became better organized later in the day as the system was classified as a tropical disturbance [52] and was declared Tropical Depression One-C on August 7 850 mi (1,370 km) southeast of Hilo, Hawaii. [53] One-C was being steered toward the west due to easterly trade winds caused by large subtropical high-pressure area located northeast of Hawaii. [54] The depression was quickly upgraded to Tropical Storm Kika later that night. [55] Despite strong wind shear, [56] the storm was expected to attain winds at 60 mph (95 km/h). [57] However, this did not occur. After turning west-northwest and attaining peak intensity, [4] Kika became less organized the following morning and the CPHC subsequently downgraded it to a tropical depression. [58] After a revival in convection [59] Kika was re-upgraded to a tropical storm again that evening. [4] Even though wind shear was significantly diminishing, the storm became even less organized was moving over cooling water. [60] Late on August 9, Kika weakened to a tropical depression once more, but was briefly re-upgraded into a tropical storm as it became better organized very late that night. [61] By August 10, only isolated bursts of thunderstorms had remained around the center; [62] as such, Kika was downgraded into a tropical depression. [4] After a brief increase in thunderstorm activity, one Tropical cyclone forecast model showed Kika reaching hurricane status. [63] Kika degenerated into a remnant low-pressure area that night 400 mi (645 km) away from the Johnston Atoll. [4] The remnant low was last noted on August 14 as it crossed the International Date Line, out of the Central Pacific Hurricane Center's area of responsibility. [64]

Tropical Storm Iselle

Tropical storm (SSHWS)
Iselle 2008-08-14 2050Z.jpg   Iselle 2008 track.png
DurationAugust 13 – August 16
Peak intensity50 mph (85 km/h) (1-min);
999  mbar  (hPa)

A tropical wave left Africa on July 30 and began to show signs of organization as it crossed Central America early on August 8. It temporarily weakened thereafter, but began to coalesce again late on August 12; by 12:00 UTC the next morning, it had developed into a tropical depression. Six hours later, the depression intensified into Tropical Storm Iselle. High pressure to its north directed Iselle on a northwest trajectory, while moderate easterly wind shear limited the storm peak to 50 mph (80 km/h) on the morning of August 14. Increasing upper-level winds, cooler waters, and entrainment of dry air all hindered the system, causing it to weaken to a tropical depression around 00:00 UTC on August 16 and degenerate to a remnant low a day later. The low moved south and west before dissipating on August 23. [65]

Tropical Storm Julio

Tropical storm (SSHWS)
Julio 2008-08-24 1820Z.jpg   Julio 2008 track.png
DurationAugust 23 – August 26
Peak intensity50 mph (85 km/h) (1-min);
998  mbar  (hPa)

A tropical wave moved off Africa on August 6, first spawning Tropical Storm Fay in the Atlantic before continuing into the eastern Pacific on August 17. It began to organize several days later, leading to the formation of a tropical depression by 12:00 UTC on August 23; six hours later, it intensified into Tropical Storm Julio. An area of high pressure over Mexico directed the nascent cyclone north-northwest, while moderate upper-level winds prevented Julio from strengthening beyond 50 mph (80 km/h). Around 00:00 UTC on August 25, the storm made landfall approximately 40 mi (65 km) west-southwest of La Paz, Baja California Sur, with winds of 45 mph (70 km/h). Slow weakening occurred as Julio entered the Gulf of California, and it fell to tropical depression intensity around 00:00 UTC on August 26 before degenerating to a remnant low eighteen hours later. The low drifted east before dissipating on the coast of mainland Mexico by 12:00 UTC on August 27. [66]

As Julio made landfall, it produced lightning and locally heavy rainfall, [67] which left more than a dozen communities isolated due to flooding. The flooding damaged several houses and killed one person. [68] Winds were generally light, [67] although strong enough to damage a few electrical poles and small buildings. [69] Moisture from Julio developed thunderstorms across Arizona, including one near Chandler which produced winds of 75 mph (120 km/h); the storm damaged ten small planes at Chandler Municipal Airport, as well as a hangar. The storms also dropped light rainfall, reaching over 1 inch (25 mm) in Gilbert, which caused flooding on Interstate 17. [70]

Tropical Storm Karina

Tropical storm (SSHWS)
Karina 2008-09-02 1815Z.jpg   Karina 2008 track.png
DurationSeptember 2 – September 3
Peak intensity40 mph (65 km/h) (1-min);
1000  mbar  (hPa)

A tropical wave, the same that spawned Hurricane Gustav while in the Atlantic, crossed Central America on August 28. Convection slowly increased as it moved westward, and an area of low pressure developed just south of the Mexico coastline on August 30. Despite strong easterly wind shear, shower and thunderstorm activity formed close enough to the center for the disturbance to become a tropical depression around 06:00 UTC on September 2. A brief relaxation in upper-level winds allowed the depression to intensify into Tropical Storm Karina six hours later before wind shear once again increased, leading to a steady weakening trend and degeneration to a remnant low by 18:00 UTC on September 3. [71]

Tropical Storm Lowell

Tropical storm (SSHWS)
Lowell 2008-09-09 1820Z.jpg   Lowell 2008 track.png
DurationSeptember 6 – September 11
Peak intensity50 mph (85 km/h) (1-min);
998  mbar  (hPa)

A tropical wave emerged from Africa on August 19, the northern half of which spawned Hurricane Hanna, while the second half continued west. It entered the East Pacific by August 28, interacting with a broad cyclonic gyre spawned by a pre-existing surface trough in the region. As the wave reached the western edge of the gyre, it formed an area of low pressure that further organized into a tropical depression around 12:00 UTC on September 6. It intensified into Tropical Storm Lowell twelve hours later. The cyclone moved along the western periphery of an anticyclone over Mexico, and this feature imparted strong upper-level winds on Lowell that limited its peak strength to 50 mph (80 km/h). Wind shear eventually slackened, but the storm progressed into a drier environment and began to weaken. After falling to tropical depression intensity, Lowell turned east and made landfall near Cabo San Lucas around 09:00 UTC on September 11. It opened up into an elongated surface trough nine hours later. [72]

Lowell made landfall as a tropical depression in Baja California but its effects where felt at more inland areas. In Michoacán, Sonora, and Sinaloa, flooding from Lowell's remnants left more than 26,500 people homeless. No deaths were reported. [73] Damage in Sonora totaled over 200 million pesos – US$15.5 million (value in 2008). [74]

Moisture from Lowell eventually joined with a cold front and the remnants of Hurricane Ike and caused significant damage. As this conglomeration of moisture traveled through the United States it caused extensive flooding in Illinois. In Chicago it broke flooding records dating back to 1871. [75]

Hurricane Marie

Category 1 hurricane (SSHWS)
Marie 2008-10-03 1905Z.jpg   Marie 2008 track.png
DurationOctober 1 – October 6
Peak intensity80 mph (130 km/h) (1-min);
984  mbar  (hPa)

Marie developed on October 1 from a tropical wave that departed Africa nearly a month earlier on September 6. The wave moved west through the tropical Atlantic and the Caribbean, before crossing Central America on September 24, still poorly organized. An area of low pressure formed on September 28, and it began a gradual organization trend that led to the formation of a tropical depression around 06:00 UTC on October 1, and to the designation of Tropical Storm Marie six hours later. With light upper-level winds, Marie began a period of quick intensification on October 3, bringing it to hurricane strength at 18:00 UTC that afternoon and to a peak of 80 mph (130 km/h) the next morning. The hurricane soon began to enter cooler ocean temperatures, prompting a gradual decline in intensity before Marie degenerated to a remnant low around 00:00 UTC on October 7. The tenacious post-tropical cyclone meandered for nearly two weeks before being absorbed into the Intertropical Convergence Zone on October 19. [76]

Hurricane Norbert

Category 4 hurricane (SSHWS)
Norbert 2008-10-08 1750Z.jpg   Norbert 2008 track.png
DurationOctober 4 – October 12
Peak intensity130 mph (215 km/h) (1-min);
945  mbar  (hPa)

The merging of two tropical waves resulted in the development of a tropical depression south of Mexico around 00:00 UTC on October 4. Steered by a mid-level ridge to its north, the depression gradually intensified, becoming Tropical Storm Norbert a day after formation and attaining hurricane strength around 06:00 UTC on October 7. The hurricane rounded the ridge and began to rapidly intensify, ultimately reaching its peak as a Category 4 hurricane with winds of 130 mph (210 km/h) near 18:00 UTC on October 8. An eyewall replacement cycle weakened Norbert to Category 1 strength late on October 9, but favorable environmental conditions allowed the system to re-attain major hurricane intensity around 06:00 UTC on October 11. Norbert made landfall just southeast of Bahia Magdalena, Baja California, around 16:30 UTC on October 11 at a slightly reduced strength of 105 mph (170 km/h). An increase in wind shear caused the system to weaken to 85 mph (135 km/h) as it made a second landfall east-southeast of Huatabampo, Sonora, around 04:00 UTC on October 12. Norbert continued northeast and rapidly dissipated over the mountains of northeastern Mexico by 18:00 UTC. [77]

Hurricane Norbert struck Mexico's Baja California peninsula with torrential rains and winds of up to 155 km/h. Strong winds bent palm trees along coastal areas. Some streets were in knee-deep water in the town of Puerto San Carlos. Norbert ripped off roofs, knocking down trees and left one person missing and more than 20,000 homes without electricity, local authorities say. Some 2850 people were housed in temporary shelters. Forty percent of homes were totally or partially damaged on the islands of Margarita and Magdalena, mainly having lost their roofs, said a report from state protection services. La Paz international airport suspended its activities at midday local time Saturday, but the tourist resort of Los Cabos remained open. Hotel reservations were down by around 40 per cent mainly in Los Cabos and Loreto, local tourism officials said. [78]

Norbert was a Category 2 hurricane at landfall, which made Norbert the first October hurricane to strike the western Baja California peninsula since Hurricane Pauline forty years prior, and Norbert was the stronger of the two.

Tropical Storm Odile

Tropical storm (SSHWS)
Odile 2008-10-09 1655Z.jpg   Odile 2008 track.png
DurationOctober 8 – October 12
Peak intensity60 mph (95 km/h) (1-min);
997  mbar  (hPa)

A complex series of interactions between two tropical waves, a frontal system, and a pre-existing area of vorticity led to the formation of a tropical depression just west of El Salvador around 12:00 UTC on October 8. The system moved west-northwest as it developed, steered by a large ridge over Mexico. Light upper-level winds allowed the depression to intensify into Tropical Storm Odile by 06:00 UTC on October 9 and attain peak winds of 60 mph (95 km/h) by early the next day. After maintaining its intensity for over 24 hours, increasing southeasterly wind shear prompted a rapid weakening trend. Odile fell to tropical depression strength early on October 12 as it continued to parallel the coastline of Mexico, and it degenerated to a remnant low around 00:00 UTC on October 13. The post-tropical cyclone moved south-southwest and dissipated that day. [79]

Eighteen hours after it was named, a Tropical Storm Watch was issued from Punta Maldonado to Zihuatanejo. [80] It was replaced with a warning 12 hours later. [81] Before becoming a tropical wave, the precursor disturbance to Odile dumped heavy rainfall on Nicaragua, although any impact is unknown. Odile also caused heavy rain in Mexico. The system caused floods in Acapulco, which left 12 homes damaged. [82]

Tropical Depression Seventeen-E

Tropical depression (SSHWS)
Seventeen-E 23 oct 2008.jpg   17-E 2008 track.png
DurationOctober 23 – October 24
Peak intensity35 mph (55 km/h) (1-min);
1008  mbar  (hPa)

A slow-moving tropical wave left Africa on September 30 and crossed into the East Pacific by October 16. Convection developed and persisted as it continued west, leading to the formation of a tropical depression well south of Mexico around 06:00 UTC on October 23. As the newly formed cyclone reached the western periphery of a ridge over Mexico, it turned to the north. An approaching upper-level trough dictated the depression northwest early on October 24 while also imparting increasing upper-level winds; for this reason, deep convection never organized about the center of the system, and it failed to intensify into a tropical storm. By 18:00 UTC that day, it degenerated to a remnant area of low pressure. The post-tropical cyclone tracked west before dissipating early on October 28. [83]

Tropical Storm Polo

Tropical storm (SSHWS)
Polo 2 nov 2008 2045Z.jpg   Polo 2008 track.png
DurationNovember 2 – November 5
Peak intensity45 mph (75 km/h) (1-min);
1003  mbar  (hPa)

The final tropical cyclone of the 2008 season originated as a tropical wave that moved offshore Africa on October 15. The wave moved west and crossed Central America by October 29, subsequently merging with the ITCZ. A small area of low pressure developed along the wave axis, leading to the formation of a tropical depression around 12:00 UTC on November 2. Although the system never fully detached from the ITCZ, it intensified into Tropical Storm Polo twelve hours after formation, at an unusually low latitude. The development of a tiny eye-like feature signified the storm's peak strength of 45 mph (70 km/h) before increasing upper-level winds caused Polo to degenerate to an open trough by 06:00 UTC on November 5. [84]

Storm names

The following list of names was used for named storms that formed in the North Pacific east of 140°W during 2008. [85] This was the same list used in the 2002 season, except for the name Karina, which replaced Kenna . [86] A storm was named Karina for the first time this year.

  • Alma
  • Boris
  • Cristina
  • Douglas
  • Elida
  • Fausto
  • Genevieve
  • Hernan
  • Rachel (unused)
  • Simon (unused)
  • Trudy (unused)
  • Vance (unused)
  • Winnie (unused)
  • Xavier (unused)
  • Yolanda (unused)
  • Zeke (unused)

For storms that form in the North Pacific between 140°W and the International Date Line, the names come from a series of four rotating lists. Names are used one after the other without regard to year, and when the bottom of one list is reached, the next named storm receives the name at the top of the next list. [85] One named storm, listed below, formed within the area in 2008. [1]

  • Kika

Retirement

In April 2009, at the 31st Session of the RA IV Hurricane Committee, the World Meteorological Organization retired the name Alma from its rotating name lists on account of the damage it caused in Central America. It was replaced with Amanda for the 2014 season. [87] [88]

Season effects

This is a table of all of the storms that formed in the 2008 Pacific hurricane season. It includes their name, duration, peak classification and intensities, areas affected, damage, and death totals. Deaths in parentheses are additional and indirect (an example of an indirect death would be a traffic accident), but were still related to that storm. Damage and deaths include totals while the storm was extratropical, a wave, or a low, and all of the damage figures are in 2008 USD.

Saffir–Simpson scale
TDTSC1C2C3C4C5
2008 Pacific hurricane season statistics
Storm
name
Dates activeStorm category
at peak intensity
Max 1-min
wind
mph (km/h)
Min.
press.
(mbar)
Areas affectedDamage
(USD)
DeathsRef(s)
Alma May 29 – 30Tropical storm65 (100)994Central America$35 million4 (7) [89]
BorisJune 27 – July 4Category 1 hurricane80 (130)985NoneNoneNone [90]
CristinaJune 27–30Tropical storm50 (85)999NoneNoneNone
DouglasJuly 1–4Tropical storm40 (65)1003Northwestern Mexico, Baja California Peninsula NoneNone
Five-E July 5–7Tropical depression40 (65)1005Southwestern Mexico, Western Mexico$2.2 million1 (1)
ElidaJuly 11–19Category 2 hurricane105 (165)970Southwestern Mexico, Hawaii NoneNone
FaustoJuly 15–22Category 1 hurricane90 (150)977 Clarion Island, Socorro Island MinimalNone
GenevieveJuly 21–27Category 1 hurricane75 (120)987HawaiiNoneNone
HernanAugust 6–12Category 3 hurricane120 (195)955HawaiiNoneNone
KikaAugust 7–16Tropical storm40 (65)1007NoneNoneNone
IselleAugust 13–16Tropical storm50 (85)999NoneNoneNone
Julio August 23–26Tropical storm50 (85)998Northwestern Mexico, Baja California Sur, Sinaloa and Arizona $1 million2
KarinaSeptember 2–3Tropical storm40 (65)1000 Socorro Island NoneNone
Lowell September 6–11Tropical storm50 (85)998Northwestern Mexico, Baja California Peninsula, Southwestern United States $15.5 million6
MarieOctober 1–6Category 1 hurricane80 (130)984NoneNoneNone
Norbert October 4–12Category 4 hurricane130 (215)945Northwestern Mexico, Baja California Sur, Sonora, Sinaloa $98.5 million25
Odile October 8–12Tropical storm60 (95)997Central America, Nicaragua, Honduras, El Salvador, Guatemala, Southwestern MexicoMinimalNone
Seventeen-EOctober 23–24Tropical depression35 (55)1008NoneNoneNone
PoloNovember 2–5Tropical storm45 (75)1002NoneNoneNone
Season aggregates
19 systemsMay 29 – November 5 130 (215)945$153 million38 (8) 

See also

Notes

  1. The total represents the sum of the squares of the maximum sustained wind speed (knots) for every (sub)tropical storm's intensity of over 33 knots (38 mph, 61 km/h), divided by 10,000 while they are above that threshold; therefore, tropical depressions are not included.

Related Research Articles

<span class="mw-page-title-main">2004 Pacific hurricane season</span>

The 2004 Pacific hurricane season was an overall below-average Pacific hurricane season in which there were 12 named tropical storms, all of which formed in the eastern Pacific basin. Of these, 6 became hurricanes, and 3 of those intensified into major hurricanes. No storms made landfall in 2004, the first such occurrence since 1991. In addition to the season's 12 named storms, there were five tropical depressions that did not reach tropical storm status. One of them, Sixteen-E, made landfall in northwestern Sinaloa. The season officially began on May 15 in the eastern Pacific, and on June 1 in the central Pacific basin. It officially ended in both basins on November 30. These dates conventionally delimit the period during each year when most tropical cyclones form in each respective basin. These dates conventionally delimit the period during each year when a majority of tropical cyclones form. The season was reflected by an accumulated cyclone energy (ACE) index of 71 units.

<span class="mw-page-title-main">2005 Pacific hurricane season</span>

The 2005 Pacific hurricane season was a near-average Pacific hurricane season which produced fifteen named storms, seven hurricanes and two major hurricanes. It was also the second consecutive season in which no tropical cyclone of at least tropical storm intensity made landfall. The season officially began on May 15 in the East Pacific Ocean, and on June 1 in the Central Pacific; they ended on November 30. These dates conventionally delimit the period of each year when most tropical cyclones form in the Pacific basin. However, the formation of tropical cyclones is possible at any time of the year.

<span class="mw-page-title-main">2003 Pacific hurricane season</span>

The 2003 Pacific hurricane season was the first season to feature no major hurricanes since 1977. The season officially began on May 15, 2003 in the Eastern North Pacific, and on June 1 in the Central ; both ended on November 30. These dates, adopted by convention, historically describe the period in each year when most tropical cyclogenesis occurs in these regions of the Pacific. The season featured 16 tropical storms, 7 of which intensified into hurricanes, which was then considered an average season. Damage across the basin reached US$129 million, and 23 people were killed by the storms.

<span class="mw-page-title-main">2002 Pacific hurricane season</span>

The 2002 Pacific hurricane season was a near–average season which produced fifteen named storms. Eight hurricanes formed, including a record-equaling three Category 5 hurricanes, a record it shares with the 1994 and 2018 seasons. It was also a near-average season in terms of accumulated cyclone energy (ACE), having an ACE of 125. The season officially began on May 15, 2002 in the East Pacific Ocean, and on June 1, 2002 in the Central Pacific; both ended on November 30. These dates conventionally delimit the period of each year when most tropical cyclone formation occurs in these regions of the Pacific. The first system of the 2002 season, Hurricane Alma, formed on May 24, and the last, Tropical Depression Sixteen-E, dissipated on November 16.

<span class="mw-page-title-main">2000 Pacific hurricane season</span>

The 2000 Pacific hurricane season was an above-average Pacific hurricane season, although most of the storms were weak and short-lived. There were few notable storms this year. Tropical storms Miriam, Norman, and Rosa all made landfall in Mexico with minimal impact. Hurricane Daniel briefly threatened the U.S. state of Hawaii while weakening. Hurricane Carlotta was the strongest storm of the year and the second-strongest June hurricane in recorded history. Carlotta killed 18 people when it sank a freighter. Overall, the season was significantly more active than the previous season, with 19 tropical storms. In addition, six hurricanes developed. Furthermore, there were total of two major hurricanes.

<span class="mw-page-title-main">1996 Pacific hurricane season</span>

The 1996 Pacific hurricane season had below normal tropical cyclone activity, producing 9 tropical storms, of which 5 became hurricanes, with 2 of those intensifying into major hurricanes. With an Accumulated cyclone energy (ACE) index of 53.9, the season ranks among the least intense Pacific hurricane seasons on record. It officially began May 15, 1996, in the eastern north Pacific and on June 1, 1996, in the central north Pacific. It ended on November 30, 1996. These dates conventionally delimit the period of each year when most tropical cyclones form in the northeastern Pacific Ocean. The season slightly exceeded these bounds when tropical storm One-E formed on May 13.

<span class="mw-page-title-main">1993 Pacific hurricane season</span>

The 1993 Pacific hurricane season included more than double the average number of major hurricanes – Category 3 or stronger cyclones on the Saffir–Simpson scale. This activity was the result of an El Niño event, which is the main factor contributing to above-average activity across the Pacific basin. The season featured 15 named storms, 11 hurricanes, and 9 major hurricanes. While the number of named storms was near the long-term average, the number of hurricanes was above the average of 8, and the number of major hurricanes far exceeded the long-term average of 4. Seasonal activity began on May 17 and ended on November 8, within the confines of a traditional hurricane season which begins on May 15 in the East Pacific and June 1 in the Central Pacific. The season ends on November 30 in both basins. These dates conventionally delimit the period during each year when most tropical cyclones form.

<span class="mw-page-title-main">1990 Pacific hurricane season</span>

The 1990 Pacific hurricane season was a very active season which observed 21 named storms within the basin. The season also produced the fourth highest ACE index value on record. The season was officially started on May 15 in the eastern Pacific, and on June 1 in the central Pacific, and lasted until November 30. These dates conventionally delimit the period of each year when most tropical cyclones form in the northeastern Pacific Ocean. However, the formation of tropical cyclones is possible at any time of the year, as illustrated in 1990 by the formation of the season's first named storm, Hurricane Alma, on May 12. At the time, this was the earliest formation of a tropical storm on record in the eastern Pacific

<span class="mw-page-title-main">1984 Pacific hurricane season</span>

The 1984 Pacific hurricane season featured numerous tropical cyclones, several of which were impactful to land. It was a busy hurricane season with 21 named storms, 13 hurricanes, and 7 major hurricanes, the latter of which are Category 3 or stronger cyclones on the Saffir–Simpson scale. This activity was unusual given the presence of a La Niña, which typically suppresses Central and East Pacific tropical cyclone activity, and only average sea surface temperatures. Seasonal activity began on May 17 and ended on November 8. This lies within the confines of a traditional hurricane season which begins on May 15 in the East Pacific and June 1 in the Central Pacific, and ends on November 30 in both basins. These dates conventionally delimit the period during each year when most tropical cyclones form.

<span class="mw-page-title-main">2012 Pacific hurricane season</span>

The 2012 Pacific hurricane season was a moderately active Pacific hurricane season that saw an unusually high number of tropical cyclones pass west of the Baja California Peninsula. The season officially began on May 15 in the eastern Pacific Ocean, and on June 1 in the central Pacific (from 140°W to the International Date Line, north of the equator; they both ended on November 30. These dates conventionally delimit the period of each year when most tropical cyclones form in these regions of the Pacific Ocean. However, the formation of tropical cyclones is possible at any time of the year. This season's first system, Tropical Storm Aletta, formed on May 14, and the last, Tropical Storm Rosa, dissipated on November 3.

<span class="mw-page-title-main">Hurricane Hernan (2002)</span> Category 5 Pacific hurricane in 2002

Hurricane Hernan was the second of three Category 5 hurricanes during the 2002 Pacific hurricane season. The twelfth tropical cyclone, tenth named storm and sixth hurricane of the season, Hernan originated from a tropical wave that formed in the Atlantic Ocean and crossed to the Pacific Ocean. The wave spawned a low-pressure area which organized into a tropical depression on August 30, a tropical storm on August 31 and a hurricane later that day. Hernan rapidly intensified and reached peak intensity as a Category 5 storm on the Saffir–Simpson hurricane scale. Proceeding northwest, it maintained this strength for eight hours, but on September 2 it entered cooler waters and began to weaken. By September 6 it had degenerated into a remnant area of low pressure.

<span class="mw-page-title-main">Timeline of the 2008 Pacific hurricane season</span>

The 2008 Pacific hurricane season officially started on May 15 in the East Pacific Ocean, and on June 1 in the Central Pacific; they both ended on November 30. These dates conventionally delimit the period of each year when most tropical cyclones form in the Pacific basin. The first storm of the year, Tropical Storm Alma, developed on May 29, and the last, Tropical Storm Polo dissipated on November 5.[

<span class="mw-page-title-main">Hurricane Hernan (1996)</span> Category 1 Pacific hurricane in 1996

Hurricane Hernan was fourth and final tropical cyclone to strike Mexico at hurricane intensity during the 1996 Pacific hurricane season. The thirteenth tropical cyclone, eighth named storm, and fifth hurricane of the season, Hernan developed as a tropical depression from a tropical wave to the south of Mexico on September 30. The depression quickly strengthened, and became Tropical Storm Hernan later that day. Hernan curved north-northwestward the following day, before eventually turning north-northeastward. Still offshore of the Mexican coast on October 2, Hernan intensified into a hurricane. Six hours later, Hernan attained its peak as an 85 mph (140 km/h) Category 1 hurricane on the Saffir-Simpson Hurricane Wind Scale (SSHWS). After weakening somewhat, on 1000 UTC October 3, Hurricane Hernan made landfall near Barra de Navidad, Jalisco, with winds of 75 mph (120 km/h). Only two hours after landfall, Hernan weakened to a tropical storm. By October 4, Tropical Storm Hernan had weakened into a tropical depression, and dissipated over Nayarit on the following day.

<span class="mw-page-title-main">2013 Pacific hurricane season</span>

The 2013 Pacific hurricane season was an above average Pacific hurricane season with 21 tropical cyclones forming. Of these, 20 became named storms – 18 in the Eastern Pacific basin, and 2 in the Central Pacific basin. Of the 18 named storms in the east, 9 became hurricanes, with one, Raymond, becoming the season's only major hurricane. In the central, neither named storm became a hurricane. It was also a below-normal season in terms of Accumulated cyclone energy (ACE), as many of its systems were weak and short-lived. The season officially began on May 15 in the Eastern Pacific and started on June 1 in the Central Pacific; both ended on November 30. These dates conventionally delimit the period of each year when most tropical development occurs in these North Pacific basins. The first cyclone, Tropical Storm Alvin, formed on May 15, and the last, Tropical Storm Sonia, dissipated on November 4.

<span class="mw-page-title-main">2014 Pacific hurricane season</span>

The 2014 Pacific hurricane season was one of the busiest and costliest Pacific hurricane seasons since the keeping of reliable records began in 1949. The season officially started on May 15 in the East Pacific Ocean, and on June 1 in the Central Pacific; they both ended on November 30. These dates conventionally delimit the period of each year when most tropical cyclones form in these regions of the Pacific.

<span class="mw-page-title-main">2015 Pacific hurricane season</span>

The 2015 Pacific hurricane season is the second-most active Pacific hurricane season on record, with 26 named storms, only behind the 1992 season. A record-tying 16 of those storms became hurricanes, and a record 11 storms further intensified into major hurricanes throughout the season. The Central Pacific, the portion of the Northeast Pacific Ocean between the International Date Line and the 140th meridian west, had its most active year on record, with 16 tropical cyclones forming in or entering the basin. Moreover, the season was the third-most active season in terms of accumulated cyclone energy, amassing a total of 290 units. The season officially started on May 15 in the Eastern Pacific and on June 1 in the Central Pacific; they both ended on November 30. These dates conventionally delimit the period of each year when most tropical cyclones form in the Northeast Pacific basin. However, the formation of tropical cyclones is possible at any time of the year. This was shown when a tropical depression formed on December 31. The above-average activity during the season was attributed in part to the very strong 2014–2016 El Niño event.

<span class="mw-page-title-main">2016 Pacific hurricane season</span>

The 2016 Pacific hurricane season was tied as the fifth-most active Pacific hurricane season on record, alongside the 2014 season. Throughout the course of the year, a total of 22 named storms, 13 hurricanes and six major hurricanes were observed within the basin. Although the season was very active, it was considerably less active than the previous season, with large gaps of inactivity at the beginning and towards the end of the season. It officially started on May 15 in the Eastern Pacific, and on June 1 in the Central Pacific ; they both ended on November 30. These dates conventionally delimit the period of each year when most tropical cyclones form in these regions of the Pacific Ocean. However, tropical development is possible at any time of the year, as demonstrated by the formation of Hurricane Pali on January 7, the earliest Central Pacific tropical cyclone on record. After Pali, however, no tropical cyclones developed in either region until a short-lived depression on June 6. Also, there were no additional named storms until July 2, when Tropical Storm Agatha formed, becoming the latest first-named Eastern Pacific tropical storm since Tropical Storm Ava in 1969, later was surpassed by Tropical Storm Aletta eight years later.

<span class="mw-page-title-main">2017 Pacific hurricane season</span>

The 2017 Pacific hurricane season was an above average Pacific hurricane season in terms of named storms, though less active than the previous three, featuring eighteen named storms, nine hurricanes, and four major hurricanes. Despite the considerable amount of activity, most of the storms were weak and short-lived. The season officially started on May 15 in the eastern Pacific Ocean, and on June 1 in the central Pacific; they both ended on November 30. These dates conventionally delimit the period of each year when most tropical cyclones form in the respective regions. However, the formation of tropical cyclones is possible at any time of the year, as illustrated in 2017 by the formation of the season's first named storm, Tropical Storm Adrian, on May 9. At the time, this was the earliest formation of a tropical storm on record in the eastern Pacific basin proper. The season saw near-average activity in terms of accumulated cyclone energy (ACE), in stark contrast to the extremely active seasons in 2014, 2015, and 2016; and for the first time since 2012, no tropical cyclones formed in the Central Pacific basin. However, for the third year in a row, the season featured above-average activity in July, with the ACE value being the fifth highest for the month. Damage across the basin reached $375.28 million (2017 USD), while 45 people were killed by the various storms.

<span class="mw-page-title-main">2019 Pacific hurricane season</span>

The 2019 Pacific hurricane season was an above average season which produced nineteen named storms, most of which were rather weak and short-lived. Only seven hurricanes formed, the fewest since 2010. The season officially began on May 15 in the East Pacific Ocean, and on June 1 in the Central Pacific; they both ended on November 30. These dates conventionally delimit the period of each year when most tropical cyclones form in the Pacific basin. This season was one of the latest-starting Pacific hurricane seasons on record, with the first tropical cyclone, Hurricane Alvin, forming on June 25. The final system, Tropical Depression Twenty-One-E, dissipated on November 18.

<span class="mw-page-title-main">2020 Pacific hurricane season</span>

The 2020 Pacific hurricane season was a near average Pacific hurricane season in terms of named storms, featuring 17, but well below average season for hurricanes and major hurricanes, with only 4 hurricanes and 3 major hurricanes forming. Additionally, no tropical cyclones formed in the Central Pacific basin for the first time since 2017. The season officially began on May 15 in the East Pacific Ocean, and on June 1 in the Central Pacific (from 140°W to the International Date Line, north of the equator; they both ended on November 30. These dates conventionally delimit the period of each year when most tropical cyclones form in the respective regions. However, the formation of tropical cyclones is possible at any time of the year, as illustrated in 2020 by the formation of the season's first system, Tropical Depression One-E, on April 25. This was the earliest formation of a tropical cyclone on record in the eastern Pacific basin proper. The final system of the season was Tropical Storm Polo, which dissipated on November 19.

References

  1. 1 2 "Previous Tropical Systems in the Central Pacific". Central Pacific Hurricane Center. Archived from the original on 22 December 2008. Retrieved 2008-12-01.
  2. 1 2 Blake, Eric; Pasch, Richard (March 1, 2010). "Eastern North Pacific Hurricane Season of 2008". American Meteorological Society. 138 (3): 705–721. doi: 10.1175/2009MWR3093.1 . Retrieved January 30, 2024.
  3. "Background Information: East Pacific Hurricane Season". Climate Prediction Center. College Park, Maryland: National Oceanic and Atmospheric Administration. May 3, 2008. Archived from the original on May 3, 2007. Retrieved June 26, 2018.
  4. 1 2 3 4 5 6 National Hurricane Center; Hurricane Research Division; Central Pacific Hurricane Center (April 26, 2024). "The Northeast and North Central Pacific hurricane database 1949–2023". United States National Oceanic and Atmospheric Administration's National Weather Service. Archived from the original on May 29, 2024. A guide on how to read the database is available here. PD-icon.svg This article incorporates text from this source, which is in the public domain.
  5. 1 2 Pronostico de Huracanes del 2008 (PDF) (Report) (in Spanish). Secretaria de Marina Direccion de Meteorologia Maritima. May 16, 2008. Retrieved June 27, 2018.
  6. 1 2 Climate Prediction Center, NOAA (May 22, 2008). "NOAA: 2008 Tropical Eastern North Pacific Hurricane Outlook". National Oceanic and Atmospheric Administration. Archived from the original on 2008-06-18. Retrieved June 26, 2018.
  7. Central Pacific Hurricane Center (May 19, 2008). "NOAA Expects Slightly Below Average Central Pacific Hurricane Season" (PDF). National Oceanic and Atmospheric Administration. Archived from the original (PDF) on June 26, 2008. Retrieved June 26, 2018.
  8. "Basin Archives: Northeast Pacific Ocean Historical Tropical Cyclone Statistics". Fort Collins, Colorado: Colorado State University. Retrieved July 8, 2022.
  9. 1 2 Daniel P. Brown (July 7, 2008). Tropical Cyclone Report: Tropical Storm Alma (PDF) (Report). Miami, Florida: National Hurricane Center. pp. 1, 4. Retrieved July 11, 2017.
  10. Eric S. Blake (October 17, 2008). Tropical Cyclone Report: Hurricane Boris (PDF) (Report). Miami, Florida: National Hurricane Center. pp. 1, 3. Retrieved July 11, 2017.
  11. Richard J. Pasch (February 18, 2009). Tropical Cyclone Report: Tropical Storm Cristina (PDF) (Report). Miami, Florida: National Hurricane Center. pp. 1, 3. Retrieved July 13, 2017.
  12. 1 2 3 Lixion A. Avila (September 16, 2008). Tropical Cyclone Report: Tropical Storm Douglas (PDF) (Report). Miami, Florida: National Hurricane Center. pp. 1, 3. Retrieved July 13, 2017.
  13. 1 2 Oscar Gutierrez; Justin Miranda; Edgar Avila Perez (July 2, 2008). "Ocasiona tormenta tropical Douglas intensas lluvias". El Universal (in Spanish). Retrieved September 18, 2008.
  14. Staff Writer (July 3, 2008). "Douglas Continues to Weaken". Bajan Insider. Archived from the original on October 8, 2008. Retrieved June 14, 2009.
  15. 1 2 3 Richard D. Knabb (September 9, 2008). Tropical Cyclone Report: Tropical Depression Five-E (PDF) (Report). Miami, Florida: National Hurricane Center. Retrieved July 16, 2017.
  16. Richard J. Pasch (July 6, 2008). Tropical Depression Five-E Discussion Number 4 (Report). Miami, Florida: National Hurricane Center. Retrieved July 16, 2017.
  17. "Crónica de la depresión tropical 5e" (PDF) (in Spanish). Commission Del Agua. 2008. p. 3. Archived from the original (PDF) on 2009-02-05. Retrieved 2020-11-20.
  18. Various Writers (2008). "Informe de incidentes 6 de julio del 2008" (in Spanish). Noticias Acapulco. Retrieved 2007-08-01.
  19. Staff Writer (2008-07-15). "Dos muertos y millonarios daños a causa de las lluvias" (in Spanish). La Jordana. Retrieved 2009-09-04.
  20. 1 2 James L. Franklin (September 28, 2008). Tropical Cyclone Report: Hurricane Elida (PDF) (Report). Miami, Florida: National Hurricane Center. pp. 1, 2, 4, 5. Retrieved July 18, 2017.
  21. Lixion A. Avila (July 16, 2008). Hurricane Elida Discussion Number 20 (Report). Miami, Florida: National Hurricane Center. Retrieved July 18, 2017.
  22. Staff Writer (2008-07-12). "Quadratín, Podría 'Elida' afectar a Michoacán" (in Spanish). Quadratín. Retrieved 2009-08-01.[ dead link ]
  23. Staff Writer (2008-07-13). ""Elida" gana fuerza, pero se aleja de las costas del Pacífico" (in Spanish). El Periódico de México. Retrieved 2009-08-01.
  24. Angélica Cureño (2008-07-13). "Tormenta y caos en Tepic". Periódico Express (in Spanish). Retrieved 2009-08-01.
  25. Gustavo Alonso Alvarez (2008-07-14). "Elida podría generar lluvias en BCS" (in Spanish). El Sudcaliforniano. Retrieved 2009-08-01.
  26. Honolulu National Weather Service (2008). "July 2008 Precipitation Summary". National Weather Service. Archived from the original on 2008-10-02. Retrieved 2009-03-28.
  27. 1 2 3 4 5 John L. Beven II (November 19, 2008). "Hurricane Fausto Tropical Cyclone Report" (PDF). National Hurricane Center. Retrieved February 24, 2009.
  28. Franklin (July 16, 2008). "Tropical Depression 17E Discussion One". National Hurricane Center. Retrieved February 24, 2009.
  29. Knabb (July 17, 2008). "Tropical Storm Fausto Discussion Seven". National Hurricane Center. Retrieved February 24, 2009.
  30. Roberts and Rhome (July 18, 2008). "Tropical Storm Fausto Discussion Eight". National Hurricane Center. Retrieved February 24, 2009.
  31. Landsea and Knabb (July 21, 2008). "Hurricane Fausto Discussion Twenty-Two". National Hurricane Center. Retrieved February 24, 2009.
  32. José Angel Estrada (July 20, 2008). "Huracán "Fausto" dejará lluvias moderadas en Sinaloa: CAADES" (in Spanish). El Sol de Sinaloa. Retrieved February 24, 2009.
  33. Staff Writer (July 21, 2008). "July 21, 2008 Weather Bulletin" (PDF) (in Spanish). General Directorate of Merchant Shipping. Archived from the original (PDF) on July 22, 2011. Retrieved June 13, 2009.
  34. 1 2 Jessica S. Clark; Jamie R. Rhome (December 16, 2008). Tropical Cyclone Report: Hurricane Genevieve (PDF) (Report). Miami, Florida: National Hurricane Center. pp. 1, 2, 4, 5. Retrieved July 24, 2017.
  35. Eric S. Blake (July 25, 2008). Hurricane Genevieve Discussion Number 18 (Report). Miami, Florida: National Hurricane Center. Retrieved July 24, 2017.
  36. 1 2 3 4 5 Daniel P. Brown (2008). "Hurricane Hernan Tropical Cyclone Report" (PDF). National Hurricane Center . Retrieved 2008-10-18.
  37. Aguirre (2008). "Tropical Weather Discussion August 5, 2008 15Z". National Hurricane Center . Retrieved 2008-10-04.[ permanent dead link ]
  38. Aguirre (2008). "Tropical Weather Discussion August 4, 2008 21Z". National Hurricane Center . Retrieved 2008-09-27.[ permanent dead link ]
  39. Brown (2008). "Tropical Storm Hernan Discussion Two". National Hurricane Center . Retrieved 2008-08-31.
  40. Knabb (2008). "Tropical Storm Hernan Discussion Five". National Hurricane Center . Retrieved 2008-09-25.
  41. Knabb/Kimberlain (2008). "Hurricane Hernan Discussion Eight". National Hurricane Center . Retrieved 2008-09-26.
  42. Kimberlain/Brown (2008). "Hurricane Hernan Discussion Nine". National Hurricane Center . Retrieved 2008-09-26.
  43. Rhome (2008). "Hurricane Hernan Discussion Eleven". National Hurricane Center . Retrieved 2008-09-26.
  44. Beven (2008). "Hurricane Hernan Discussion Fourteen". National Hurricane Center . Retrieved 2008-09-26.
  45. Knabb (2008). "Hurricane Hernan Discussion Seventeen". National Hurricane Center . Retrieved 2008-09-26.
  46. Blake (2008). "Hurricane Hernan Discussion Eighteen". National Hurricane Center . Retrieved 2008-09-26.
  47. Stewart/Pasch (2008). "Tropical Storm Hernan Discussion Twenty-One". National Hurricane Center . Retrieved 2008-09-26.
  48. Blake (2008). "Tropical Storm Hernan Discussion Twenty-Two". National Hurricane Center . Retrieved 2008-09-26.
  49. Rhome (2008). "Tropical Storm Hernan Discussion Twenty-Three". National Hurricane Center . Retrieved 2008-09-26.
  50. National Weather Service (2008). "August 2008 Precipitation Summary". National Weather Service in Honolulu, Hawaii. Retrieved 2008-11-03.[ dead link ]
  51. Houston (2008-08-05). "Central Pacific Tropical Weather Outlook, August 5, 0732 UTC". Central Pacific Hurricane Center. Archived from the original on 2024-05-22. Retrieved 2008-10-26.
  52. Kinel (2008-08-06). "Central Pacific Tropical Weather Outlook, August 6, 0150 UTC". Central Pacific Hurricane Center. Archived from the original on 2024-05-22. Retrieved 2008-10-26.
  53. Craig (2008-08-06). "Tropical Depression One-C Public Advisory One". Central Pacific Hurricane Center . Retrieved 2008-10-26.
  54. Craig (2008-08-06). "Tropical Depression One-C Discussion One". Central Pacific Hurricane Center . Retrieved 2008-10-28.
  55. Kodama (2008-08-06). "Tropical Storm Kika Discussion Two". Central Pacific Hurricane Center . Retrieved 2008-10-28.
  56. Wroe/Houston (2008-08-07). "Tropical Storm Kika Discussion Three". Central Pacific Hurricane Center . Retrieved 2008-10-28.
  57. Donaldson (2008-08-07). "Tropical Storm Kika Discussion Four". Central Pacific Hurricane Center . Retrieved 2008-10-28.
  58. Donaldson (2008-08-08). "Tropical Depression Kika Discussion Eight". Central Pacific Hurricane Center . Retrieved 2008-10-28.
  59. Donaldson (2008-08-08). "Tropical Depression Kika Discussion Nine". Central Pacific Hurricane Center . Retrieved 2008-10-28.
  60. Burke (2008-08-09). "Tropical Storm Kika Discussion Twelve". Central Pacific Hurricane Center . Retrieved 2008-10-28.
  61. Donaldson (2008-08-09). "Tropical Storm Kika Discussion Fourteen". Central Pacific Hurricane Center . Retrieved 2008-10-28.
  62. Burke (2008-08-10). "Tropical Depression Kika Discussion Seventeen". Central Pacific Hurricane Center . Retrieved 2008-10-28.
  63. Powell (2008-08-11). "Tropical Depression Kika Discussion Nineteen". Central Pacific Hurricane Center . Retrieved 2008-10-28.
  64. Houston (2008-08-14). "Central Pacific Tropical Weather Outlook, August 14, 0745 UTC". Central Pacific Hurricane Center . Retrieved 2008-10-26.
  65. Eric S. Blake (December 5, 2008). Tropical Cyclone Report: Tropical Storm Iselle (PDF) (Report). Miami, Florida: National Hurricane Center. Retrieved June 22, 2018.
  66. Richard J. Pasch (February 10, 2009). Tropical Cyclone Report: Tropical Storm Julio (PDF) (Report). Miami, Florida: National Hurricane Center. Retrieved June 22, 2018.
  67. 1 2 Ignacio Martinez (2008-08-25). "Tropical Storm Julio expected to weaken in Mexico". Associated Press. Retrieved 2008-08-26.
  68. Gladys Rodríguez; et al. (2008-08-27). "'Julio' leaves 1 dead in BCS and Sonora". El Universal (in Spanish). Archived from the original on 2008-10-14. Retrieved 2008-08-27.
  69. Staff Writer (2008-08-25). "Julio weakens to tropical depression in Mexico". Associated Press. Retrieved 2008-08-26.
  70. Alyson Zepeda; Megan Boehnke (2008-08-26). "Monsoon storm brings rain, wind, thunder". The Arizona Republic. Retrieved 2008-08-28.
  71. Lixion A. Avila (October 7, 2008). Tropical Cyclone Report: Tropical Storm Karina (PDF) (Report). Miami, Florida: National Hurricane Center. Retrieved June 24, 2018.
  72. Robbie J. Berg (December 2, 2008). Tropical Cyclone Report: Tropical Storm Lowell (PDF) (Report). Miami, Florida: National Hurricane Center. Retrieved June 24, 2018.
  73. "Monthly Tropical Weather Summary". National Hurricane Center. 2008-10-01. Archived from the original on 3 October 2008. Retrieved 2008-10-02.
  74. http://www.nhc.noaa.gov/data/tcr/EP132008_Lowell.pdf
  75. "Chicago seeks aid after worst rain in at least 137 years". CNN. 2008-09-14. Archived from the original on 18 December 2008. Retrieved 17 December 2008.
  76. Stacy R. Stewart (November 16, 2008). Tropical Cyclone Report: Hurricane Marie (PDF) (Report). Miami, Florida: National Hurricane Center. Retrieved June 24, 2018.
  77. James L. Franklin (January 7, 2009). Tropical Cyclone Report: Hurricane Norbert (PDF) (Report). Miami, Florida: National Hurricane Center. Retrieved June 25, 2018.
  78. Hurricane tears into Mexico
  79. John L. Beven II (November 19, 2008). Tropical Cyclone Report: Tropical Storm Odile (PDF) (Report). Miami, Florida: National Hurricane Center. Retrieved June 25, 2018.
  80. "Tropical Storm ODILE".
  81. "Tropical Storm ODILE".
  82. (in Spanish) http://www2.esmas.com/noticierostelevisa/mexico/017485/tormenta-odile-deja-daos-materiales-acapulco Archived 2011-07-16 at the Wayback Machine
  83. Michael J. Brennan (November 23, 2008). Tropical Cyclone Report: Tropical Depression Seventeen-E (PDF) (Report). Miami, Florida: National Hurricane Center. Retrieved June 25, 2018.
  84. Robbie J. Berg (December 9, 2008). Tropical Cyclone Report: Tropical Storm Polo (PDF) (Report). Miami, Florida: National Hurricane Center. Retrieved June 25, 2018.
  85. 1 2 National Hurricane Center (2008). "Worldwide Tropical Cyclone Names". National Oceanic and Atmospheric Administration. Archived from the original on August 4, 2008. Retrieved August 4, 2008.
  86. Padgett, Gary (March 2008). "Monthly Global Tropical Cyclone Summary". australiasevereweather.com. Retrieved March 7, 2024.
  87. "Storm committee drops Gustav, Ike, Paloma and Alma". Sun Journal . Lewiston, Maine. May 2, 2009. Retrieved January 11, 2024.
  88. RA IV Hurricane Committee Thirty-First Session Final Report (PDF) (Report). World Meteorological Organization. 2009. p. 11. Archived from the original (PDF) on March 3, 2016. Retrieved March 28, 2024.
  89. Daniel P Brown (2008-07-07). "Tropical Storm Alma Tropical Cyclone Report" (PDF). NHC. Archived (PDF) from the original on 9 September 2008. Retrieved 2008-08-23.
  90. Blake, Eric S (July 7, 2008). Hurricane Boris — June 27 – July 4, 2008 (PDF) (Tropical Cyclone Report). United States National Oceanic and Atmospheric Administration's National Weather Service. Archived (PDF) from the original on August 24, 2014. Retrieved August 24, 2014.