Tropical cyclones in 2004 Last updated December 02, 2025
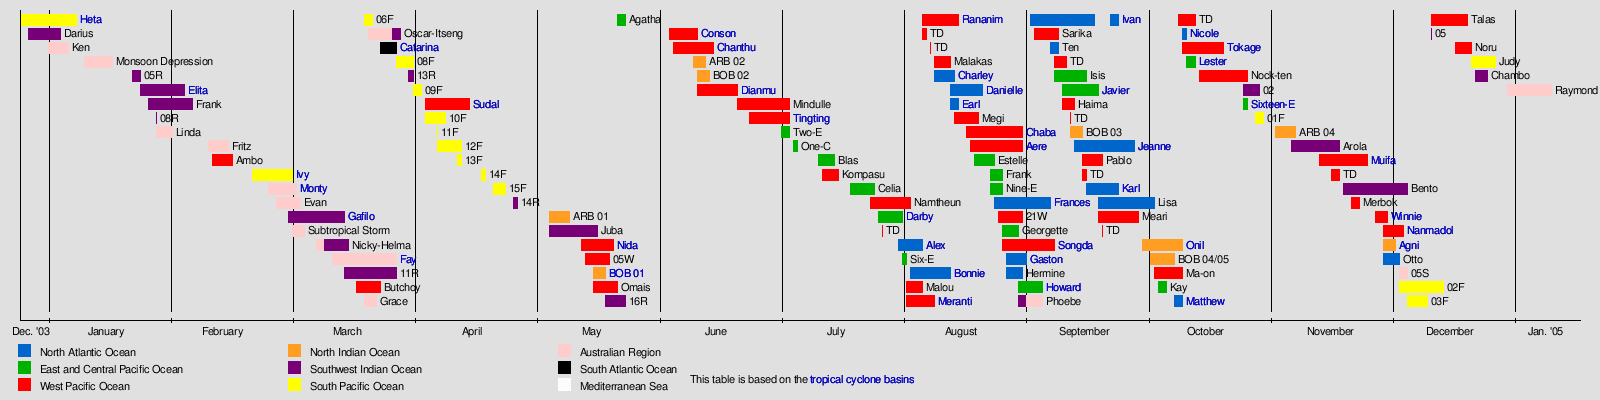
Tropical cyclones in 2004 Year summary map
First system Heta Formed December 25, 2003 [ nb 1] Last system Raymond Dissipated January 10, 2005 Name Gafilo Lowest pressure 895 mbar (hPa ); 26.43 inHg Name Ivan Duration 22 days Total systems 131 Named systems 81 Total fatalities 6,609 (97) Total damage $80.672 billion (2004 USD ) Other years 2002 , 2003 , 2004 , 2005 , 2006
Satellite photos of the 31 tropical cyclones worldwide that reached Category 3 or higher on the Saffir–Simpson scale during 2004 , from Frank in January to Chambo in December. Gafilo (center image in the first row) was the most intense, with a minimum central pressure of 895 hPa. During 2004, tropical cyclones formed within seven different tropical cyclone basins , located within various parts of the Atlantic, Pacific and Indian Oceans. During the year, a total of 132 systems formed with 82 of these developing further and were named by the responsible warning centre. The strongest tropical cyclone of the year was Cyclone Gafilo , which was estimated to have a minimum barometric pressure of 895 hPa (26.43 inHg ) . The most active basin in the year was the Western Pacific , which documented 29 named systems, while the North Atlantic 15 named systems formed. Conversely, both the Eastern Pacific hurricane and North Indian Ocean cyclone seasons experienced a below average number of named systems, numbering 12 and 4, respectively. Activity across the southern hemisphere's three basins—South-West Indian , Australian , and South Pacific —was spread evenly, with each region recording seven named storms apiece. Throughout the year, 28 Category 3 tropical cyclones formed, including seven Category 5 tropical cyclones formed in the year. The accumulated cyclone energy (ACE) index for the 2004 (seven basins combined), as calculated by Colorado State University was 1024.4 units.
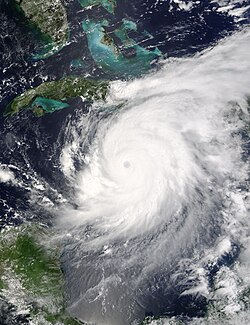
The costliest tropical cyclone was Hurricane Ivan , which struck Caribbean and United States in September causing a tornado outbreak , with US$26.1 billion in damage. The deadliest tropical cyclone of the year was Hurricane Jeanne who killed for at least 3,006 deaths in Haiti .
Global atmospheric and hydrological conditions This section
needs expansion . You can help by
adding to it .
(December 2020 )
Due to a Modoki El Niño – a rare type of El Niño in which unfavorable conditions are produced over the eastern Pacific instead of the Atlantic basin due to warmer sea surface temperatures farther west along the equatorial Pacific – activity was above average in North Atlantic Ocean. [ 1]
Summary North Atlantic Ocean It was an above average season in which 16 tropical cyclones formed. All but one tropical depression attained tropical storm status, and nine of these became hurricanes. Six hurricanes further intensified into major hurricanes.
Systems A total of 138 systems formed globally in the year with 60 of them causing significant damage, deaths, and/or setting records for their basin.
January Cyclone Frank 7 storms formed on January, in the Australian and Southwestern Indian basin, respectively. Cyclone Frank was the strongest.
February Cyclone Ivy 5 systems formed on February. 3 on Australian region, 1 on South Pacific basin, and 1 on the Western Pacific. Tropical Cyclone Ivy is the strongest.
March Average storms forming 12 storms. Strongest storm is Cyclone Gafilo with 895 hpa , Hurricane Catarina was the record breaking and the only hurricane in the South Atlantic.
Cyclone Gafilo April Below average forming 9 systems. Only Typhoon Sudal became a storm, mostly being a depression.
Typhoon Sudal Tropical cyclones formed in April 2004 Storm name Dates active Max wind Pressure Areas affected DamageUSD ) Deaths Refs 09F April 1–3 Unspecified Unspecified None None None Sudal (Cosme) April 4–15 165 (105) 940 Caroline Islands $14 million None 10F April 4–9 55 (35) 995 Fiji $4.17 million 11 11F April 7 Unspecified Unspecified None None None 12F April 7–13 Unspecified Unspecified Fiji None None 13F April 12–13 Unspecified Unspecified None None None 14F April 18–19 Unspecified 1006 Tonga None None 15F April 21–24 Unspecified 1006 None None None 14R April 26–27 Unspecified Unspecified None None None
May Typhoon Nida 8 systems formed on May. Typhoon Nida is the strongest.
Tropical cyclones formed in May 2004 Storm name Dates active Max wind Pressure Areas affected DamageUSD ) Deaths Refs ARB 01 May 5–10 100 (65) 984 Kochi $6.7 million None Juba May 5–17 100 (65) 980 None None None Nida (Dindo) May 13–21 175 (115) 935 Caroline Islands , Philippines , Japan $1.3 million 31 05W May 14–20 55 (35) 1004 Vietnam None None BOB 01 May 16–19 165 (105) 952 Odisha , Bangladesh , Myanmar , Thailand , Yunnan $99.2 million 236 Omais (Enteng) May 16–22 95 (60) 985 Caroline Islands None None 16R May 19–24 Unspecified Unspecified None None None Agatha May 22–24 60 (95) 997 None None None
June Typhoon Dianmu 7 storms formed on June. Typhoon Dianmu is the strongest.
Tropical cyclones formed in June 2004 Storm name Dates active Max wind Pressure Areas affected DamageUSD ) Deaths Refs Conson (Frank) June 4–11 150 (90) 960 Philippines , Taiwan , Japan $3.8 million 30 Chanthu (Gener) June 5–15 110 (70) 975 Philippines , Vietnam , Cambodia , Laos , Thailand $7.9 million 39 ARB 02 June 10–13 55 (35) 992 Puri None None BOB 02 June 11–14 55 (35) 992 None None None Dianmu (Helen) June 11–21 185 (115) 915 Caroline Islands , Japan $68.5 million 6 Mindulle (Igme) June 21–July 4 175 (110) 940 Mariana Islands , Philippines , Taiwan , East China , Ryukyu Islands , Korea $833 million 56 Tingting June 25–July 4 150 (90) 955 Caroline Islands , Mariana Islands $23.7 million 12
August Typhoon Chaba Tropical cyclones formed in August 2004 Storm name Dates active Max wind Pressure Areas affected DamageUSD ) Deaths Refs Six-E August 1–2 30 (45) 1008 None None None Bonnie August 3–14 65 (100) 1001 Lesser Antilles , Greater Antilles , Yucatán Peninsula , Southeastern United States (Florida ), Mid-Atlantic states , New England , Atlantic Canada $1.27 million 3 (1) Malou August 2–6 75 (45) 996 Japan Unknown None Meranti August 2–9 140 (85) 960 Wake Island None None Rananim (Karen) August 6–15 150 (90) 950 Ryukyu Islands , East China , Taiwan $2.44 billion 169 TD August 6–7 Unspecified 1002 None None None TD August 7–8 Unspecified 1002 None None None Malakas August 9–13 85 (50) 990 None Unknown None Charley August 9–14 150 (240) 941 Lesser Antilles , Greater Antilles (Cuba ), East Coast of the United States (Florida ) $16.9 billion 15 (20) Danielle August 13–21 110 (175) 964 Cape Verde None None Earl August 13–15 50 (85) 1009 Windward Islands None 1 Megi (Lawin) August 14–20 120 (75) 970 Japan, Korea Unknown 5 Chaba August 17–31 205 (125) 910 Ryukyu Islands , South Korea , Japan $977 million 20 Aere (Marce) August 18–31 150 (90) 955 Caroline Islands , Ryukyu Islands , China, Taiwan $313 thousand 107 Estelle August 19–24 70 (110) 989 None None None Frank August 23–26 70 (110) 979 Baja California Peninsula None None Nine-E August 23–26 35 (55) 1005 None None None Frances August 24–September 7 145 (230) 935 (The Bahamas ), Southern United States , Midwestern United States , Mid-Atlantic states , New England , Atlantic Canada $10.1 billion 7 (42) 21W August 25–31 55 (35) 1000 Mariana Islands None None Georgette August 26–30 65 (100) 995 None None None Songda (Nina) August 26–September 8 175 (110) 925 Marshall Islands , Mariana Islands , Japan, South Korea $9 billion 28 Gaston August 27–September 1 75 (120) 985 The Carolinas (South Carolina ), Mid-Atlantic states , New England , Atlantic Canada $130 million 8 (1) Hermine August 27–30 60 (95) 1002 New England (Massachusetts ), Atlantic Canada Minimal None Howard August 30–September 5 140 (220) 943 Baja California Peninsula , Western United States Minimal None
September Hurricane Ivan Tropical cyclones formed in September 2004 Storm name Dates active Max wind Pressure Areas affected DamageUSD ) Deaths Refs Phoebe September 1–5 85 (50) 990 None None None Ivan September 2–24 165 (270) 910 Lesser Antilles , Venezuela , Greater Antilles , Gulf Coast of the United States (Alabama , Louisiana ), Eastern United States , Atlantic Canada $26.1 billion 94 (33) Sarika September 3–9 100 (65) 980 Mariana Islands None None Ten September 7–9 35 (55) 1009 None None None TD September 8–11 Not specified 1002 Ryukyu Islands None None Isis September 8–16 75 (120) 987 None None None Javier September 10–19 150 (240) 930 Baja California , Southwestern United States None None Haima (Ofel) September 10–13 75 (45) 996 Taiwan , East China $7.64 million None TD September 12 Unspecified 1008 Taiwan None None BOB 03 September 12–15 45 (30) 996 West Bengal None 33 Jeanne September 13–28 120 (195) 950 Leeward Islands (Guadeloupe ), Greater Antilles (Puerto Rico , Dominican Republic ), (The Bahamas ), Southeastern United States (Florida ), Mid-Atlantic states , New England , Atlantic Canada $7.94 billion 3,042 Pablo September 15–20 Unspecified 1008 Philippines , Vietnam None None TD September 15–16 Unspecified 1006 East China None None Karl September 16–24 145 (230) 938 Faroe Islands , Iceland , Norway Minimal None Lisa September 19–October 3 75 (120) 987 None None None Meari (Quinta) September 19–September 29 165 (105) 940 Caroline Islands , Japan $798 million 18 TD September 20 Unspecified 1008 None None None Onil September 30–October 3 100 (65) 990 India, Pakistan None 9
December Cyclone Chambo Tropical cyclones formed in December 2004 Storm name Dates active Max wind Pressure Areas affected DamageUSD ) Deaths Refs 05S December 3–5 35 (56) 998 Indonesia None None 02F December 3–14 55 (35) 1000 None None None 03F December 5–10 45 (30) 1000 None None None Talas (Zosimo) December 11–20 75 (45) 994 Marshall Islands , Caroline Islands $750 thousand None 05 December 11–11 Unspecified Unspecified None None None Noru December 17–21 75 (45) 990 Mariana Islands None None Judy December 21–27 85 (50) 987 None None None Chambo December 22–30 155 (100) 950 Cocos Islands None None Raymond December 30, 2004 – January 10, 2005 85 (50) 985 Western Australia Minimal None
Global effects Season name Areas affected Systems formed Named storms Hurricane-force DamageUSD ) Deaths Ref North Atlantic Ocean [ a] Southeastern United States , Atlantic Canada , Lesser Antilles , Greater Antilles , Yucatán Peninsula , Mid-Atlantic states , New England , East Coast of the United States , Cape Verde , Windward Islands , Midwestern United States , Lucayan Archipelago , Leeward Islands , Faroe Islands , Iceland , Norway , Great Plains , Bermudas , Northeastern United States 16 15 9 $61.148 billion 3,164 (97) Eastern and Central Pacific Ocean [ a] Revillagigedo Islands , Clarion Island , Southwestern Mexico, Northwestern Mexico, Baja California Peninsula , Southwestern United States , Western United States 17 12 6 Unknown — Western Pacific Ocean [ b] Caroline Islands , Philippines , Japan , Vietnam , Republic of China , Cambodia , Laos , Thailand , Mariana Islands , East China , Ryukyu Islands , Korean Peninsula , South China , Wake Island , Marshall Islands , Russian Far East , Malaysia , Myanmar 45 29 20 $18.766 billion 2,435 North Indian Ocean [ c] Myanmar , Bangladesh , West India , East India , Pakistan , Somalia , Maldives 9 4 2 $129.8 million 587 South-West Indian Ocean January – June [ d] [ e] Mascarene Islands , Mauritius , Réunion , Juan de Nova Island , Madagascar , Mozambique , Malawi , Seychelles , Tromelin Island , Agaléga 10 4 4 $250 million 396 July – December [ b] Diego Garcia , Rodrigues , Madagascar 6 4 3 — — Australian region January – June [ d] Western Australia , Queensland , Northern Territory , South Australia 10 8 4 $20 million — July – December [ b] Western Australia , Northern Territory 2 1 — Unknown — South Pacific Ocean January – June [ d] Vanuatu , Solomon Islands , New Caledonia , New Zealand 10 1 1 $7.97 million 16 July – December [ b] — 4 1 — Unknown — South Atlantic Ocean Brazil 1 1 1 $350 million 11 Worldwide (See above) 130 [ f] 80 50 $80.672 billion 6,609 (97)
1 2 The wind speeds for this tropical cyclone/basin are based on the Saffir Simpson Scale which uses 1-minute sustained winds. 1 2 3 4 Only systems that formed either before or on December 31, 2004 are counted in the seasonal totals. ↑ The wind speeds for this tropical cyclone/basin are based on the IMD Scale which uses 3-minute sustained winds. 1 2 3 Only systems that formed either on or after January 1, 2004 are counted in the seasonal totals. ↑ The wind speeds for this tropical cyclone are based on Météo-France , which uses wind gusts. ↑ The sum of the number of systems in each basin will not equal the number shown as the total. This is because when systems move between basins, it creates a discrepancy in the actual number of systems. Notes ↑ According to the JTWC, Cyclone Heta developed as a tropical disturbance on December 25, 2003, and was officially named on January 2, 2004, which includes it in this list. 1 Only systems that formed either on or after January 1, 2004 are counted in the seasonal totals. 2 Only systems that formed either before or on December 31, 2004 are counted in the seasonal totals. 3 The wind speeds for this tropical cyclone/basin are based on the IMD scale which uses 3-minute sustained winds. 4 The wind speeds for this tropical cyclone/basin are based on the Saffir–Simpson scale which uses 1-minute sustained winds. 5 The wind speeds for this tropical cyclone are based on Météo-France which uses gust winds.
External links Regional Specialized Meteorological Centers
Tropical Cyclone Warning Centers
This article incorporates public domain material from websites or documents of the National Weather Service .
Cyclones Hurricanes Typhoons Non-seasonal lists
This page is based on this
Wikipedia article Text is available under the
CC BY-SA 4.0 license; additional terms may apply.
Images, videos and audio are available under their respective licenses.