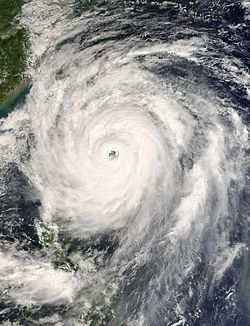
Satellite photos of the 22 tropical cyclones worldwide that reached at least Category3 on the Saffir–Simpson scale during 2007, from Dora in January to Daman in December. Among them, George (fourth image in the first row) was the most intense, with a minimum central pressure of 902 hPa.
During 2007, tropical cyclones formed within seven different tropical cyclone basins, located within various parts of the Atlantic, Pacific and Indian Oceans. During the year, a total of 129 systems formed with 79 of these developing further and were named by the responsible warning centre. The strongest tropical cyclone of the year was Cyclone George, which was estimated to have a minimum barometric pressure of 902hPa (26.64inHg), which was also the last Australian Region cyclone to be the most intense within a year to date. The deadliest tropical cyclone of the year was Cyclone Sidr in the North Indian Ocean which killed 15,000 people in Bangladesh. The costliest tropical cyclone of the year was Cyclone Gonu in the North Indian Ocean, which caused more than $4.41billion in damage after striking Oman, United Arab Emirates, Iran and Pakistan. The most active basin in the year was the Western Pacific, which documented 24named systems. The North Atlantic had an above-average season with 15 named storms. The Eastern Pacific hurricane season experienced a below-average number of tropical storm intensity systems, numbering 11. Activity across the Southern Hemisphere's three basins – South-West Indian, Australian, and South Pacific – was fairly significant, with the regions recording 25 named storms altogether, with the most intense storm of the year coming from the Australian basin. Throughout 2007, twenty one major tropical cyclones formed, including five Category 5 tropical cyclones in the year. The accumulated cyclone energy (ACE) index for the 2007 (seven basins combined), as calculated by Colorado State University was 568.1 units.
This section needs expansion. You can help by adding to it. (February 2021)
The ENSO during this year is mostly neutral, unlike the previous season.
Summary
North Atlantic Ocean
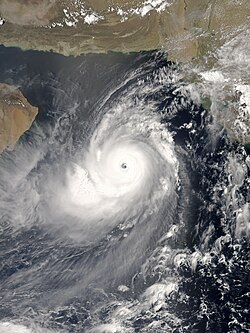
The activity was a slightly above-average Atlantic hurricane season, featuring many weak and short-lived storms. Despite the high activity of weak storms during 2007, it was the first season to feature more than one Category 5 landfalling hurricane, a feat that would not be matched until ten years later. It produced 17tropical cyclones, 15tropical storms, sixhurricanes, and twomajor hurricanes. The first system, Subtropical Storm Andrea, developed on May9, while the last storm, Tropical Storm Olga, dissipated on December13. The most intense hurricane, Dean, is tied for the tenth-most-intense Atlantic hurricane ever recorded as well as the fifth most intense Atlantic hurricane at landfall. The season was one of only seven on record for the Atlantic with more than one Category5 hurricane. It was the second on record in which an Atlantic hurricane, Felix, and an eastern Pacific hurricane, Henriette, made landfall on the same day. September had a record-tying eight storms, although the strengths and durations of most of the storms were low. Aside from hurricanes Dean and Felix, none of the storms in the season exceeded Category1 intensity.
Several storms made landfall or directly affected land. Hurricanes Dean and Felix made landfall at Category5 intensity, causing severe damage in parts of Mexico and Central America, respectively. Both storm names, as well as Noel, the name of a hurricane that affected the Caribbean, were retired from the naming list of Atlantic hurricanes. The United States was affected by five cyclones, although the storms were generally weak; three tropical depressions and only two tropical storms, Barry and Gabrielle, and one hurricane, Humberto, made landfall in the country. Elsewhere, three storms directly affected Canada, although none severely. The combined storms killed at least 478people and caused about $3.42billion (2007USD, $5.19billion2025USD) in damage.[nb 2]
Eastern Pacific Ocean
The activity was a below-average Pacific hurricane season, featuring one major hurricane. The first tropical cyclone of the season, Alvin, developed on May27, while the final system of the year, Kiko, dissipated on October23. Due to unusually strong wind shear, activity fell short of the long-term average, with a total of 11 named storms, 4 hurricanes, and 1 major hurricane. At the time, 2007 featured the second-lowest value of the Accumulated cyclone energy (ACE) index since reliable records began in 1971. Two tropical cyclones – Cosme and Flossie – crossed into the central Pacific basin during the year, activity below the average of 4 to 5 systems. Impact during the season was relatively minimal. In early June, Tropical Storm Barbara moved ashore just northwest of the Mexico–Guatemala border, causing $55million (2007 USD)[nb 3] in damage and 4 deaths. In late July, Cosme passed south of the island of Hawaii as a weakening tropical depression; light rain and increased surf resulted. A few days later, Dalila passed offshore the coastline of southwestern Mexico, killing 11 and causing minimal damage. Hurricane Flossie followed a similar track to Cosme in mid-August, producing gusty winds and light precipitation in Hawaii. Hurricane Henriette in early September produced torrential rainfall in southwestern Mexico, killing 6 and causing $25million in damage. Baja California received moderate rains from Hurricane Ivo in mid-September, though no damage nor fatalities were reported. In mid-October, Tropical Storm Kiko passed just offshore the coastline of southwestern Mexico. Though no deaths were reported on the Mexico mainland, the storm capsized a ship with 30 people on board, 15 of whom were recovered dead, and 9 of whom were reported missing. Overall, the season ended with $80million in damage and 49 deaths.
North Indian Ocean
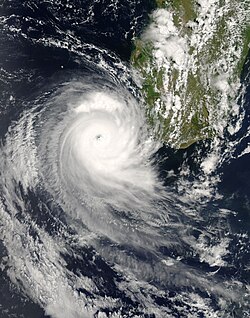
The activity was an active year for this basin; it was the most destructive season in known history at this time, only for the 2008 season to surpass it the next year. 2007 was also the first season to have multiple Category5 cyclones (by the Saffir–Simpson scale), and the two Category5's, Sidr and Gonu, were also the first named Category5 cyclones to form in their respective seas; Gonu in the Arabian Sea, and Sidr in the Bay of Bengal. Other notable storms of the season include Akash and Yemyin, both of which caused substantial damage and deaths. At least 4,545deaths were reported, and damage was about 6.4billion dollars.
In January, the Intertropical Convergence Zone (ITCZ), which allows for the formation of tropical waves, is located in the Southern Hemisphere, remaining there until May.[1] This limits Northern Hemisphere cyclone formation to comparatively rare non-tropical sources.[2] In addition, the month's climate is also an important factor. In the Southern Hemisphere basins, January, at the height of the austral summer, is the most active month by cumulative number of storms since records began. Of the four Northern Hemisphere basins, none is very active in January, as the month is during the winter, but the most active basin is the Western Pacific, which occasionally sees weak tropical storms form during the month.[3] In terms of activity, January was an inactive month, with six tropical cyclones forming, and three being named. In the southern pacific, cyclones Zita and Arthur impacted the Polynesian Islands. In the Southwest Indian Ocean, Cyclone Dora affected Rodrigues and became the strongest storm of the month.
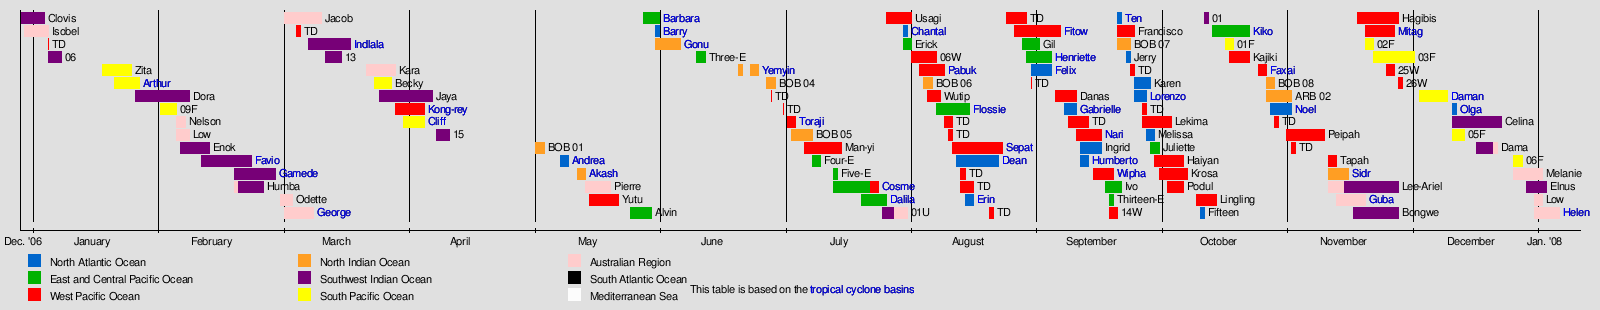
In terms of activity, February is normally similar to January, with activity effectively restricted to the Southern Hemisphere excepting the rare Western Pacific storm. In fact, in the Southern Hemisphere, due to the monsoon being at its height,[3] February tends to see more formation of strong tropical cyclones than January despite seeing marginally fewer overall storms. In the Northern Hemisphere, February is the least active month, with no Eastern or Central Pacific tropical cyclones[4] and only one Atlantic tropical cyclone having ever formed in the month.[5] Even in the Western Pacific, February activity is low: in 1992, the month had never seen a typhoon-strength storm, the first being Typhoon Higos in 2015. February 2007 was an example of this phenomenon, although it was slightly more active, with seven storms forming, and five being named. In the Australian basin, Cyclone Nelson affected the Northern Territory area, albeit damage was mostly minimal. The Southwest Indian Ocean was the most active basin this month, with four named storms forming; Tropical Storm Enok, Cyclone Favio, Cyclone Gamede, and Cyclone Humba. Gamede was the second-wettest tropical cyclone on record, dumping over 5,500 mm of rain on Réunion.
During March, activity tends to be lower than in preceding months. In the Southern Hemisphere, the peak of the season has normally already passed, and the monsoon has begun to weaken, decreasing cyclonic activity, however, the month often sees more intense tropical cyclones than January or February. Meanwhile, in the Northern Hemisphere basins, sea surface temperatures are still far too low to normally support tropical cyclogenesis. The exception is the Western Pacific, which usually sees its first storm, often a weak depression, at some point between January and April. However, March was a very active month despite this, with a total of eleven storms forming, eight being named. The Australian basin saw four named storms this month, with Cyclone George becoming the third-most intense tropical cyclone in the basin on record, only behind Cyclone Gwenda of 1999, and Cyclone Inigo of 2003. In the southern pacific, Cyclone Becky formed, and impacted New Caledonia. In the Southwest Indian Ocean, Cyclone Indlala and Cyclone Jaya formed, both impacting Madagascar. In the Northern Hemisphere, Typhoon Kong-rey formed and impacted the Mariana Islands.
The factors that begin to inhibit Southern Hemisphere cyclone formation in March are even more pronounced in April, with the average number of storms formed being hardly half that of March.[3][10] However, even this limited activity exceeds the activity in the Northern Hemisphere, which is rare, with the exception of the Western Pacific basin. All Pacific typhoon seasons between 1998 and 2016 saw activity between January and April, although many of these seasons saw only weak tropical depressions.[11] By contrast, only two Atlantic hurricane seasons during those years saw tropical cyclone formation during that period.[5] With the combination of the decreasing temperatures in the Southern Hemisphere and the still-low temperatures in the Northern Hemisphere, April and May tend to be the least active months worldwide for tropical cyclone formation.[10] Despite this, April 2007 was the second least active month in the recorded history of tropical cyclogenesis, only ahead of May 1992, with only two tropical cyclones, and only one, Cyclone Cliff, which impacted Fiji and Tonga, was named. Therefore, Cliff is also the strongest cyclone this month, both in terms of maximum sustained winds and minimum barometric pressure, and although Typhoon Kong-rey persisted into April, it was counted for the month of March, as that was the month it formed in.
Around the middle of May, the Intertropical Convergence Zone (ITCZ), which allows for the formation of tropical waves and has previously remained in the Southern Hemisphere for the first five months of the year, moves to the Northern Hemisphere, allowing the northern cyclone seasons to start in earnest.[1] Without the presence of the ITCZ, Southern Hemisphere cyclones must form from non-wave sources, which are rarer.[2] For that reason, cyclone formation is relatively sparse, with May tending to be the month of the final storm in each of the three basins. Meanwhile, more intense storms are nearly unheard of, with the South-West Indian Ocean having seen only one intense tropical cyclone and no very intense tropical cyclones in the month, and the other two basins having similar levels of activity in May. In the Northern Hemisphere, May is the first month most basins see activity, due to the new presence of the ITCZ. The Pacific hurricane season begins on May 15, and although the Atlantic hurricane season officially begins on June 1, off-season storms are very common, with over half of the 21st century seasons seeing a storm form in May.[12] Although the North Indian Ocean has no official start or end date, due to the monsoon, mid-May is the beginning of a month-long period of high activity in the basin. Even in the Western Pacific, activity tends to increase throughout May. May was slightly active with seven storms forming, six being named. In the North Atlantic, Subtropical Storm Andrea caused minimal damage to the east coast of the United States, as well as the Bahamas. In the eastern and western pacific basins, Tropical Storm Alvin and Tropical Storm Barbara formed, with Barbara impacting Mexico, Guatemala, and El Salvador. Typhoon Yutu became the first super typhoon of 2007, as well as the strongest storm this month. In the northern Indian Ocean, Cyclonic Storm Akash caused widespread damage to the Andaman and Nicobar Islands, Bangladesh, and Myanmar. In the southern hemisphere, Cyclone Pierre caused minimal impact to Papua New Guinea.
June was relatively inactive, with only six storms forming, three getting named. The month started with the formation of Tropical Storm Barry and Cyclone Gonu, both forming on June 1st, with the latter being one of the most intense cyclones on record in the North Indian ocean. Also in the North Indian ocean, Cyclone Yemyin and an unnamed depression formed as well, with Yemyin causing devastation and mass loss of life in Pakistan, India, and Afghanistan. In the Eastern and Western Pacific, an unnamed tropical depression, and Tropical Depression Three-E formed, with the former impacting the Caroline Islands.
12The wind speeds for this tropical cyclone/basin are based on the Saffir Simpson Scale which uses 1-minute sustained winds.
1234Only systems that formed either before or on December 31, 2007 are counted in the seasonal totals.
↑The wind speeds for this tropical cyclone/basin are based on the IMD Scale which uses 3-minute sustained winds.
123Only systems that formed either on or after January 1, 2007 are counted in the seasonal totals.
↑The wind speeds for this tropical cyclone are based on Météo-France, which uses wind gusts.
↑The sum of the number of systems in each basin will not equal the number shown as the total. This is because when systems move between basins, it creates a discrepancy in the actual number of systems.
↑The "strength" of a tropical cyclone is measured by the minimum barometric pressure, not wind speed. Most meteorological organizations rate the intensity of a storm by this figure, so the lower the minimum pressure of the storm, the more intense or "stronger" it is considered to be. The strongest winds were actually from Dean and Felix, at 175 mph (280 km/h).
↑The cumulative damage figures were obtained by summing the damage figures on the individual Tropical Cyclone Reports referenced throughout the article, with the exception of Hurricane Dean. Dean's damage figures were obtained by adding the per-country totals referenced in the Impact section of this article.
↑All damage totals are in 2007 USD unless otherwise stated.
1 Only systems that formed either on or after January 1, 2007 are counted in the seasonal totals. 2 Only systems that formed either before or on December 31, 2007 are counted in the seasonal totals. 3 The wind speeds for this tropical cyclone/basin are based on the IMD Scale which uses 3-minute sustained winds. 4 The wind speeds for this tropical cyclone/basin are based on the Saffir Simpson Scale which uses 1-minute sustained winds. 5The wind speeds for this tropical cyclone are based on Météo-France which uses gust winds.
↑"Africa Weekly Spotlight"(PDF). International Strategy for Disaster Reduction. March 5, 2007. Archived from the original(PDF) on May 26, 2011. Retrieved January 28, 2008.
↑Dorst, Neal (June 2, 2016). "TCFAQ G1) When is hurricane season?". Atlantic Oceanographic and Meteorological Laboratory. Archived from the original on May 6, 2009. Retrieved July 27, 2022.
This page is based on this Wikipedia article Text is available under the CC BY-SA 4.0 license; additional terms may apply. Images, videos and audio are available under their respective licenses.