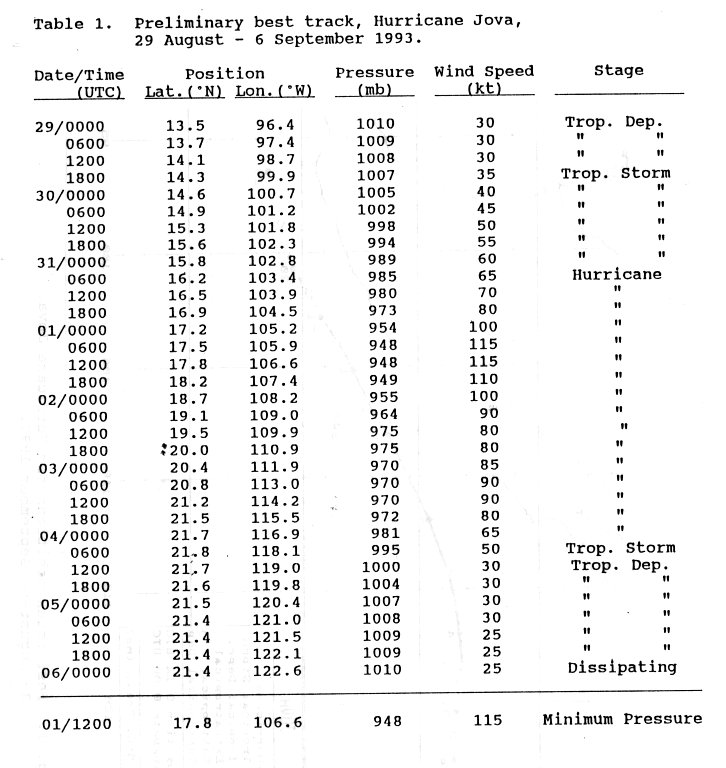
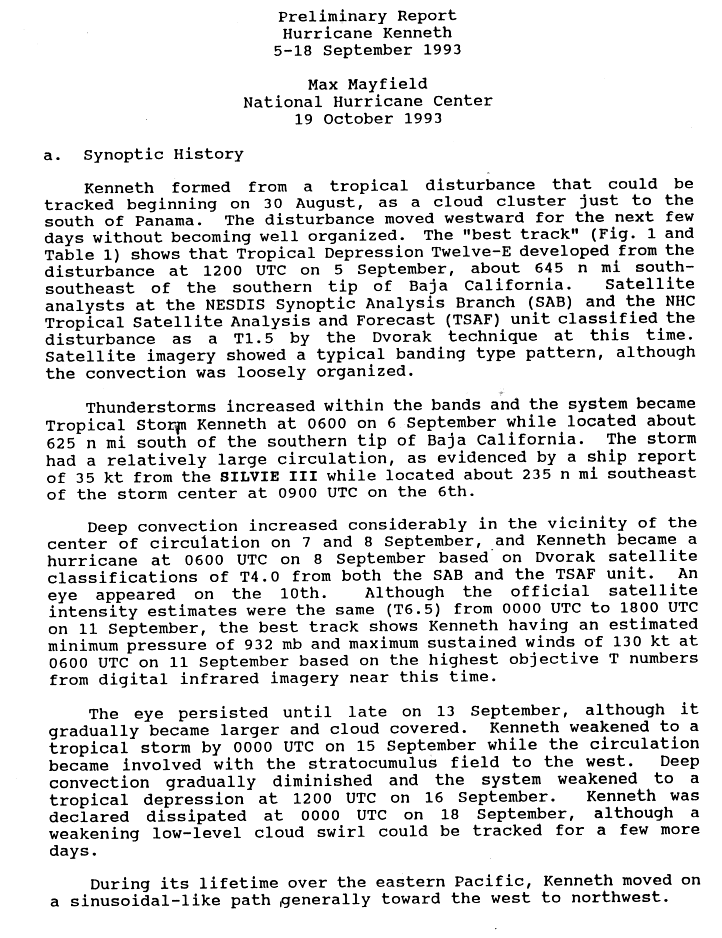
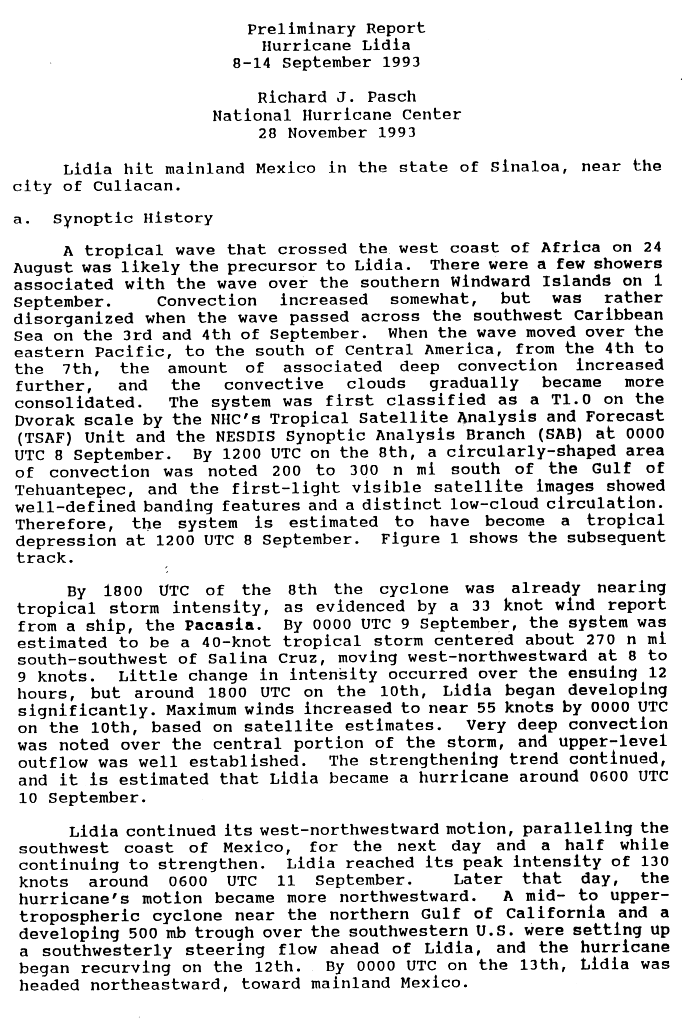
| Timeline of the 1993 Pacific hurricane season | |||||
|---|---|---|---|---|---|
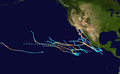
 Season summary map | |||||
| Season boundaries | |||||
| First system formed | June 11, 1993 | ||||
| Last system dissipated | October 14, 1993 | ||||
| Strongest system | |||||
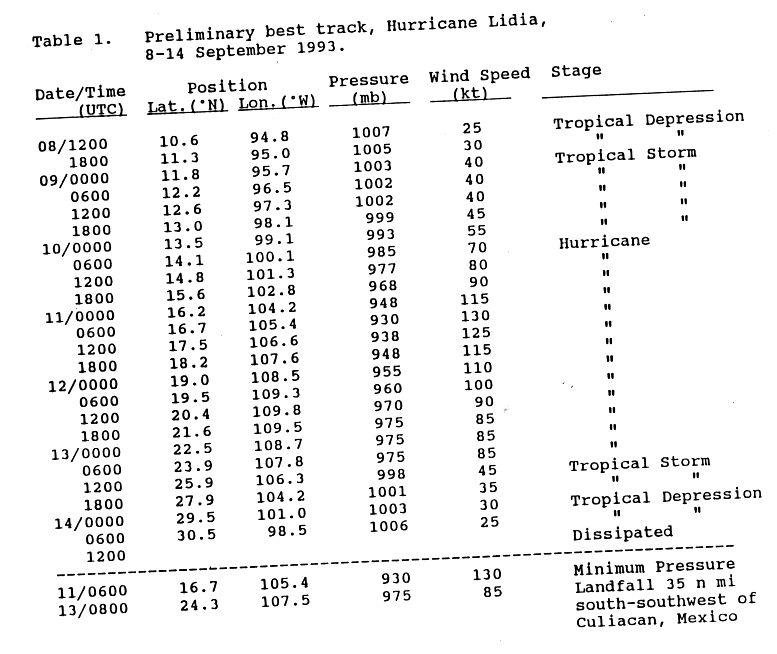
| Name | Lidia | ||||
| Maximum winds | 240 km/h (150 mph) (1-minute sustained) | ||||
| Lowest pressure | 930 hPa (mbar) | ||||
| Longest lasting system | |||||
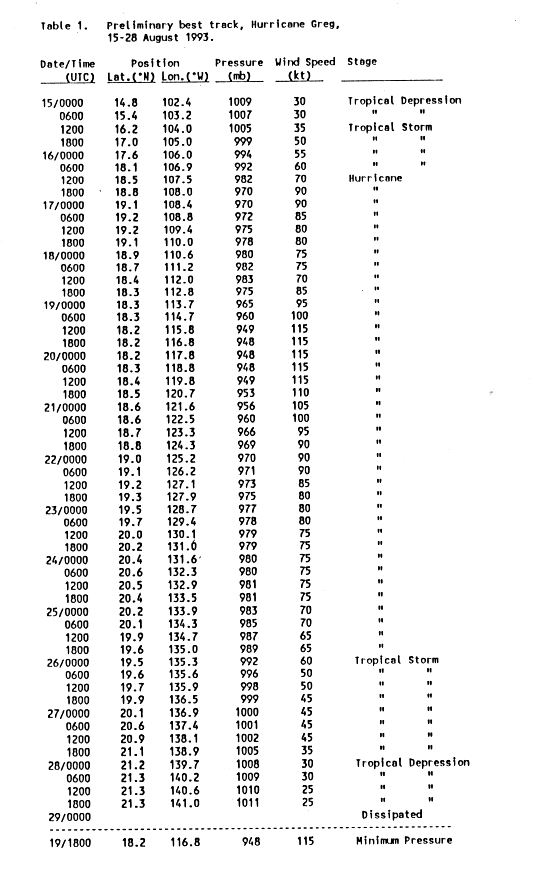
| Name | Greg | ||||
| Duration | 14.00 days | ||||
| |||||
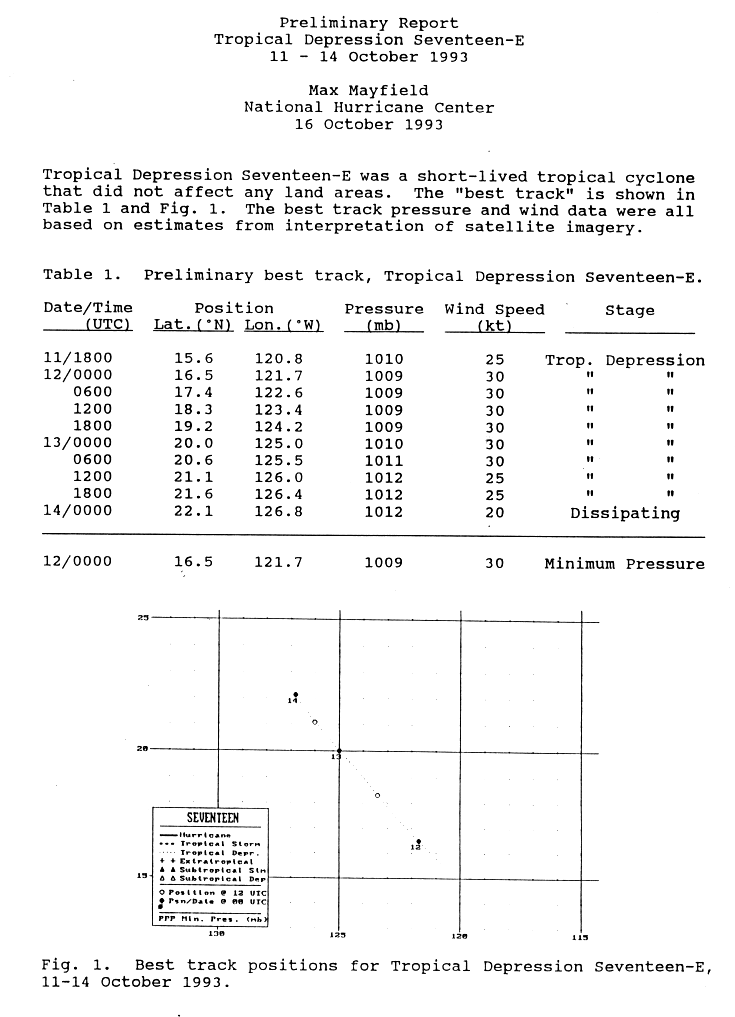
The 1993 Pacific hurricane season consisted of the events that occurred in the annual cycle of tropical cyclone formation over the Pacific Ocean north of the Equator and east of the International Date Line. The official bounds of each Pacific hurricane season are dates that conventionally delimit the period each year during which tropical cyclones tend to form in the basin according to the National Hurricane Center, beginning on May 15 in the Eastern Pacific proper (east of 140°W) and on June 1 in the Central Pacific (140°W to the International Date Line), and ending on November 30 in both areas. However, tropical cyclogenesis is possible at any time of the year. [1] The first system, Hurricane Adrian, developed on June 11; the final system, Tropical Depression Seventeen-E, dissipated on October 14.
Contents
- Timeline of events
- May
- June
- July
- August
- September
- October
- November
- Notes
- See also
- References
- External links
A total of eighteen tropical depressions formed during the season; fifteen of these developed into named tropical storms, of which eleven became hurricanes and nine became major hurricanes (Category 3 or higher on the Saffir–Simpson scale). [2] The number of tropical storms was near the long-term average; the number of hurricanes was slightly above average, and the number of major hurricanes was more than double the average of four. [1] [3] As with many active Pacific hurricane seasons, El Niño conditions greatly influenced this season's high activity levels. [4] Several long-lived and powerful hurricanes contributed to an overall Accumulated Cyclone Energy value of 201.8 units, the eighth-highest on record for a Pacific hurricane season as of February 2024. [nb 1] [6]
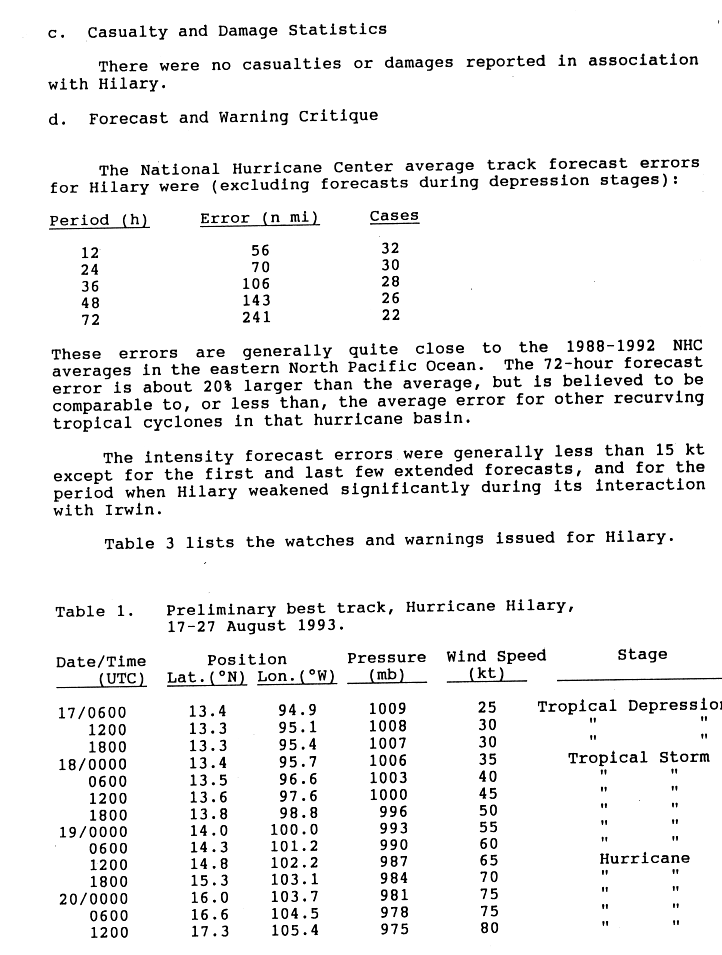
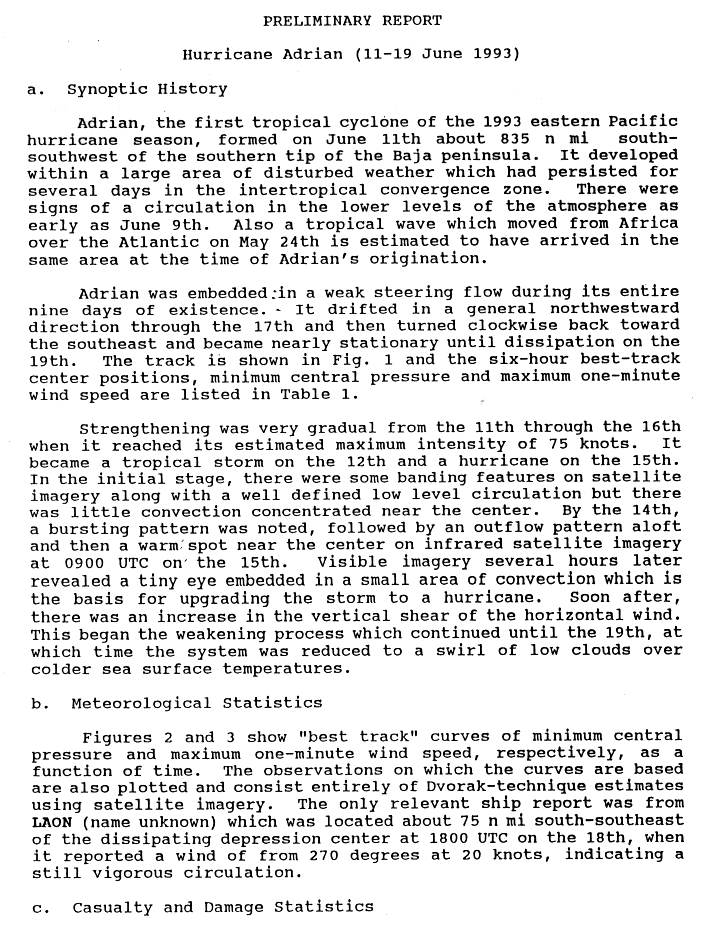
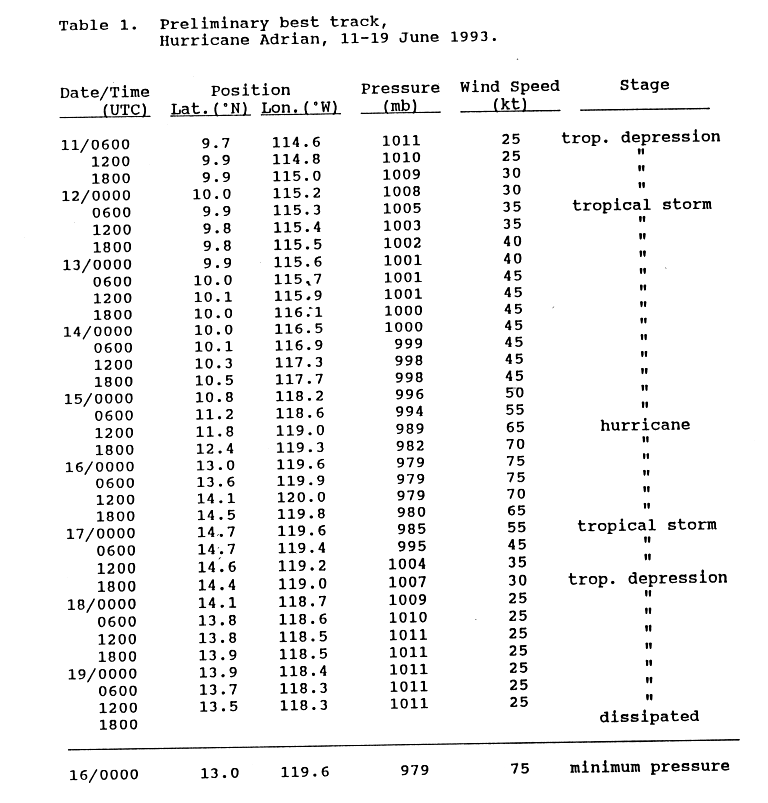
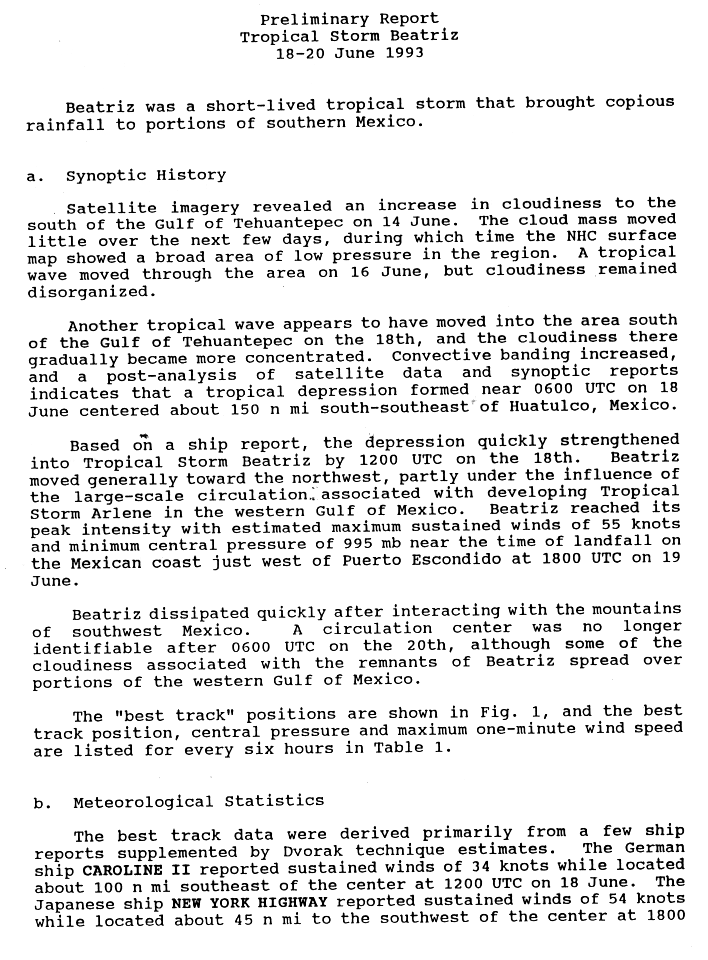
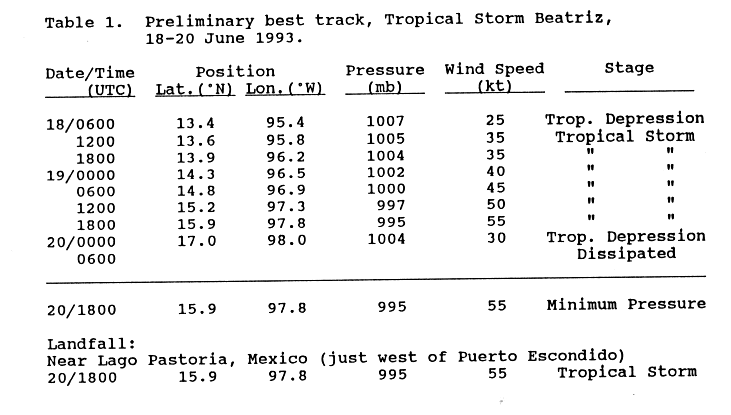
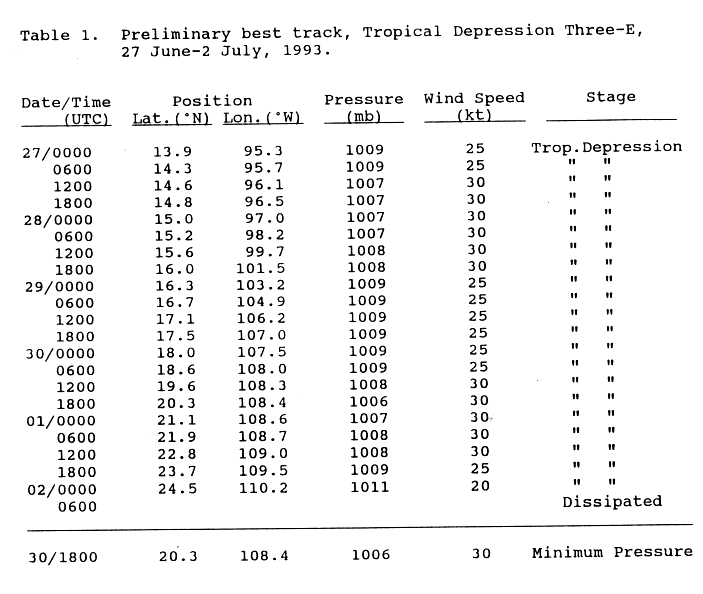
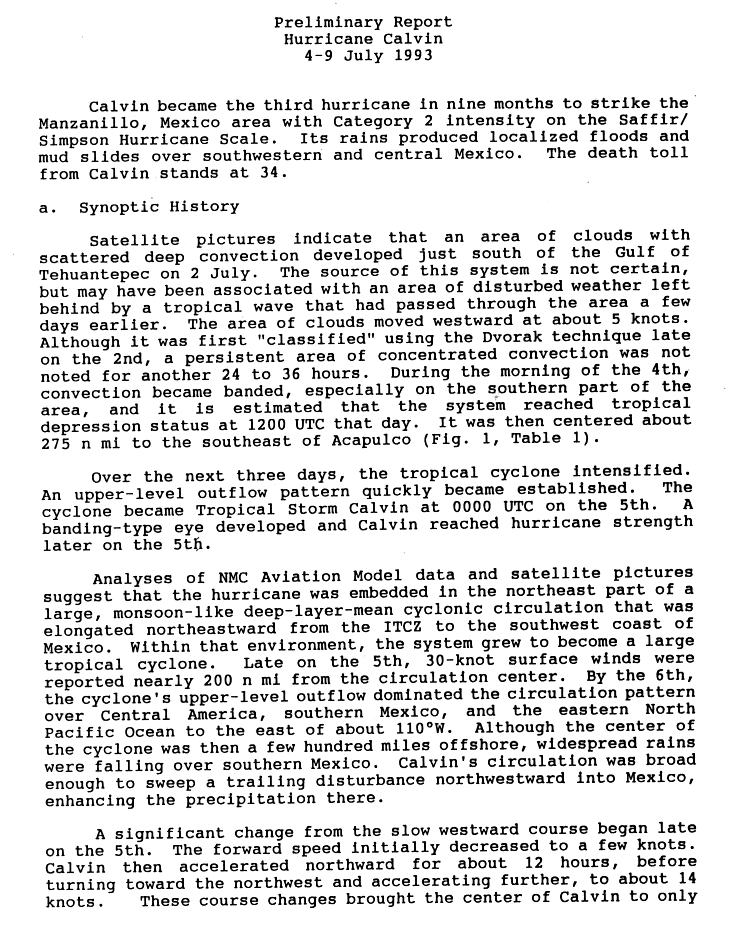
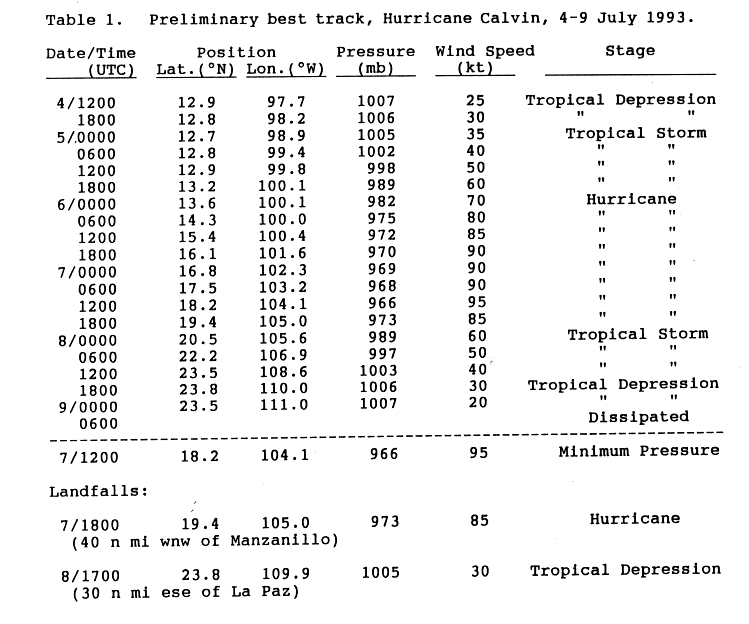
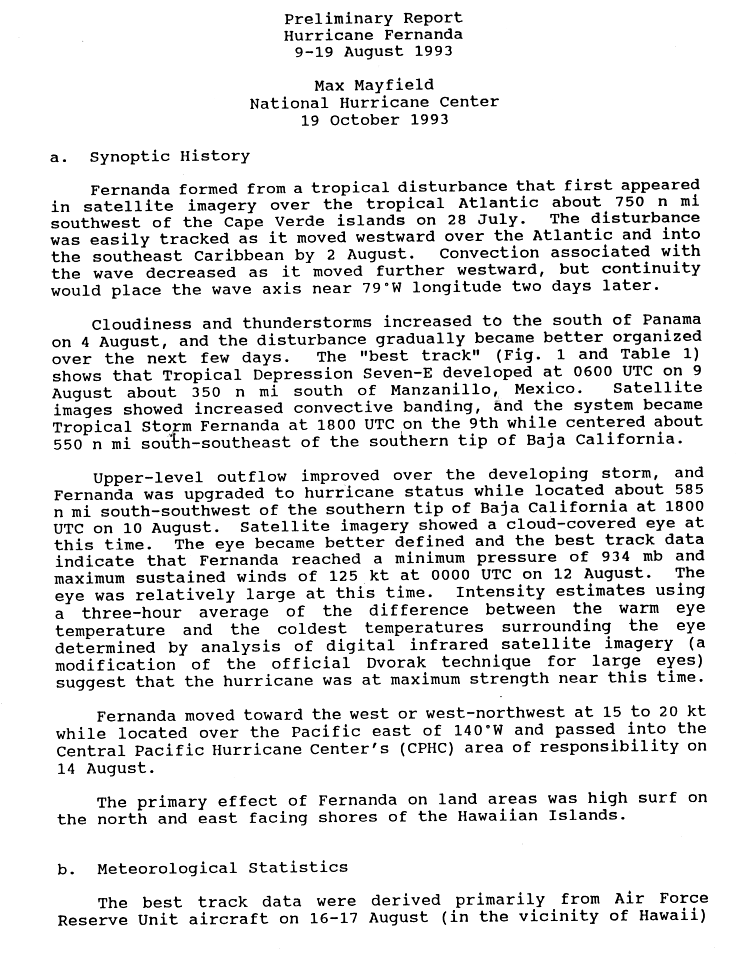
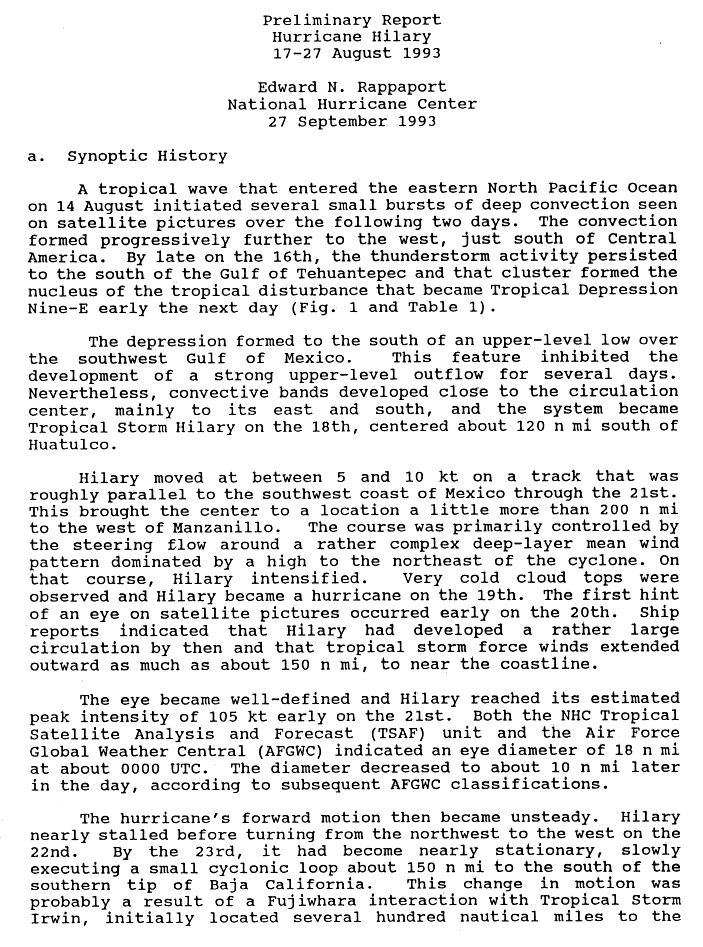
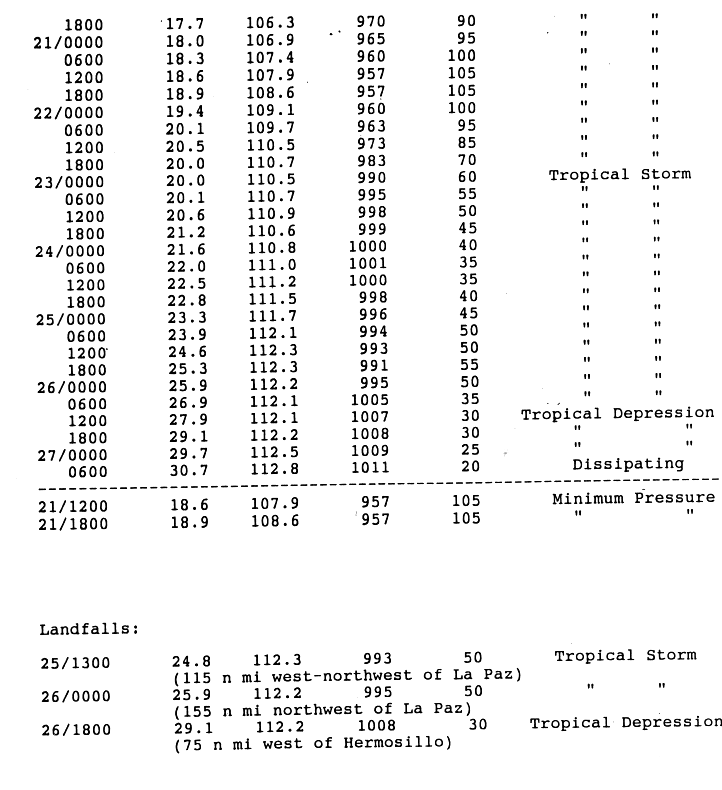
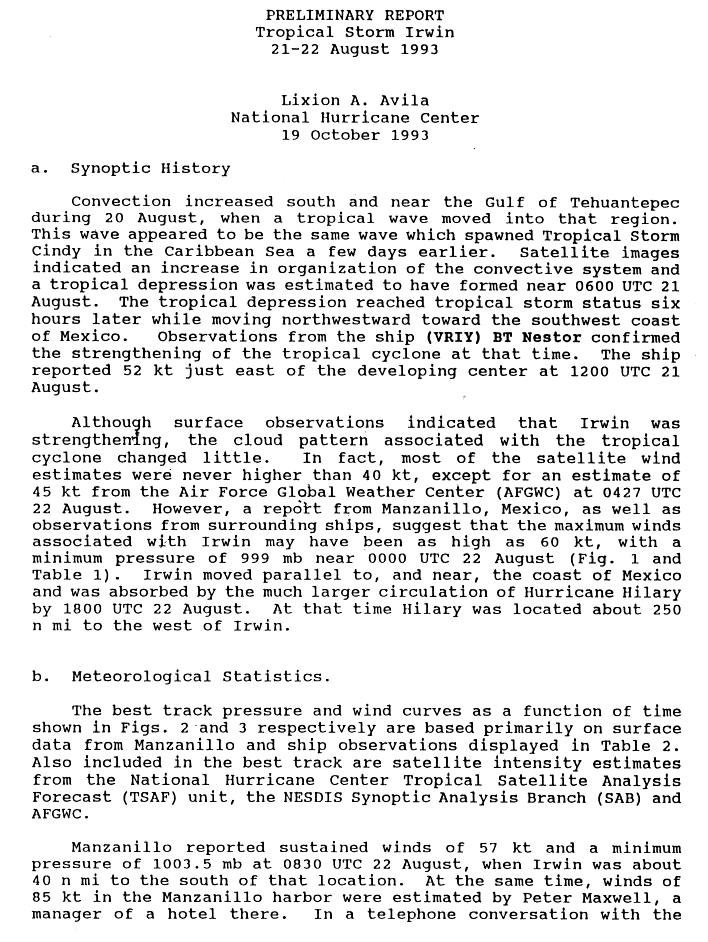
The most impactful storm of the season was Hurricane Calvin, which made landfall near Manzanillo in the Mexican state of Colima as a Category 2 hurricane; it killed more than 30 people, [nb 2] mainly due to significant flooding, and damages amounted to $32 million (1993 USD). [10] Two months later, Hurricane Lidia came ashore at a similar intensity farther to the northwest along the coast of Sinaloa, where it caused considerable damage and multiple fatalities. [nb 3] [3] In conjunction with a cold front, Lidia's remnants generated severe weather in Texas, including a tornado that caused $8 million (1993 USD) in damage. [12] Earlier in the season, Tropical Storm Beatriz killed 6 people in Mexico when it struck the southern portion of the country, [3] while Tropical Depression Three-E produced heavy rainfall that amounted to nearly a foot (12 in; 30.48 cm) in Acapulco despite remaining offshore. [13] Hurricane Hilary made three landfalls in Mexico – twice on the Baja California peninsula as a tropical storm, and then on the Mexican mainland as a tropical depression – but caused no loss of life and little damage. [14] Hurricanes Dora, Eugene, and Fernanda produced minor impacts in Hawaii; Eugene made landfall on the Big Island as a tropical depression, while Fernanda prompted the issuance of a hurricane warning, though this was discontinued when the storm turned away. [15]
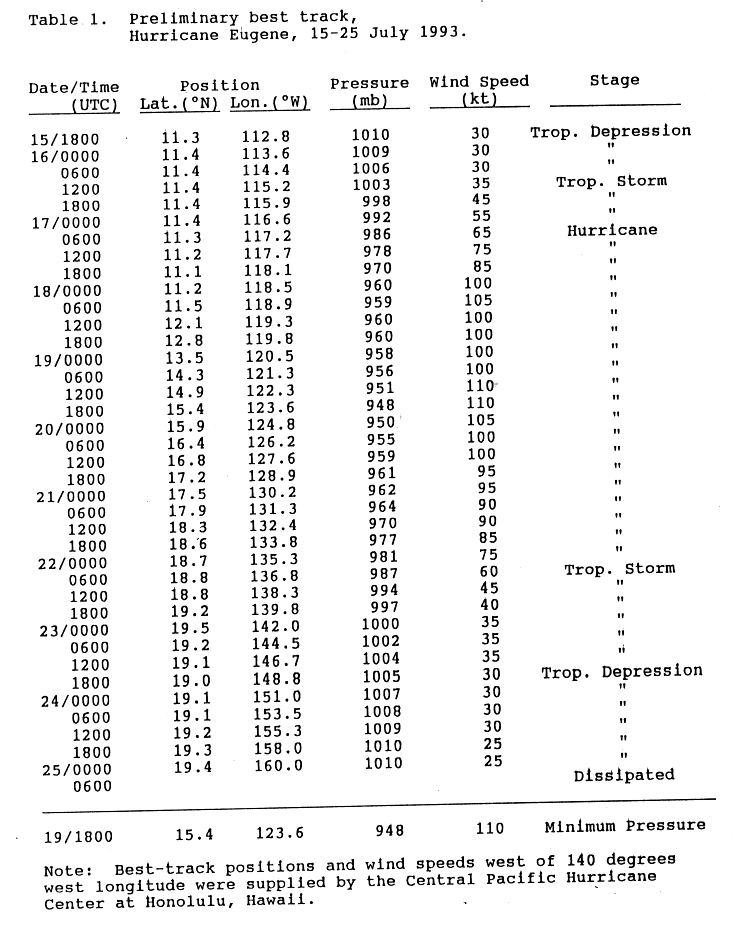
Prior to 2015, two time zones were utilized in the Eastern Pacific basin: Pacific east of 140°W, and Hawaii−Aleutian from 140°W to the International Date Line. [16] [17] For convenience, each event is listed in Coordinated Universal Time (UTC) first, using the 24-hour clock (where 00:00 = midnight UTC), [18] with the respective local time included in parentheses. Figures for maximum sustained winds and position estimates are rounded to the nearest five units (knots, miles, or kilometers) and averaged over one minute, following National Hurricane Center practice. Direct wind observations are rounded to the nearest whole number. Atmospheric pressures are listed to the nearest millibar and nearest hundredth of an inch of mercury. This timeline documents the formation of tropical cyclones as well as the strengthening, weakening, landfalls, extratropical transitions, and dissipations during the season. It includes information that was not released while the storm was active, meaning that data from post-storm reviews by the National Hurricane Center and the Central Pacific Hurricane Center is included.


