| Timeline of the 1997 Atlantic hurricane season | |||||
|---|---|---|---|---|---|
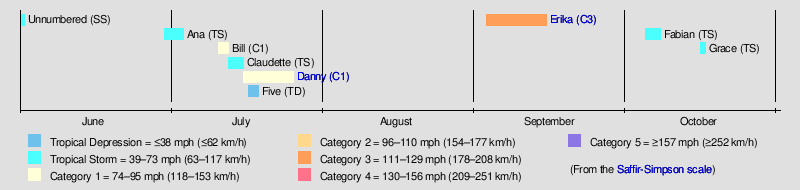
 Season summary map | |||||
| Season boundaries | |||||
| First system formed | June 1, 1997 | ||||
| Last system dissipated | October 17, 1997 | ||||
| Strongest system | |||||
| Name | Erika | ||||
| Maximum winds | 125 mph (205 km/h) (1-minute sustained) | ||||
| Lowest pressure | 946 mbar (hPa; 27.94 inHg) | ||||
| Longest lasting system | |||||
| Name | Erika | ||||
| Duration | 12.75 days | ||||
| |||||
The 1997 Atlantic hurricane season consisted of the events that occurred in the annual cycle of tropical cyclone formation over the Atlantic Ocean north of the equator. The official bounds of each Atlantic hurricane season are dates that conventionally delineate the period each year during which tropical cyclones tend to form in the basin according to the National Hurricane Center (NHC), beginning on June 1 and ending on November 30. However, tropical cyclogenesis is possible at any time of the year. [1] The first system was a subtropical storm that formed on June 1; the final system, Tropical Storm Grace, dissipated on October 17.
Contents
- Timeline of events
- June
- July
- August
- September
- October
- November
- Notes
- See also
- References
- External links
Though below average overall, [nb 1] the 1997 season had an unusually busy start. Through the end of July, six tropical or subtropical depressions developed, of which five became named storms [nb 2] and two strengthened further into hurricanes. At the time, Hurricane Danny was the earliest-forming fifth named storm in the Atlantic basin. [3] [4] After Danny dissipated, the season was exceptionally quiet. There was no tropical cyclone activity for the entire month of August, typically one of the basin's peak months – this was the first time since 1961, [5] and did not happen again until 2022. [6] Only three more systems formed for the remainder of the season: Hurricane Erika in September, which was the only Atlantic major hurricane in 1997; [nb 3] and two weak tropical storms in October. [5]
This timeline documents tropical cyclone formations, strengthening, weakening, landfalls, extratropical transitions, and dissipations during the season. It includes information that was not released throughout the season, meaning that data from post-storm reviews by the National Hurricane Center, such as a storm that was not initially warned upon, has been included.
The time stamp for each event is first stated using Coordinated Universal Time (UTC), the 24-hour clock where 00:00 = midnight UTC. [7] The NHC uses both UTC and the time zone where the center of the tropical cyclone is currently located. The time zones utilized (east to west) prior to 2020 were: Atlantic, Eastern, and Central. [8] In this timeline, the respective area time is included in parentheses. Additionally, figures for maximum sustained winds and position estimates are rounded to the nearest 5 units (miles, or kilometers), following National Hurricane Center practice. Direct wind observations are rounded to the nearest whole number. Atmospheric pressures are listed to the nearest millibar and nearest hundredth of an inch of mercury.