Hurricane Sam was a powerful and long-lived tropical cyclone that threatened Bermuda,lasting from September 22 through October 7,2021. It was the fifth longest-lasting intense Atlantic hurricane,as measured by accumulated cyclone energy,since reliable records began in 1966.[1] Sam was the eighteenth named storm,seventh hurricane,and fourth major hurricane[nb 1] of the 2021 Atlantic hurricane season.
Sam originated from a tropical wave that departed from the western coast of Africa on September 19. The system developed into a tropical depression on September 22,as upper-level winds gradually became more favorable. Intensification was initially slow,with the depression strengthening into Tropical Storm Sam a day later. Soon afterward,the structure of the cyclone quickly improved and rapid intensification began. Sam strengthened into a hurricane on September 24,and reached Category 4 status late on September 25. Sam peaked on September 26 as a high-end Category 4 hurricane,with maximum sustained winds of 155mph (249km/h) and a minimum central pressure of 927mbar (27.4inHg). The storm turned towards the northwest early on September 27,as it began to weaken due to an eyewall replacement cycle. The hurricane weakened to Category 3 intensity later that day,as its structure decayed. Sam regained Category 4 status early on September 28. Another eyewall replacement cycle on September 29 disrupted the storm once more.
A tropical storm watch was issued for Bermuda on September 30,due to the potential for tropical storm conditions. The watch was upgraded to a tropical storm warning later that day. Sam began to strengthen again on September 30,as the eyewall replacement cycle concluded. Sam reached a secondary peak on October 1,with winds of 150mph (240km/h) and a pressure of 934mbar (27.6inHg). Around that time,the storm began a northward track. The hurricane began to weaken on October 2,as a result of increasing vertical wind shear and cooler sea surface temperatures. Sam finally dropped below major hurricane status on October 3,after nearly eight days. It had remained a major hurricane longer than any Atlantic system since Hurricane Ivan in 2004.[1] The storm moved east-northeastward to northeastward,and then northward,with increasing forward speed while gradually losing strength,weakening to Category 1 status the following day. Sam completed its transition into an extratropical cyclone on October 5,after which its remnants meandered over the northern Atlantic,near Iceland and Greenland,before being absorbed by another extratropical system on October 7.
Meteorological history
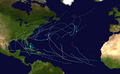
Map plotting the storm's track and intensity,according to the Saffir–Simpson scale
Hurricane Sam originated from a westward tracking tropical wave that departed from the western coast of Africa on September 19.[3] The National Hurricane Center (NHC) had first forecast the possibility of tropical development earlier that day.[4] Although thunderstorm activity was somewhat organized, the system lacked a closed surface circulation. Upper-level winds hindered the development of the system over the next day,[5][6] causing fluctuations in organization.[7][8] Thunderstorms became increasingly organized,[9] and an elongated low-level surface circulation developed on September 22. This led to the formation of a tropical depression around 21:00 UTC that day. At that time, a mid-level ridge located to the north and west was steering the system westward. The nascent depression was located in a favorable environment both below and aloft, with sea surface temperatures of 82–84°F (28–29°C) and low vertical wind shear.[10]
Intensification was initially slow; the cyclone's center was still attached to the northern edge of a low-pressure trough and the former's surface circulation was only narrowly closed.[11] Although the depression had curved rainbands across its northern and western sides, dry air was entraining across its eastern flank.[12] The depression was upgraded to Tropical Storm Sam at 15:00 UTC on September 23, after its structure improved significantly on both satellite and microwave imagery; the latter showed a banding feature wrapping around 75 percent of the center. The combination of a favorable environment, Sam's structural improvement, and the alignment of the cyclone's low- and mid-level centers signaled that rapid intensification was imminent.[13] The storm rapidly intensified shortly after, with an eyewall forming on microwave imagery,[14] as well as, banding features that wrapped around most of its center. Sam became a Category 1 hurricane around 09:00 UTC on September 24.[15]
Sam's strengthening then halted for a brief period as dry air degraded the western portion of its core.[16] The cyclone began to intensify again late on September 24 as the dry air's influence lessened, however, microwave imagery displayed concentric eyewalls, indicating that Sam was undergoing an eyewall replacement cycle. The storm continued to track west-northwest, however, its forward speed began to decrease as a result of the mid-level ridge moving to the northwest of Sam.[17] A small, 12-mi (19-km) wide eye emerged on infrared satellite imagery early on September 25, surrounded by a symmetric ring of cold, −94°F (−70°C) cloud tops.[18][19] Sam was upgraded to a Category 3 major hurricane at 15:00 UTC on September 25, after its eye became mostly cloud-free.[20] The cyclone further strengthened to Category 4 status by 21:00 UTC.[21] A NOAAHurricane Hunters reconnaissance aircraft surveying the storm later that day indicated that multiple mesovortices, including some tornadic-scale ones, were present in both the southeastern and northwestern portions of the eyewall; the wind directions were entirely opposite to the normal wind direction in some regions. Radar from the aircraft displayed that dry air was entraining into the storm, thinning the eyewall in numerous locations.[22] The hurricane continued to intensify through September 26, with the NHC estimating that Sam's peak probably occurred between 19:00 and 22:00UTC, likely attaining maximum sustained winds of 155mph (250km/h) and a minimum central pressure of 927mbar (27.4inHg). During that time, the eye had shrunk to a diameter of 8 miles (13km),[23] and the cold convection surrounding the eye had grown in size. Likewise, a microwave pass showed a compact, strong eyewall surrounding the small eye. Sam became only the second Category 4 or 5 hurricane on record so far east or south in the Atlantic so late in the year; the first being Lorenzo in 2019.[24] Despite Sam's intensity, it remained a small storm, with tropical storm-force winds reaching out 80 miles (130km) from its center.[25]
Eyewall replacement cycles, threat to Bermuda, and secondary peak
Hurricane Sam at its secondary peak on October 1
A subtropical ridge located to the north and northeast of Sam caused it to begin tracking northwestward early on September 27. At the same time, a second eyewall replacement cycle was causing the cyclone to weaken. The storm's eye had doubled in size and was cloud-filled while convection in the eyewall was irregular and had degraded across Sam's eastern side.[23] Soon after, Sam's eye disappeared entirely from infrared and visible satellite imagery as a result of the replacement cycle and mid-level dry air intrusions from the west.[26][27] The cyclone weakened to Category 3 status around 15:00 UTC,[27] and bottomed out at 120mph (190km/h) around 21:00 UTC. By that time, a new eye had emerged on satellite imagery, surrounded by a ring of −85°F (−65°C) cloud tops.[28] A reconnaissance aircraft found that the cyclone's wind field had increased following the eyewall replacement cycle,[29] with the radius of hurricane-force winds expanding to 40 miles (64km) and the radius of tropical-storm-force winds increasing to 125 miles (201km).[30][31]
Sam restrengthened into a Category 4 hurricane around 09:00 UTC on September 28, after a ring of colder clouds formed around its eye. The concentric eyewalls that were priorly apparent had fused together in a single eyewall.[29][32] Later that day, the storm's structure degraded, with its eye becoming less pronounced in satellite imagery. Upper-level outflow was reduced in Sam's southwestern region as a result of impinging mid-level dry air, and multiple arcus clouds were radiating outward from the western side of the storm.[33] Sam strengthened to 140mph (230km/h) early on September 29, while its eye warmed and convection in its eyewall cooled.[34] Shortly after, the cyclone experienced slight weakening as a result of moderate southwesterly wind shear, with Sam's eye becoming cloud-filled and the circulation slanting along the southwest-to-northeast. However, the convection surrounding the eye had cooled.[35] Later that day, Sam's overall cloud pattern had improved, however, a Hurricane Hunters reconnaissance aircraft reported that another eyewall replacement cycle was underway.[36][37]
The Bermuda Weather Service issued a tropical storm watch for Bermuda at 09:00 UTC on September 30 due to the potential for the cyclone to bring tropical storm conditions to the island.[38] The watch was increased to a tropical storm warning at 21:00 UTC.[39] Early on September 30, Sam began another strengthening trend as the eyewall replacement cycle concluded, located over a warm ocean eddy and within a region of low wind shear.[40] The cyclone exhibited a warm 50–68°F (10–20°C), 29-mi (46-km) wide eye surrounded by cold, −76 to −94°F (−60 to −70°C) cloud tops from September 30–October 1.[41][42] Early on October 1, Sam turned towards the north-northwest as it began to round the western edge of the subtropical ridge.[42] Sam reached its secondary peak around 09:00 UTC, with maximum sustained winds of 150mph (240km/h) and a minimum central pressure of 934mbar (27.6inHg).[43]
Weakening and demise
Sam as an extratropical cyclone on October 6
The cyclone maintained its intensity for about 12 hours as it tracked northward.[44][45] The storm maintained a symmetric, well-defined eye, and multiple mesovorticies were apparent in satellite images.[45] Sam began to weaken on October 2, with its eye becoming cloud-filled.[46] During the next several hours, the cyclone turned towards the northeast under the influence of a steering flow between a sizeable low-pressure system located over Atlantic Canada and a deep-layer ridge located to the east and northeast of Sam.[46][47] Moderate southerly deep-layer shear continued to weaken the system,[48] with Sam falling to Category 3 intensity by 21:00 UTC.[49] The hurricane's eye disappeared from satellite imagery and its cloud tops warmed to −76 to −85°F (−60 to −65°C) on October 3.[50][51] Sam bottomed out as a low-end Category 2 hurricane later that day.[52] The cyclone began another eyewall replacement late on October 3, as it crossed into sub-79°F (26°C) sea surface temperatures. Sam's wind field continued to grow, with tropical-storm-force winds extending up to 230 mi (370 km) out from the center on all four sides.[53]
Sam strengthened slightly as it moved across a warm eddy early on October 4. The storm's inner eyewall became more intense and its eye cleared.[54] The cyclone moved across colder sea surface temperatures shortly after and resumed weakening. The inner eyewall quickly decayed on the northwestern side.[55] Sam weakened to a Category 1 hurricane around 21:00 UTC as its cloud tops warmed and its eye vanished from satellite imagery.[56][57] Sam began to transition to extratropical cyclone shortly after, with its cloud pattern broadening on the northwestern side and convection decreasing.[58]
At 09:00UTC on October 5, Sam became fully extratropical as it traversed 57°F (14°C) waters, and the NHC issued its final advisory on the storm. Sam's low-level circulation center was exposed on the southern edge of a −58°F (−50°C) cloud band. The cyclone had developed the appearance of an occluded extratropical system. Although its core remained warm in the middle and upper levels, the lower level consisted of cold stratocumulus clouds.[59] For the next few days, Sam executed a short counterclockwise loop, before continuing its northeastward motion, while gradually weakening.[60][61][62] Early on October 7, the post-tropical cyclone merged with another extratropical low over the north Atlantic. Afterward, this new low made a large counterclockwise loop between Iceland and Greenland, before being absorbed by a stronger low on October 9, to the southwest of Iceland.[62][63] This low then accelerated eastward while rapidly weakening, passing just south of Iceland, before being absorbed by another extratropical cyclone over Scandinavia on October 12.[64][65][66]
Impact and records
While passing northeast of Puerto Rico, light winds associated with Sam's circulation interacted with the typically moist environment and, in conjunction with the normal diurnal cycle, produced locally heavy rainfall on the island on September28–29. Some street flooding occurred along roads with poor drainage and several mudslides were reported in western communities.[67][68][69] Large swells produced by the hurricane affected portions of the Lesser Antilles through late-September.[70] Although Sam remained more than 900mi (1,400km) from the mainland United States, its circulation produced dangerous swells across the Eastern seaboard.[71] Thirty people required rescue from rip currents in New Hanover County, North Carolina. However, there were no injuries or fatalities.[72] In Bermuda, tropical storm warnings and watches were raised on September30 and remained in effect until October2. Although the core of Sam remained east of the territory,[73] its broadening wind field brought tropical storm-force winds to the area.[74] Sustained winds of 25–44mph (40–71km/h) were measured, with the strongest occurring at higher elevations. A peak gust of 53mph (85km/h) was measured at the National Museum of Bermuda. Rainfall during the storm's passage was negligible.[73]
Sam remained a major hurricane for 7.75 days, which was longer than any other Atlantic system this season, and the longest since Hurricane Ivan in 2004.[1][73] Sam's total ACE of 53.8 was the highest for any Atlantic named storm in 2021,[75] and 5th highest overall since 1966.[1]
↑Papin, Philippe (23 September 2021). Tropical Storm Sam Discussion Number 4 (Report). National Hurricane Center. Archived from the original on 24 September 2021. Retrieved 6 October 2021.
↑Cangialosi, John (24 September 2021). Hurricane Sam Discussion Number 7 (Report). National Hurricane Center. Archived from the original on 25 September 2021. Retrieved 6 October 2021.
↑Papin, Philippe (24 September 2018). Hurricane Sam Discussion Number 8 (Report). National Hurricane Center. Archived from the original on 24 September 2021. Retrieved 6 October 2021.
↑Papin, Philippe (24 September 2021). Hurricane Sam Discussion Number 9 (Report). National Hurricane Center. Archived from the original on 5 October 2021. Retrieved 6 October 2021.
↑Berg, Robbie (25 September 2021). Hurricane Sam Discussion Number 10 (Report). National Hurricane Center. Archived from the original on 25 September 2021. Retrieved 6 October 2021.
↑Cangialosi, John (25 September 2021). Hurricane Sam Discussion Number 11 (Report). National Hurricane Center. Archived from the original on 6 October 2021. Retrieved 6 October 2021.
↑Latto, Andrew (25 September 2021). Hurricane Sam Discussion Number 12 (Report). National Hurricane Center. Archived from the original on 27 September 2021. Retrieved 6 October 2021.
↑Beven, Jack (25 September 2021). Hurricane Sam Discussion Number 13 (Report). National Hurricane Center. Archived from the original on 25 September 2021. Retrieved 7 October 2021.
↑Stewart, Stacy (26 September 2021). Hurricane Sam Discussion Number 14 (Report). National Hurricane Center. Archived from the original on 6 October 2021. Retrieved 7 October 2021.
12Stewart, Stacy (27 September 2021). Hurricane Sam Discussion Number 18 (Report). National Hurricane Center. Archived from the original on 27 September 2021. Retrieved 27 September 2021.
↑Latto, Andrew (26 September 2021). Hurricane Sam Discussion Number 17 (Report). National Hurricane Center. Archived from the original on 6 October 2021. Retrieved 8 October 2021.
↑Reinhart, Brad (27 September 2021). Hurricane Sam Discussion Number 19 (Report). National Hurricane Center. Archived from the original on 6 October 2021. Retrieved 10 October 2021.
12Hagen, Andrew; Pasch, Richard (27 September 2021). Hurricane Sam Discussion Number 20 (Report). National Hurricane Center. Archived from the original on 5 October 2021. Retrieved 10 October 2021.
↑Latto, Andrew (27 September 2021). Hurricane Sam Discussion Number 21 (Report). National Hurricane Center. Archived from the original on 1 October 2021. Retrieved 10 October 2021.
12Blake, Eric (28 September 2021). Hurricane Sam Discussion Number 22 (Report). National Hurricane Center. Archived from the original on 5 October 2021. Retrieved 10 October 2021.
↑Latto, Andrew (27 September 2021). Hurricane Sam Advisory Number 21 (Report). National Hurricane Center. Archived from the original on 5 October 2021. Retrieved 10 October 2021.
↑Blake, Eric (28 September 2021). Hurricane Sam Advisory Number 22 (Report). National Hurricane Center. Archived from the original on 28 September 2021. Retrieved 10 October 2021.
↑Reinhart, Brad (28 September 2021). Hurricane Sam Discussion Number 23 (Report). National Hurricane Center. Archived from the original on 1 October 2021. Retrieved 10 October 2021.
↑Pasch, Richard (28 September 2021). Hurricane Sam Discussion Number 25 (Report). National Hurricane Center. Archived from the original on 5 October 2021. Retrieved 10 October 2021.
↑Blake, Eric (29 September 2021). Hurricane Sam Discussion Number 26 (Report). National Hurricane Center. Archived from the original on 5 October 2021. Retrieved 10 October 2021.
↑Brown, Daniel (29 September 2021). Hurricane Sam Discussion Number 27 (Report). National Hurricane Center. Archived from the original on 5 October 2021. Retrieved 10 October 2021.
↑Pasch, Richard (29 September 2021). Hurricane Sam Discussion Number 28 (Report). National Hurricane Center. Archived from the original on 6 October 2021. Retrieved 10 October 2021.
↑Pasch, Richard (29 September 2021). Hurricane Sam Discussion Number 29 (Report). National Hurricane Center. Archived from the original on 6 October 2021. Retrieved 10 October 2021.
↑Brown, Daniel (30 September 2021). Hurricane Sam Advisory Number 31 (Report). National Hurricane Center. Archived from the original on 30 September 2021. Retrieved 10 October 2021.
↑Pasch, Richard (30 September 2021). Hurricane Sam Advisory Number 33 (Report). National Hurricane Center. Archived from the original on 6 October 2021. Retrieved 10 October 2021.
↑Blake, Eric (30 September 2021). Hurricane Sam Discussion Number 30 (Report). National Hurricane Center. Archived from the original on 1 October 2021. Retrieved 11 October 2021.
↑Pasch, Richard (30 September 2021). Hurricane Sam Discussion Number 33 (Report). National Hurricane Center. Archived from the original on 1 October 2021. Retrieved 11 October 2021.
12Papin, Philippe (1 October 2021). Hurricane Sam Discussion Number 34 (Report). National Hurricane Center. Archived from the original on 5 October 2021. Retrieved 11 October 2021.
↑Berg, Robbie (1 October 2021). Hurricane Sam Discussion Number 35 (Report). National Hurricane Center. Archived from the original on 1 October 2021. Retrieved 11 October 2021.
↑Cangialosi, John; Nepaul, Heather (1 October 2021). Hurricane Sam Discussion Number 36 (Report). National Hurricane Center. Archived from the original on 6 October 2021. Retrieved 25 October 2021.
12Cangialosi, John; Nepaul, Heather (1 October 2021). Hurricane Sam Discussion Number 37 (Report). National Hurricane Center. Archived from the original on 5 October 2021. Retrieved 25 October 2021.
12Beven, Jack (2 October 2021). Hurricane Sam Discussion Number 38 (Report). National Hurricane Center. Archived from the original on 3 October 2021. Retrieved 25 October 2021.
↑Blake, Eric (2 October 2021). Hurricane Sam Discussion Number 40 (Report). National Hurricane Center. Archived from the original on 5 October 2021. Retrieved 25 October 2021.
↑Berg, Robbie (2 October 2021). Hurricane Sam Discussion Number 39 (Report). National Hurricane Center. Archived from the original on 6 October 2021. Retrieved 25 October 2021.
↑Blake, Eric (2 October 2021). Hurricane Sam Discussion Number 41 (Report). National Hurricane Center. Archived from the original on 5 October 2021. Retrieved 25 October 2021.
↑Beven, Jack (3 October 2021). Hurricane Sam Discussion Number 42 (Report). National Hurricane Center. Archived from the original on 5 October 2021. Retrieved 25 October 2021.
↑Stewart, Stacy (3 October 2021). Hurricane Sam Discussion Number 43 (Report). National Hurricane Center. Archived from the original on 5 October 2021. Retrieved 25 October 2021.
↑Brown, Daniel (3 October 2021). Hurricane Sam Discussion Number 44 (Report). National Hurricane Center. Archived from the original on 5 October 2021. Retrieved 25 October 2021.
↑Latto, Andrew (3 October 2021). Hurricane Sam Discussion Number 45 (Report). National Hurricane Center. Archived from the original on 5 October 2021. Retrieved 25 October 2021.
↑Blake, Eric (4 October 2021). Hurricane Sam Discussion Number 46 (Report). National Hurricane Center. Archived from the original on 4 October 2021. Retrieved 26 October 2021.
↑Stewart, Stacy (4 October 2021). Hurricane Sam Discussion Number 47 (Report). National Hurricane Center. Archived from the original on 26 October 2021. Retrieved 26 October 2021.
↑Brown, Daniel (4 October 2021). Hurricane Sam Discussion Number 48 (Report). National Hurricane Center. Archived from the original on 5 October 2021. Retrieved 26 October 2021.
↑Brown, Daniel (4 October 2021). Hurricane Sam Discussion Number 49 (Report). National Hurricane Center. Archived from the original on 4 October 2021. Retrieved 26 October 2021.
↑Blake, Eric (5 October 2021). Hurricane Sam Discussion Number 50 (Report). National Hurricane Center. Archived from the original on 5 October 2021. Retrieved 26 October 2021.
↑"[Puerto Rico Event Report: Flood]". National Centers for Environmental Information. National Weather Service Forecast Office in San Juan, Puerto Rico. 2021. Retrieved March 27, 2022.
↑"[Puerto Rico Event Report: Debris Flow]". National Centers for Environmental Information. National Weather Service Forecast Office in San Juan, Puerto Rico. 2021. Retrieved March 27, 2022.
↑"[Puerto Rico Event Report: Debris Flow]". National Centers for Environmental Information. National Weather Service Forecast Office in San Juan, Puerto Rico. 2021. Retrieved March 27, 2022.
↑"[North Carolina Event Report: Rip Current]". National Centers for Environmental Information. National Weather Service Forecast Office in Wilmington, North Carolina. 2021. Retrieved March 27, 2022.
123Pasch, Richard; Roberts, David (March 18, 2022). Hurricane Sam (AL182021)(PDF) (Report). Tropical Cyclone Report. National Hurricane Center. Retrieved March 27, 2022.
This page is based on this Wikipedia article Text is available under the CC BY-SA 4.0 license; additional terms may apply. Images, videos and audio are available under their respective licenses.


