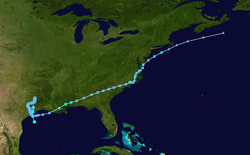
The 2001 Atlantic hurricane season was a fairly active Atlantic hurricane season that produced 17 tropical cyclones, 15 named storms, nine hurricanes, and four major hurricanes. The season officially lasted from June 1 to November 30, dates which by convention limit the period of each year when tropical cyclones tend to form in the Atlantic Ocean basin. The season began with Tropical Storm Allison on June 4, and ended with Hurricane Olga, which dissipated on December6.
The most damaging storms of the season were Allison, which caused extensive flooding in Texas; Hurricane Iris, which struck Belize; and Hurricane Michelle, which left a trail of destruction across Cuba. Three tropical cyclones made landfall in the United States, three directly affected Canada, and three directly affected Mexico and Central America. Overall, the season caused 153 fatalities, and $11.44 billion (2001 USD) in damage. Due to their severe damage, the names Allison, Iris, and Michelle were retired by the World Meteorological Organization.
Similar to the previous season, of the three cyclones (Allison, Barry, and Gabrielle) that made landfall in the United States, none achieved higher than tropical storm status.
Seasonal forecasts
Predictions of tropical activity in the 2001 season
Gray's team defined the average number of storms per season (1950 to 2000) as 9.6tropical storms, 5.9hurricanes, 2.3major hurricanes (storms reaching at least Category3 strength in the Saffir-Simpson Hurricane Scale) and ACE Index 96.1.[8] The National Oceanic and Atmospheric Administration (NOAA) defines a season as above-normal, near-normal or below-normal by a combination of the number of named storms, the number reaching hurricane strength, the number reaching major hurricane strength and ACE Index.[9]
Pre-season forecasts
On December 7, 2000, Gray's team issued its first extended-range forecast for the 2001 season, predicting above-average activity (13 named storms, 8 hurricanes, and about 4 of Category 3 or higher). It listed a 63 percent chance of at least one major hurricane striking the U.S. mainland. This included a 43 percent chance of at least one major hurricane strike on the East Coast, including the Florida peninsula, and a 36 percent chance of at least one such strike on the Gulf Coast from the Florida Panhandle westward. The potential for major hurricane activity in the Caribbean was forecast to near average.[1]
On April 5, 2001, a new forecast was issued, calling for 12 named storms, 7 hurricanes, and 3 major hurricanes. The increase in the forecast was attributed to the warm sea surface temperatures, although the agency noted that the season would likely not be as active as previous ones due to the effect of a weak to moderate El Nino. The estimated potential for at least one major hurricane to affect the U.S. was upped slightly to 65 percent; the East Coast potential also went up slightly, and from the Florida Panhandle westward to Brownsville, Texas, the probability remained nearly the same.[4]
Mid-season forecasts
On August 7, 2001, Gray's team issued their first mid-season forecast for the 2001 season, keeping the forecast number at 12 named storms, with 7 becoming hurricanes and 3 becoming a major hurricane, noting that sea surface temperatures and sea level pressures continued to be favorable for above-average hurricane activity. The estimated potential for at least one major hurricane to affect the U.S. was upped slightly once again to 69 percent; the East Coast potential also went up slightly to 50%, and from the Florida Panhandle westward to Brownsville, Texas, the probability was also upped slightly.[6]
On August 8, 2001, NOAA revised its season estimate slightly upwards to nine to twelve named storms, of which 6 to 8 were to be hurricanes, and 2 to 4 major hurricanes. The agency noted that sea surface temperatures continued to be favorable for above-average hurricane activity, and due to the likelihood that El Nino would not develop during the peak of the season, there was a reduced likelihood of a below-average year.[7]
The Atlantic hurricane season officially began on June1, 2001.[10] It was an above-average season in which 17tropical cyclones formed. Fifteen depressions attained tropical storm status, and nine of these reached hurricane status. Four hurricanes further intensified into major hurricanes.[11] Favorable sea surface temperatures and sea-level pressures were the main factors in the season being above-average.[6] The season was the fourth, and final, above-average season in a row. This streak set a record that stood until six consecutive seasons featured above-average activity from 2016 to 2021.[12] Four tropical cyclones during the season would degenerate in the deep tropics but later re-develop. Four other systems were classified as subtropical cyclones at some point in their duration, though each later became fully tropical systems.[13] Overall, the Atlantic tropical cyclones of 2001 collectively resulted in 153deaths and around $11.94billion in damage.[14] The season ended on November30, 2001.[10]
Tropical cyclogenesis began in June, with Tropical Storm Allison forming just offshore Texas on June5. After Allison transitioned into an extratropical cyclone on June17, no further activity occurred until Tropical Depression Two developed on July11. However, the depression dissipated the following day. Another break in activity ensued, which ended on August2, when Tropical Storm Barry formed in the Gulf of Mexico. August featured two other tropical storms, Chantal and Dean.
Five systems formed in September, of which four become a hurricane, while one remained a tropical depression. October featured an equal number of systems, of which all five attained at least tropical storm intensity. One, Hurricane Iris, attained the highest sustained winds of any storm in 2001, at 145mph (230km/h), and devastated southern Belize on October9. Another, Hurricane Michelle, attained the lowest barometric pressure of any storm that year, at 933mbar (27.55inHg), and cut a path of destruction across Cuba on November4. Two additional systems developed in November, Hurricane Noel and Hurricane Olga. Olga dissipated on December4, ending seasonal activity.[11]
The season's activity was reflected with an accumulated cyclone energy (ACE) rating of 110,[15] above the 1950–2000 average of 96.1.[8] ACE is, broadly speaking, a measure of the power of the hurricane multiplied by the length of time it existed, so storms that last a long time, as well as particularly strong hurricanes, have high ACEs. It is only calculated for full advisories on tropical systems at or exceeding 39mph (63km/h), which is the threshold for tropical storm status.[15]
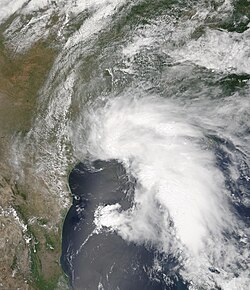
A tropical wave over the northwestern Gulf of Mexico developed into Tropical Storm Allison at 12:00UTC on June5 about 140mi (225km) south of Galveston, Texas. The cyclone strengthened and peaked six hours later with winds of 60mph (95km/h) and a minimum atmospheric pressure of 1,000mbar (30inHg). At 21:00UTC on June5, Allison made landfall near Freeport, Texas. It drifted northward through the state, turned to the south, and re-entered the Gulf of Mexico as a tropical depression on June10. Allison then transitioned into a subtropical depression. The storm continued towards the east-northeast, made landfall on Louisiana early on June11, and briefly became a subtropical storm despite being inland. Crossing the southeast United States and Mid-Atlantic, Allison emerged into the Atlantic at the Delmarva Peninsula on June17. After temporarily re-attaining subtropical storm status, Allison interacted with a cold front offshore New England and became extratropical. Early on June19, the remnant extratropical low dissipated near Nova Scotia.[16]
Allison was the first storm since Tropical Storm Frances in 1998 to affect the northern Texas coastline.[17] A major flood disaster occurred throughout its path and nearby areas from Texas to New England. The Greater Houston area of Texas suffered the brunt of the impact, as over 35in (890mm) of rain fell there when Allison stalled over the southeastern part of the state.[16] In this area, flooding related to Allison destroyed or severely damaged more than 14,000homes,[16] while at least 51,430others experienced some degree of damage. Floodwaters also entered over 95,000vehicles and 1,700businesses.[18] The storm killed 41people, including 27 who drowned. Overall, Allison caused about $8.5billion in damage (2001USD), making it the costliest and second-deadliest tropical storm on record in the United States.[16][19]
A tropical wave emerged into the Atlantic from the west coast of Africa on July7. Moving westward, the system displayed signs of a weak low-level circulation beginning on July10, and after deep convection formed on the following day, a tropical depression developed around 18:00UTC about 1,150mi (1,850km) east of the Windward Islands. A subtropical ridge north of the depression caused it to move west-northwestward at roughly 17mph (27km/h). Vertical wind shear prevented the cyclone from intensifying beyond sustained winds of 30mph (45km/h) and an atmospheric pressure of 1,010mbar (30inHg), with dissipation occurring late on July12 approximately 690mi (1,110km) east of the Windward Islands. The remnant tropical wave reached the Lesser Antilles on July13 and July14.[20]
On July 24, a tropical wave moved off the coast of Africa and tracked westward. The wave entered the Caribbean Sea on July 29 and gained in organization and convection, before reaching the Gulf of Mexico on August1. By the following day, a tropical depression developed about 200mi (320km) west-northwest of Key West, Florida, and soon strengthened into Tropical Storm Barry. After fluctuations in intensity, including when it weakened to a tropical depression on August4, the system attained peak winds of 70mph (110km/h) in the Gulf of Mexico late on August5. Around 05:00UTC on the next day, Barry made landfall near Santa Rosa Beach, Florida, at the same intensity. The storm weakened to a tropical depression over southern Alabama about seven hours later, before degenerating into a remnant low over Mississippi early on August7. The remnant low continued north-northwestward until dissipating over Missouri on August8.[21]
The tropical wave that developed into Barry generated rough seas over the Straits of Florida, capsizing a boat of Cuban refugees, six of whom drowned.[21] Barry's precursor also dropped heavy rain over South Florida, peaking at 11.7in (300mm) near Stuart,[22] damaging about 300homes in Martin County, 69severely.[23] In the Florida Panhandle, rainfall reached 8.9in (230mm) in Tallahassee, and winds gusts topped out at 79mph (127km/h).[21] Winds caused damage to some homes and downed trees, while floodwaters inundated streets and entered some cars and structures.[24][25] Three people in Florida were killed by the storm, and total damage is estimated at $30million (2001USD). Several other states in the South reported rainfall.[21]
A westward-moving tropical wave organized into a tropical depression about 1,500mi (2,400km) east of the Windward Islands on August14. The depression moved rapidly westward and degenerated into an open wave sometime on August16 while still well east of the Windward Islands. However, after reaching the southeast Caribbean, a circulation re-developed while the system was situated 290mi (470km) south of Saint Croix on August17. With tropical storm-force winds, the system was reclassified as Tropical Storm Chantal. The cyclone strengthened to reach sustained winds of 70mph (110km/h) twice in the Caribbean; Chantal's atmospheric pressure also fell to 997mbar (29.4inHg) on August19. Early on August21, Chantal made landfall near the Belize–Mexico border with winds of 70mph (110km/h). The cyclone weakened to a tropical depression over Campeche on August22, before dissipating over Tabasco several hours later.[26]
The tropical wave associated with Chantal caused two deaths in Trinidad due to a lightning strike. In Belize, abnormally high tides along the coast damaged piers and seawalls. The storm produced a wind gust of 71mph (114km/h) in Caye Caulker, although stronger winds were possible in a convective band to the north. Winds and flooding due to heavy rainfall left damage to agricultural and infrastructural sectors. Overall, Belize suffered nearly $4million in damage.[26] Heavy rain fell in parts of Mexico, particularly in Quintana Roo, with up to 20.03in (509mm) observed at Othón P. Blanco.[22] This led to mudslides, leaving some areas isolated.[27]
A tropical wave exited western Africa between August 14–15. Moving westward, the wave gradually developed thunderstorms,[28] although unfavorable upper-level wind shear prevented rapid development.[29] Late on August 21, the wave passed through the northern Lesser Antilles,[28] and the convection became better organized after the wind shear dropped.[30] On August22, Tropical Storm Dean developed near Saint Croix, reaching winds of 60mph (95km/h) later that day. It moved quickly northwestward due to a ridge to its northeast. Strong wind shear caused the circulation to dissipate on August23, east of the Bahamas.[28][31] The remnants of Dean turned to the north, and became embedded within a large mid-level trough off the East Coast of the United States.[28] Convection increased around the system early on August 24 and gradually became more organized.[32][33] The disturbance passed west of Bermuda early on August 25, and subsequently turned to the northeast. The remnants of Dean redeveloped into a tropical depression on August 26, about 220 miles (350km) north of Bermuda. It soon restrengthened into a tropical storm,[28] which developed an eye feature in the convection.[34] Dean reached peak winds of 70mph (110km/h) late on August 27 while located about 465 miles (748km) southwest of Cape Race, Newfoundland.[35] Weakening over cooler waters, Dean became extratropical on August 28 about 145 miles (233km) east-southeast of Cape Race, Newfoundland. The extratropical storm continued northeastward until being absorbed by a frontal low on August 29.[28]
The precursor disturbance to Dean dropped heavy rainfall on Saint Martin of around 5 inches (130mm).[36] In the United States Virgin Islands, the precursor disturbance produced 1.07 inches (27mm) of rain in Saint Thomas, with gusts to 48mph (77km/h).[28] Power outages occurred throughout the territory. There was minor flooding on Saint Croix. Some roads were damaged in Saint John.[37] Dean dropped heavy rainfall across Puerto Rico, peaking at 12.7 inches (320mm) in Salinas. Damage across the island totaled $7.7million. Wind gusts reached 36mph (58km/h) at Roosevelt Roads Naval Station. The passage of Dean resulted in widespread flooding in eastern and southern Puerto Rico, collapsing two bridges and one road. Several highways were under water, and one car was swept away by the floodwaters, although the four occupants were rescued. Throughout the island, about 1,320houses were flooded, and two houses experienced collapsed roofs.[38] Additionally, over 16,000households lost electricity and more than 130people fled low-lying areas as rivers swelled. Two people were injured in Peñuelas, and three were injured in Nagüabo when the ceiling of a day care center collapsed. 17flights were canceled, and a cruise line altered its path.[39][38] The remnants of Dean produced unsettled conditions across Bermuda, including a wind gust of 41mph (66km/h) and light rainfall of 0.31 inches (7.9mm).[40] In Newfoundland, Dean produced wind gusts of 63mph (101km/h), with a peak rainfall of 4.2 inches (110mm).[41]
A tropical wave moved off the coast of Africa on August 30. It quickly showed signs of organization, with curved rainbands and deep convection. Late on September 1, Tropical Depression Six developed about 1,600 miles (2,600km) east of the Lesser Antilles.[42] The depression moved to the west-northwest, steered by a ridge to the north. On September2, it strengthened into Tropical Storm Erin, despite the presence of wind shear. Erin reached an initial peak intensity of 60mph (97km/h) on September3. An increase in wind shear caused Erin to weaken back to tropical depression status on September5, causing the circulation to dissipate.[42] The remnants continued to the northwest, and Erin redeveloped into a tropical depression late on September6, about 365 miles (587km) north-northwest of where it previously dissipated. It regained tropical storm status on September7,[42] and it became better organized.[43] On September 9, Erin intensified into a hurricane while located 104 miles (167km) east-northeast of Bermuda,[42] and a 40-mile (64km) wide eye developed.[44] Erin quickly strengthened later that day to reach a peak intensity of 120mph (190km/h) and a minimum central pressure of 968mbar (28.6inHg).[42] Shortly after reaching its peak intensity, Erin passed 105 miles (169km) east-northeast of Bermuda, its closest approach to the island. The hurricane maintained peak strength for 18hours, before slowly weakening. Erin turned to the east on September11, after the ridge to its north weakened, before accelerating northeastward. On September15, Erin weakened to tropical storm status as it passed just east of Cape Race, Newfoundland. Shortly thereafter, Erin transitioned into an extratropical cyclone, which crossed over southern Greenland on September16. A day later, the remnants of Erin merged with another storm east of Greenland.[42]
Tropical cyclone warnings and watches were issued for Bermuda beginning on September8, which were discontinued two days later after the storm bypassed the island.[42] Initial forecasts indicated Erin would pass within 15 miles (24km) of Bermuda. Ferry and bus transport were suspended. Officials prepared a school to be used as an emergency shelter, though few people used it.[45] The threat of the hurricane cancelled several flights in and out of the Bermuda International Airport,[46] stranding hundreds of travelers. Cruise ships and cargo ships also cancelled or delayed their arrivals.[47] Winds on the island reached 41mph (66km/h).[42] The winds downed several trees onto power lines,[46] leaving dozens of homes without power for several hours.[47] Prolonged durations of strong waves resulted in coastal beach erosion.[48] Large waves broke a boat from its moorings, though two men swam through the rough seas to prevent the yacht from running aground. The storm produced rainfall on the island, and damage was minor.[47][48] Swells from Erin produced rip currents along the North Carolina coastline.[49] Erin produced wind gusts as strong as 67mph (108km/h) at Cape Race, Newfoundland. Rainfall reached 5.1 inches (130mm) at Sagona Island.[42] Along the coast, the passage of the storm led to wave heights of up to 30 feet (9.1m).[50]
On September5, a tropical wave and an associated surface low emerged into the Atlantic from the west coast of Africa. Tracking westward, the wave and low acquired a better defined circulation and more concentrated deep convection. Consequently, satellite imagery indicated that a tropical depression developed approximately 415mi (670km) southwest of the Cabo Verde Islands around 18:00UTC on September7. However, possibly due to the cyclone's fairly quick westward motion –21 to 23mph (34 to 37km/h)– and a more stable atmospheric environment, the depression struggled to maintain deep convection and degenerated into a tropical wave about 24hours. The wave also encountered strong wind shear, but soon experienced more favorable conditions, leading to the redevelopment of convection closer to the center starting on September9.
Early on September10, the wave regenerated into a tropical depression about 1,145mi (1,845km) east of the Lesser Antilles, and intensified into Tropical Storm Felix the next day while tracking generally northward. By September13, it intensified into a hurricane, and subsequently it underwent rapid deepening, becoming a major hurricane on September14 with peak winds of 115mph (185km/h) and a minimum pressure of 962mbar (28.4inHg). By that time, Felix had turned to the northeast, and subsequently entered an area of unfavorable conditions. The hurricane gradually weakened, deteriorating to a tropical storm on September17. Cool waters and higher wind shear caused additional weakening while Felix nearly stalled to the southwest of the Azores. Late on September18, the storm weakened to a tropical depression, and early the next day Felix dissipated roughly 400mi (645km) southwest of the islands.[51]
A nearly stationary weak low- to mid-level trough offshore the Southeastern United States spawned a cut-off low on September9, which generated a surface low. Late on September11, the surface low organized into a tropical depression about 145mi (235km) west-southwest of Naples, Florida. The depression drifted west-southwest and slowly intensified, before turning east-northeastward and strengthening into Tropical Storm Gabrielle on September13. Gabrielle curved northeastward and struck near Venice, Florida, on the following day with winds of 70mph (115km/h). After weakening slightly, Gabrielle emerged into the Atlantic near Titusville on September15, accelerated northeastward, and strengthened, becoming a hurricane two days later. Gabrielle peaked with winds of 80mph (130km/h) and a minimum pressure of 975mbar (28.8inHg) before colder seas weakened it to a tropical storm on September18. The storm became extratropical on September19 roughly 345mi (555km) south of Newfoundland, but the remnants continued northeastward until being absorbed by a larger extratropical low over the far north Atlantic on September21.[52]
Gabrielle produced moderate winds along coastal areas of western Florida, reaching 58mph (93km/h) at Venice.[52] The tide flooded the northern shoreline of Charlotte Harbor and at the entrance to the Peace River, while further to the south a surge of greater than 3ft (0.91m) inundated the barrier island at Fort Myers Beach and flooded some cars.[53] Abnormally high tides inflicted at least minor damage to approximately 600homes in Lee County alone.[54] Heavy rains fell in parts of Florida,[52] with water entering some homes near Palm Beach Gardens.[55] The storm caused three deaths and $230million in damage in the United States..[52] Gabrielle brushed the eastern coast of Newfoundland; the rainfall set the all time six-hour precipitation record at St. John's, with a total of 3.54in (90mm).[56] Hundreds of homes and buildings were damaged by the passage of Gabrielle, totaling several million Canadian dollars in damage.[57]
A tropical wave emerged into the Atlantic from the west coast of Africa on September11. The wave reached the Caribbean on September16 and began organizing and acquiring convection a few days later. Tropical Depression Nine developed on September19 approximately 60mi (95km) north-northwest of Colombia's San Andres Island. The cyclone peaked with winds of 35mph (55km/h) and a minimum pressure of 1,005mbar (29.7inHg), and made landfall near Puerto Cabezas, Nicaragua, on September20. After losing its closed circulation over land, it reformed into Hurricane Juliette in the East Pacific.[58]
Nicaragua observed precipitation up to 1.8in (46mm) in Bluefields, while mountainous areas were estimated to have experienced 5.9in (150mm) rain.[59] In El Salvador, heavy rains from the depression helped alleviate drought conditions; however, flooding also inundated 200homes in San Salvador along the Acelhuate River.[60] Fifteen farms were inundated by flooding, five of which were destroyed. Seventy people evacuated to shelters set up after the storm by the local Red Cross and armed forces. Military crews were quickly deployed to help clean up the damages on September22.[61]
After Gabrielle moved across the western Atlantic, a trough extended southwestward from the storm, which interacted with an upper-level low on September18. This generated a surface low the following day, which developed into a tropical depression on September21 about halfway between Puerto Rico and Bermuda. A day later it strengthened into Tropical Storm Humberto. Moving around the subtropical ridge, its track became more northerly as Humberto intensified further.[62] After developing an eye feature,[63] Humberto attained hurricane status on September23. After passing Bermuda that day, Humberto briefly became a Category2 hurricane on September24, but weakened due to an increase in wind shear, falling to minimal hurricane intensity. Accelerating northeastward, the hurricane became aligned with the wind shear as it slowed slightly. Humberto restrengthened on September26, reaching peak winds of 105mph (165km/h) and a minimum pressure of 970mi (1,560km). Cooler waters and stronger wind shear caused Humberto to weaken again, as the convection became asymmetrical.[62][64] On September27, Humberto degenerated into an open trough about 560mi (900km) southeast of Newfoundland.[62]
There were three major aircraft flights into the hurricane over a three-day period which, according to NASA, "were the most comprehensive measurements of the structure of the hurricane ever recorded." The flights were designed to obtain data for better hurricane forecasting.[65] Some higher surf was recorded along the New Jersey coastline.[66] In September 2001, two men sought to break the record for sailing the quickest time from New York City to Melbourne, Australia; Humberto disrupted their early path slightly, but they ultimately broke the record by 28 hours.[67][68] While making its closest approach to Bermuda, the island recorded wind gusts of 43mph (69km/h) and light rainfall reaching 1.69in (43mm).[62]
A tropical wave emerged into the Atlantic from the west coast of Africa in late September. The wave moved generally westward across the Atlantic and organized into Tropical Depression Eleven approximately 90mi (145km) southeast of Barbados on October4. It traveled across the Windward Islands, and intensified into Tropical Storm Iris while over the eastern Caribbean on October5. Iris continued to the west and intensified. After passing just south of Jamaica, Iris reached Category4 hurricane strength on October8 to the north of Honduras. Around 02:00UTC on October9, the hurricane made landfall near Monkey River Town, Belize, with peak winds of 145mph (230km/h) and a minimum pressure of 948mbar (28.0inHg). Iris rapidly weakened and dissipated over extreme southeastern Mexico several hours later.[69] Although Iris's circulation dissipated, its remnants contributed to the development of Tropical Storm Manuel in the eastern Pacific Ocean on October10.[70]
Rainfall from the outerbands of Iris caused flooding in the Dominican Republic, resulting in the evacuation of 35families after rivers exceeded their banks. Three people died when a landslide destroyed a home in Santo Domingo.[71] Iris destroyed two homes and deroofed two others in Jamaica. The storm produced an 8 to 15ft (2.4 to 4.6m)storm surge along the coast of Belize.[69] A total of 3,718homes were either damaged or destroyed, mostly in the Stann Creek and Toledodistricts, rendering about 15,000people homeless.[72] Severe losses to agriculture was also reported, including the destruction of 5,000 acres (2,000 hectares) of bananas, 3,500 acres (1,400 hectares) of rice, and 3,000 acres (1,200 hectares) of corn.[73] Iris caused 24deaths in Belize – with 20occurring when the dive boat Wave Dancer capsized near Big Creek – and at least $250million in damage.[74][72] Flash floods and mudslides in Guatemala damaged 2,500homes and 26schools and killed 8people.[69] In Mexico, flooding due to heavy rains from Iris damaged 120homes in Oaxaca and caused 2deaths.[75]
A westward-moving tropical wave organized into Tropical Depression Twelve on October6 about 620mi (1,000km) east-southeast of Barbados. The depression strengthened into Tropical Storm Jerry early on October7, aided by low wind shear. Continuing westward due to a ridge to its north, Jerry passed just south of Barbados with winds of 50mph (85km/h) early on October8. Reconnaissance aircraft indicated a possible reformation of the center, as data indicated multiple low-level rotations on a northeast to southwest axis. After bypassing Saint Vincent at 03:00UTC on October8, Jerry's atmospheric pressure decreased to 1,004mbar (29.6inHg) and its forward speed increased to 25mph (40km/h). However, moderate vertical wind shear soon disrupted the storm's upper-level outflow, leading to weakening, despite forecast models indicating that the system could reach hurricane status within a few days. Later on October8, aircraft data indicated the system had weakened into a broad area of low pressure with scattered squalls mainly to the east of the remnant center. Jerry then dissipated shortly afterward approximately 230mi (370km) south of Puerto Rico, with the remnants moving westward.[76][77][78][79]
The threat of the storm prompted tropical storm warnings and watches in the Lesser Antilles. Jerry caused minimal damage as it moved through the Windward Islands and Lesser Antilles. A station at Martinique reported sustained ten-minute winds of 44mph (71km/h) on October 8.[76] Some downpours and high winds were reported.[80] Barbados observed a minimum pressure of 1,007mbar (29.7inHg).[76]
A cold front and an upper level trough interacted on October 10 to the south of Bermuda, and formed an extratropical storm. The storm passed near the island on October12, producing hurricane-force winds there. It then organized, becoming a subtropical cyclone on October12 about 35mi (55km) south of Bermuda and a tropical cyclone on October 13. Karen strengthened into a hurricane early the next day, peaking with winds of 80mph (130km/h) and a minimum pressure of 982mbar (29.0inHg). Shortly thereafter, cooler waters weakened Karen to a tropical storm. Around 12:00UTC on October15, the storm struck Nova Scotia near Western Head with winds of 45mph (70km/h). Karen accelerated northeastward into the Gulf of St. Lawrence and transitioned into an extratropical cyclone six hours later, which was soon absorbed by a larger extratropical low.[81]
On Bermuda, wind gusts reached as high as 100mph (160km/h) at Devonshire Parish. Approximately 23,000people lost electricity.[81] Damage on the island totaled about $1.4million,[36] which included impacts to 175structures and 87boats.[82] Some roads were inundated due to the storm almost 3in (76mm) of rain. Karen produced light to moderate winds across Atlantic Canada, peaking at 47mph (76km/h) with a gust of 64mph (103km/h) in Cape George in Antigonish County, Nova Scotia, along with a 26mph (42km/h) report in Charlottetown, Prince Edward Island. Impact in Atlantic Canada was mostly limited to minor damage to trees.[81]
An upper-level tropospheric trough persisted in the eastern Atlantic, developing a circulation by October 26 which quickly organized. On October 27, it developed into Tropical Depression Fourteen about 865mi (1,390km) south-southwest of the western Azores.[83] Moving westward, the depression was forecast to attain winds of at least 60mph (95km/h),[84][85] although it failed to reach that intensity.[83] Banding features developed over the storm,[85] and on October30, it was upgraded to Tropical Storm Lorenzo. At that time, the cyclone peaked with winds of 40mph (65km/h) and a minimum pressure of 1,007mbar (29.7inHg).[83] By early on October 31, convection had begun to separate from the circulation,[86][87] and later in the day Lorenzo became extratropical. The remnants of Lorenzo merged with a frontal system about 690mi (1,110km) west of the Azores.[83]
A tropical wave moved across the Atlantic and Caribbean for nearly two weeks before developing into a tropical depression along the east coast of Nicaragua on October29. Convection increased after the depression entered the Caribbean, and the system intensified into Tropical Storm Michelle on November1. It strengthened further, becoming a hurricane on November2 and reaching Category 4 status on November4, becoming one of only four tropical cyclones on record to reach that intensity in the month of November. The storm's minimum pressure also fell to 933mbar (27.6inHg) late on November3. Michelle made landfall in Cuba twice on the following day, first on Cayo Largo del Sur with peak winds of 140mph (220km/h) and then on the mainland near the Bay of Pigs at a slightly weaker intensity. Michelle was the strongest tropical cyclone to strike Cuba since Hurricane Fox in 1952. The storm rapidly weakened and fell to Category1 intensity as it emerged into the Atlantic early on November5. Michelle then moved quickly northeastward through the Bahamas and struck Andros and Eleuthera before transitioning into an extratropical cyclone about 125mi (200km) northeast of the latter. A frontal system absorbed the remnants of Michelle to the south of Bermuda by early on November7.[88]
The system that eventually became Michelle dropped torrential rains in several countries, causing at least six deaths in Honduras and four deaths in Nicaragua. An additional 26people were reported missing in Central America.[88] Torrential precipitation was also reported in Jamaica, with 41.7in (1,058mm) of rainfall observed at one location.[89] Flooding and mudslides damaged about 500homes beyond repairs, while 561others were impacted to some degree.[90] The storm caused five deaths and $18million in damage in Jamaica.[90][91] Michelle went on to affect Cuba, where the storm produced 4 to 5ft (1.2 to 1.5m) waves. Rainfall amounts up to 29.69in (754mm) were recorded across the island.[92] Sustained winds peaked at 124mph (200km/h) at Cayo Largo del Sur, while wind gusts reached at 130mph (210km/h) at the same location and in Jagüey Grande.[88] The hurricane demolished 12,579homes and damaged 166,515others.[13] Overall, Michelle caused five deaths and about $2billion in damage in Cuba.[13][93] Major damage also occurred in the Bahamas, totaling about $300million.[94]
A non-tropical frontal low developed from a cold front on November 1 to the west of the Azores. It intensified while moving west-northwestward and gradually dissipated its frontal structure.[95] It became a subtropical storm on November 4 about 890mi (1,430km) south of Cape Race, Newfoundland. Operationally, the storm was considered a non-tropical low, and the National Hurricane Center did not begin issuing advisories until it became a tropical cyclone. It moved slowly northward as convection organized into a ring around the center. As a result of a ship reporting hurricane-force winds near the center, and due to the development of a weak mid-level warm core, the subtropical cyclone was reclassified as Hurricane Noel on November 5. Noel peaked with winds 75mph (120km/h) and a minimum pressure of 986mbar (29.1inHg). Increasing westerly wind shear limited convection near the center, and Noel weakened to a tropical storm early on November 6.[96] Progressively cooler water temperatures contributed to weakening,[97] and Noel became extratropical later on November 6 about 330mi (530km) southeast of Newfoundland. The extratropical remnant continued to the northeast and was absorbed by a larger extratropical storm later that day.[96]
In mid-November, a cold front and a small area of disturbed weather interacted over the western Atlantic, generating an extratropical low on November22 to the east of Bermuda. Two days later, the low developed into a Subtropical Storm Olga approximately 900mi (1,450km) east-southeast of the island. After becoming tropical on November24, Olga moved generally westward, and eventually strengthened into a hurricane on November26. Olga peaked with winds of 90mph (140 km/h) and a minimum pressure of 973mbar (28.7inHg) before turning southwestward and weakening back to tropical storm status. On November30, it deteriorated further to a tropical depression but re-intensified into a tropical storm two days later while trekking northward. Olga weakened to a tropical depression again on December4 and moved eastward until dissipating about 690mi (1,110km) east of Nassau, Bahamas.[98]
At least one ship suffered damage. Rough seas occurred from the Lesser Antilles to the East Coast of the United States. The cyclone's remnants produced heavy rainfall across the Bahamas and Florida.[98]
The following list of names was used for named storms that formed in the north Atlantic in 2001.[99] This is the same list used for the 1995 season,[100] except for Lorenzo, Michelle, Olga, and Rebekah, which replaced Luis, Marilyn, Opal, and Roxanne, respectively.[101] Each new name, except for Rebekah, was used for the first (and only in the case of Michelle) time in 2001.
The World Meteorological Organization retired the names Allison, Iris, and Michelle from the Atlantic hurricane name lists after the 2001 season on account of their destructiveness. They were replaced with Andrea, Ingrid, and Melissa, respectively, for the 2007 season.[102]Allison became the first Atlantic tropical storm to have its name retired.[103]
Season effects
This is a table of all of the storms that formed in the 2001 Atlantic hurricane season. It includes their name, duration, peak classification and intensities, areas affected, damage, and death totals. Deaths in parentheses are additional and indirect (an example of an indirect death would be a traffic accident), but were still related to that storm. Damage and deaths include totals while the storm was extratropical, a wave, or a low, and all of the damage figures are in 2001 USD.
12"Hurricane Olga downgraded to tropical storm". The Palm Beach Post. West Palm Beach, Florida. Associated Press. November 30, 2001. p.15A. Retrieved September 7, 2021– via Newspapers.com.
"Oaxaca: 2 muertos por "Iris"". El Universal (in Spanish). Mexico City, Mexico. October 11, 2001. Archived from the original on July 14, 2014. Retrieved September 7, 2021.
Dartmouth Flood Observatory (January 25, 2002). "2001 Global Register of Extreme Flood Events". Dartmouth Flood Observatory's Active Archive of Large Floods. Dartmouth College. Archived from the original on January 16, 2017. Retrieved June 21, 2013.
C. Justin Robinson; Prosper Bangwayo-Skeete (March 16, 2016). "The Financial Impact of Natural Disasters: Assessing the Effect of Hurricanes & Tropical Storms On Stock Markets in the Caribbean". p.7. SSRN2845429.
12Atlantic basin Comparison of Original and Revised HURDAT. Hurricane Research Division; Atlantic Oceanographic and Meteorological Laboratory (Report). Miami, Florida: National Oceanic and Atmospheric Administration. June 2019. Retrieved September 7, 2021.
↑Report on Tropical Storm Gabrielle(PDF). National Weather Service Tampa Bay Area, Florida (Report). Ruskin, Florida. 2001. Retrieved September 7, 2021.
↑"Oaxaca: 2 muertos por "Iris"". El Universal (in Spanish). Mexico City, Mexico. October 11, 2001. Archived from the original on July 14, 2014. Retrieved September 7, 2021.
↑2001 Annual Report(PDF) (Report). BF&M General Insurance Company Ltd. 2002. Archived from the original(PDF) on March 4, 2016. Retrieved December 14, 2025.
↑Dartmouth Flood Observatory (January 25, 2002). "2001 Global Register of Extreme Flood Events". Dartmouth Flood Observatory's Active Archive of Large Floods. Dartmouth College. Archived from the original on January 16, 2017. Retrieved June 21, 2013.
↑C. Justin Robinson; Prosper Bangwayo-Skeete (March 16, 2016). "The Financial Impact of Natural Disasters: Assessing the Effect of Hurricanes & Tropical Storms On Stock Markets in the Caribbean". p.7. SSRN2845429.
↑National Hurricane Operations Plan(PDF) (Report). Washington, D.C.: NOAA Office of the Federal Coordinator for Meteorological Services and Supporting Research. May 2001. p.3-7. Retrieved January 19, 2024.
↑National Hurricane Operations Plan(PDF) (Report). Washington, D.C.: NOAA Office of the Federal Coordinator for Meteorological Services and Supporting Research. May 1995. p.3-7. Retrieved January 19, 2024.
↑National Hurricane Operations Plan(PDF) (Report). Washington, D.C.: NOAA Office of the Federal Coordinator for Meteorological Services and Supporting Research. May 2002. p.3-7. Retrieved January 19, 2024.
↑"Desastres naturales" (in Spanish). Banco Interamericano de Desarrollo. February 14, 2002. Archived from the original on August 10, 2014. Retrieved December 10, 2012.
This page is based on this Wikipedia article Text is available under the CC BY-SA 4.0 license; additional terms may apply. Images, videos and audio are available under their respective licenses.