Types of tropical cyclones


- Tropical cyclone – a rapidly rotating low-pressure system consisting of a spiral band of thunderstorms, strong winds, and atmospheric circulation that can produce heavy rain and squalls. Depending on the location, they are given different names such as hurricanes, cyclones, or typhoons.
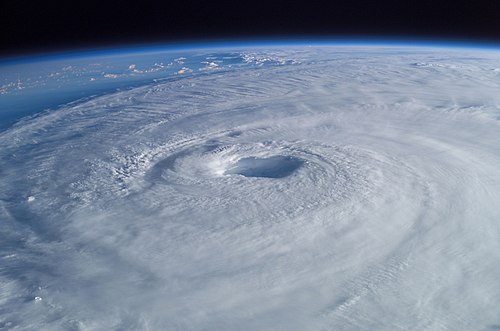
- Annular tropical cyclone – a tropical cyclone that possesses annular characteristics. Annular characteristics are often seen in major cyclones, where they possess a symmetrical eye and a thick ring of convection.
- Subtropical cyclone – a low-pressure system that gains both tropical and extratropical-like quantities.
- Extratropical cyclone – a low-pressure system that is capable of producing weather conditions such as tornadoes, thunderstorms, gales, etc.
- Post-tropical cyclone – a former tropical cyclone that no longer has enough tropical quantities to be considered a tropical cyclone. Post-tropical cyclones, such as remnant lows, no longer possess tropical quantities through either unfavorable conditions (e.g. increased wind shear) or land interaction.
- Pacific hurricane – a tropical cyclone that forms west of 100°W to the International Date Line in the Northern Hemisphere. The National Hurricane Center is responsible for the region east of 140°W, while the Central Pacific Hurricane Center is responsible for storms forming west of 140°W to the International Date Line.
- Atlantic hurricane – a tropical cyclone that forms in the Atlantic Ocean. The National Hurricane Center is responsible for the region.
- Typhoon – a tropical cyclone that forms between the International Date Line and 100°E in the Northern Hemisphere. The main RSMC for this region is the Japan Meteorological Agency.
- Mediterranean tropical-like cyclone – a tropical cyclone that forms in the Mediterranean Sea.
- Cape Verde hurricane – a tropical cyclone that forms from a tropical wave over or near the Cape Verde islands. Cape Verde hurricanes occur between August and October and contain some of the most destructive hurricanes to strike land in the Atlantic. Examples include Hurricane Ivan, Hurricane Isabel, Hurricane Dorian, etc.
- Tropical wave – an atmospheric trough or low-pressure area that forms along the subtropical ridge or supported from an area of high pressure, which lies either north or south of the Intertropical Convergence Zone.