A map of all tropical cyclone tracks, encompassing the period between the years 1985 and 2005.
This is a list of wettest tropical cyclones by country, using all known available sources. Data is most complete for Australia, Cuba, Dominican Republic, Japan, Hong Kong, Mexico, Taiwan, Micronesia's Yap and Chuuk, and the United States, with fragmentary data available for other countries. The French region of Réunion holds several world records for tropical cyclone and worldwide rainfall, due to the rough topography and its location in the Indian Ocean.[1]
Christmas Island is an Australian territory located in the Indian Ocean located at the summit of a submarine mountain, which rises steeply to a central plateau that is dominated by stands of rainforest.[13] After rainfall and wind observations started on the island during 1972, only 13 tropical cyclones passed within 220km (135mi) of the territory between 1972 and 2005.[13]
Wettest tropical cyclones and their remnants on Christmas Island Highest-known totals
Although Tropical Low 11U in 2013 remained more than 120km (75mi) away from the Cocos Islands, wind shear displaced convection westward and over the islands for several days, resulting in record breaking rainfall.
The Cocos (Keeling) Islands are an Australian territory of 27 coral islands that are formed into two large coral atolls and cover an area of around 36km2 (14sqmi) of the Indian Ocean to the northwest of Perth, Australia.[13] Rainfall observations started on the islands during 1907, while temperature, wind and other records started in 1952.[13] Between 1952 and 2005 27 tropical cyclones caused storm force wind gusts of over 90km/h (55mph) on the islands, while only four caused hurricane-force gusts of over 125km/h (80mph).[13]
Wettest tropical cyclones and their remnants in the Cocos Islands Highest-known totals
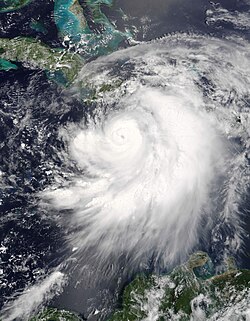
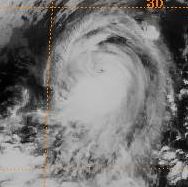
Cyclone Komen approaching Bangladesh on July 29, 2015
Bangladesh has been the scene of the greatest tropical cyclone casualties in recent times. The country is quite flat and generally lies near sea level.
Wettest tropical cyclones and their remnants in Bangladesh Highest-known totals
This country has terrain mainly across its southern sections, with elevations up to about 3,700 feet (1,100m).[51] The highest reported rainfall in what was formerly British Honduras occurred during Hurricane Keith in 2000 when 32.67 inches (830mm) of rain fell in a 24‑hour period at Phillip Goodson International Airport in Belize City.[52] Equally heavy rains could have fallen during Hurricane Hattie of 1961 and Hurricane Fifi of 1974.
Wettest tropical cyclones and their remnants in Belize Highest-known totals
Tropical cyclones are usually in transition to extratropical cyclones by the time they reach Atlantic Canada, though occasionally they retain their tropical status. No tropical cyclone has ever hit Canada's Pacific coast.
Wettest tropical cyclones and their remnants in Canada Highest-known totals
China is a mountainous country, which leads to rapid dissipation of cyclones that move inland as well as significant amounts of rain from those dissipating cyclones. Typhoon Nina (1975) caused the collapse of two huge reservoirs and ten smaller dams when 1,062 millimetres (41.8in) fell in Henan during a 24‑hour period, which is the record for Mainland China. Typhoon Sam of the 1999 Pacific typhoon season became the wettest known tropical cyclone to impact Hong Kong since records began in 1884, breaking a 73‑year‑old record.[75] Precipitation associated with tropical cyclones and their remains can bring snow to Tibet. An early October 2004 tropical depression brought daily precipitation of 6 centimetres (2.4in) of liquid equivalent precipitation to Che-Ku county in the form of heavy snow, which was a new October daily precipitation record for both rain and snow. This led to a loss of 340,000kg of food, 230,000kg of forage grass, and 263 livestock in the snowstorm.[76]
Mainland
Typhoon In-fa
Wettest tropical cyclones and their remnants in Mainland China Highest-known totals
Hurricane Flora of October 1963 drifted across Cuba for four days, leading to extreme rainfall across the mountainous island country. During the heaviest 24‑hour period of rainfall, 735 millimetres (28.9in) of rain fell at Santiago de Cuba. Total amounts of 2,033 millimetres (80.0in) over 4days and 2,550 millimetres (100in) over 5days produced staggering loss of life in Cuba, where over 2000 perished.[94]
Hurricane Dennis
Wettest tropical cyclones and their remnants in Cuba Highest-known totals
The islands of the eastern Caribbean are constantly threatened by tropical storms and hurricanes, mainly between August and October. Dominica is a rugged island, with spots of elevation as high as nearly 4,750 feet (1,450m).[95] As Hurricane Jeanne moved through the region, 422.3 millimetres (16.63in) of rain fell during the 24‑hour period ending on the morning of September 15, 2004.[96]
Wettest tropical cyclones and their remnants in Dominica Highest-known totals
The Dominican Republic, has some of the highest terrain surrounding the Caribbean Sea, with Pico Duarte peaking at 10,700 feet (3,300m) above sea level.[101] Most of the tropical cyclone rainfall totals on the list below are 24‑hour maxima, which likely underrepresent the storm total.
Wettest tropical cyclones and their remnants the Dominican Republic Highest-known totals
Hurricane Marilyn moved directly across the island in mid-September 1995,[129] bringing the highest known rainfall totals to the island from a tropical cyclone.
Wettest tropical cyclones and their remnants in Guadeloupe Highest-known totals
The mountainous island of Réunion has experienced several of the highest rainfall totals on record from tropical cyclones and holds the rainfall world records for 12, 24, 48, 72hours, four, five, six, seven, eight, nine and ten days as a result.[147][148][149] The 12 and 24 hourly rainfall records were set at Foc-Foc by Cyclone Denise in 1966, while an Unnamed Tropical Cyclone between April 8–10, 1958 set the record for 48 hours at Aurere. Tropical Cyclone Gamede between February 24–28, 2007 came close to beating the records for 12, 24 and 48 hours before setting the records for three, four, five, six, seven, eight and ninedays that were held by Tropical Cyclone Hyacinthe 1980.[148][149] Hyacinthe currently holds the world records for ten and fifteen days with rainfall totals of 5,678 millimetres (223.5in) and 6,083 millimetres (239.5in) respectively recorded at Commerson Crater.[149][150]
Wettest tropical cyclones and their remnants on Reunion island Highest-known totals
Tropical Storm Agatha in May 2010 became the second-wettest tropical cyclone in the nation's history when it slowly developed while remaining nearly stationary to the southwest of Guatemala, before turning northeast and dissipating across inland Central America.[164]
Wettest tropical cyclones and their remnants Guatemala Highest-known totals
Haiti that makes up three-eighths of Hispaniola,[170][171] is a mountainous country that has experienced some of the most powerful hurricanes on record, including Hurricane David. Its three mountain ranges have peaks as high as 8793feet/2680meters above sea level.[172]
Hurricane Flora
Wettest tropical cyclones and their remnants in Haiti Highest-known totals
The precursor tropical disturbance of Tropical Cyclone Inigo in April 2003 dropped heavy rainfall in eastern Indonesia. The rainfall caused flash flooding and mudslides, primarily in Flores but also on West Timor[199] and Sumba.[200] In some locations, the depth of the floodwaters reached 5 metres (16ft). The Oessao River in West Timor exceeded its banks, which flooded seven villages. In Kupang in West Timor, the system destroyed hundreds of homes and large fields of corn, bean, and rice crop. Heavy damage was reported near Ende, where flooding and mudslides destroyed 20houses and destroyed the roads connecting to East Flores. The city airport was flooded with one meter (3ft) of water, preventing aerial transportation and which left the city temporarily isolated. In East Flores Regency in eastern Flores Island, the system left 75destroyed houses, along with 77 severely damaged and a further 56 receiving light damage.[199]
Wettest tropical cyclones and their remnants in Indonesia Highest-known totals
This mountainous island country of Jamaica can get lashed with rainfall by slow-moving tropical cyclones in the western Caribbean Sea. Its interior, the Blue Mountains, reach a height of 7,400 feet (2,300m) above sea level.[205]
Wettest tropical cyclones and their remnants in Jamaica Highest-known totals
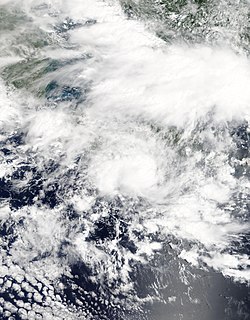
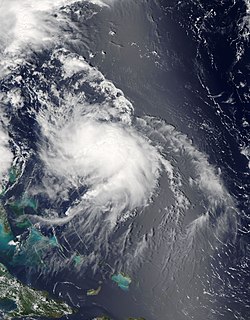
Typhoon Namtheun approaching Japan on July 30, 2004
The mountainous island archipelago is constantly struck by typhoons recurving out of the tropics, which are normally in extratropical transition as they pass through Japan. Typhoon Namtheun of the 2004 Pacific typhoon season holds the national 24-hour precipitation record with 1,317 millimetres (51.9in) observed in Kisawa village,[213] surpassing the previous record of 1,140mm (45in) set during Typhoon Fran in 1976.[214]
Wettest tropical cyclones and their remnants in Japan Highest-known totals
Typhoon Rusa caused 409 millimetres (16.1in) of rain to fall at Naze on August 29–30, 2002.[230]Typhoon Aere dropped 314.5 millimetres (12.38in) of rain in the 65‑hour period ending at 1400 UTC on August 25, 2004, at Ishigakihima.[231]Typhoon Agnes in August 1957 dropped 586.2 millimetres (23.08in) of rainfall on Marcus Island.[36] In 1972, Typhoon Rita dumped 31.87in (809mm) on Okinoerabu Shima.[232]
Johnston Atoll
Tropical cyclones occasionally threaten this central Pacific island. Hurricane Celeste of 1972 brought 6.21 inches (158mm) to the isle around August 19.[233]
Korea
The Korean Peninsula experiences typhoons regularly. Tropical cyclones which impact southern China also lead to, on average, five heavy rainfall events per year across the Korean peninsula.[234]
North Korea
Very heavy rains fell across Tongchon and Kosong counties during Typhoon Rusa in 2002, where up to 510 millimetres (20in) of precipitation fell in a 5- to 10-hour period.[230]
South Korea
Severe Tropical Storm Nakri
Wettest tropical cyclones and their remnants in South Korea Highest-known totals
Hurricane Wilma of 2005 drifted over the northeast portion of the Yucatán peninsula for a couple of days, dropping significant rains. A report of 1,576 millimetres (62.0in) was reported by the Servicio Meteorológico Nacional in Mexico,[260] which is the wettest known 24-hour rainfall amount ever measured in Mexico. Second on the list is from Hurricane John in 2024, which accumulated up to 1,442 millimetres (56.8in) of rain at Acapulco in Guerrero.[261] Below is a list of the highest known storm total rainfall amounts from individual tropical cyclones across Mexico. Most of the rainfall information was provided by the Mexico's National Weather Service, Servicio Meteorológico Nacional, which is a part of the National Water Commission, Comisión Nacional del Agua.
Hurricane Wilma
Wettest tropical cyclones and their remnants Mexico (Overall) Highest-known totals
Elevations of the islands surrounding Chuuk lagoon reach a height of about 1,450 feet (440m).[272]Typhoon Chataan led to excessive rainfall on this island from June 23– July 3, 2002, when a total of 939mm (37.0in) fell. During the time frame when Chataan was declared a tropical cyclone from July 1–3, 622mm (24.5in) fell, with 506mm (19.9in) falling on the 2nd alone at the international airport.[273]
Typhoon Chataan
Wettest tropical cyclones and their remnants on Chuuk Highest-known totals
The wettest known tropical cyclone for the state was Ruby in 1982, which drifted in the island's vicinity for several days during its initial development phase.[277]
Typhoon Ruby (1982)
Wettest tropical cyclones and their remnants in Yap state Highest-known totals
Some of the highest elevations on the planet lie in Nepal. Eight out of fourteen highest peaks in the world lie in the Nepalese Himalaya including the highest peak of the World, Mt. Everest (8848 m).[286] During a tropical depression that affected the Indian Subcontinent in 2004, 51.3 millimetres (2.02in) of rain fell at Kathmandu airport in the 24‑hour period ending at 1200 UTC on October 7.[76]
Netherlands Antilles
Saba
Wettest tropical cyclones and their remnants on Saba Highest-known totals
Most tropical cyclones which pass near New Zealand are in extratropical transition (ET) or have become extratropical, which can enhance their heavy rainfall threat.
Wettest tropical cyclones and their remnants in New Zealand Highest-known totals
During the passage of Tropical Cyclone Heta in January 2004, the Niue Meteorological Station reported a record 24-hour rainfall of 999.2 millimetres (39.34in).[312]
Wettest tropical cyclones and their remnants on Niue Highest-known totals
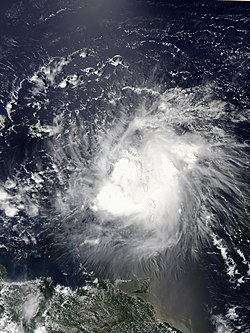
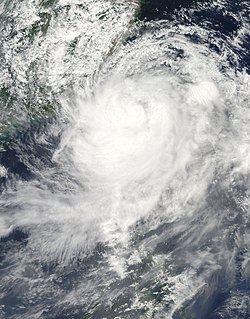
Cyclone Phet, a cyclone making landfall in Pakistan in June 2010 as a deep depression
Tropical cyclones for the Arabian Sea usually affect Pakistan. Tropical cyclones from the Bay of Bengal can affect Pakistan, though they usually weaken by the time they reach the Pakistani coastline.[321]
Wettest tropical cyclones and their remnants in Pakistan Highest-known totals
Inflow to the south of Hurricane Mitch brought impressive rainfalls to Panama. Veladero de Tole recorded 695 millimetres (27.4in) of rainfall between October 22 and 31, 1998.
Tropical Cyclone Eline in February 2000 dropped significant rains on portions of South Africa. The highest amount noted was 480mm (19in) at Thohoyandou.[356]
Spain
Wettest tropical cyclones and their remnants in Spain Highest-known totals
A tropical depression in early October 2004 led to heavy rains across Sri Lanka. The maximum was measured at Galle where 117.2mm (4.61in) fell in the 24‑hour period ending at 0600 UTC on the 2nd.[76]
St. Brandon, South Indian Ocean
Tropical Cyclone Darius of New Year's Eve/Day of 2003/2004 passed about 45 miles (72km) west-northwest of the island. Rainfall over the 24‑hour period of closest approach was 135mm (5.3in).[358]
St. Kitts and Nevis
Wettest tropical cyclones and their remnants in Saint Kitts and Nevis Highest-known totals
The mountainous island of Taiwan experiences an average of 1.8tropical cyclone landfalls each year.[citation needed] Due to its rugged topography, Taiwan sees extreme rains from tropical cyclones, particularly in its central mountain range.
Typhoon Morakot
Wettest tropical cyclones and their remnants in Taiwan Highest-known totals
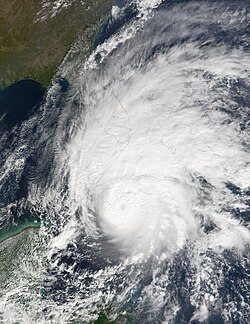
Bermuda has not historically received overwhelming rains out of tropical cyclones. This could be because of the rapid pace storms usually pass the island and the lack of mountains on the island.
Hurricane Nicole (2016)
Wettest tropical cyclones and their remnants in Bermuda Highest-known totals
A few tropical cyclones have skimmed the northern coast of South America over recent decades. Tropical Storm Bret (1993) dropped 339 millimetres (13.3in) of rain in ten hours at Guanare, Portuguesa, Venezuela.[410]
↑Courtney, Joe (August 28, 2008). Tropical Cyclone Rosie, April 20–24, 2008(PDF) (Report). Australian Bureau of Meteorology's Perth Tropical Cyclone Warning Centre. Archived(PDF) from the original on September 24, 2015. Retrieved April 9, 2014.
12"Tropical Low 11U"(PDF). Australian Bureau of Meteorology's Western Australian Regional Office. March 2013. Archived(PDF) from the original on September 23, 2015. Retrieved August 3, 2014.
↑Perth Tropical Cyclone Warning Centre (June 12, 2009). Severe Tropical Cyclone Walter April 1 – 8, 2001(PDF) (Individual Cyclone Reports). Australian Bureau of Meteorology. pp.1–2. Archived(PDF) from the original on March 20, 2012. Retrieved July 22, 2012.
↑Western Australian Regional Office (2013). Severe Tropical Cyclone Bruce (Report). Australian Bureau of Meteorology. Archived from the original on September 23, 2015. Retrieved January 11, 2015.
↑Western Australian Regional Office (January 1, 2015). Severe Tropical Cyclone Kate (Report). Australian Bureau of Meteorology. Archived from the original on September 23, 2015. Retrieved January 1, 2015.
↑Tropical Cyclone Anggrek (Report). Australian Bureau of Meteorology's Western Australian Regional Office. 2010. p.2. Archived from the original on September 23, 2015. Retrieved August 10, 2014.
123Brown, Daniel P (December 17, 2007). Tropical Cyclone Report: Hurricane Noel(PDF) (Report). United States National Hurricane Center. p.4. Archived(PDF) from the original on October 14, 2022. Retrieved April 25, 2016.
↑Avila, Lixion A; Stewart, Stacy R; Berg, Robbie; Hagen, Andrew B (April 20, 2020). Tropical Cyclone Report: Hurricane Dorian(PDF) (Report). United States National Hurricane Center. Retrieved April 28, 2020.
↑Rappaport, Edward N (November 26, 1995). Preliminary Report: Hurricane Erin(PDF) (Report). United States National Hurricane Center. Retrieved June 10, 2012.
↑Pasch, Richard J; Kimberlain, Todd B; Stewart, Stacey R (November 18, 1999). Preliminary Report: Hurricane Floyd(PDF) (Report). United States National Hurricane Center. Retrieved June 10, 2012.
12345Pasch, Richard J; Reinhart, Brad J; Berg, Robbie; Roberts, David P (June 9, 2021). Tropical Cyclone Report: Hurricane Eta(PDF) (Report). United States National Hurricane Center. Archived(PDF) from the original on February 15, 2024. Retrieved May 21, 2024.
123Pasch, Richard J; Reinhart, Brad J; Berg, Robbie; Roberts, David P (June 9, 2021). Tropical Cyclone Report: Hurricane Eta(PDF) (Report). United States National Hurricane Center. Archived from the original(PDF) on February 15, 2024. Retrieved April 17, 2025.
↑John L. Beven II and Robbie Berg (April 5, 2018). Tropical Cyclone Report: Hurricane Nate(PDF) (Report). Miami, Florida: National Hurricane Center. Retrieved April 12, 2018.
↑Naciones Unidas a Centroamérica (March 16, 1999). "Costa Rica: Evaluación de los Daños Ocasionados por el Huracán Mitch, 1998: Sus implicaciones para el desarrollo económico y social y el medio ambiente". United Nations. p.10.
↑Richard J. Pasch; Andrew B. Penny & Robbie Berg (April 5, 2018). Hurricane Maria (AL152017)(PDF) (Report). Tropical Cyclone Report. National Hurricane Center. Retrieved April 9, 2018.
↑Brown, Daniel P; Kimberlain, Todd B; National Hurricane Center (March 27, 2009). Hurricane Hanna(PDF) (Tropical Cyclone Report). United States National Oceanic and Atmospheric Administration's National Weather Service. Retrieved June 1, 2012.
↑"December 2016"(PDF). Fiji Climate Summary. Vol.37, no.12. Fiji Meteorological Service. January 10, 2017. Archived(PDF) from the original on June 28, 2017. Retrieved May 11, 2023.
↑Krishna, Ram (January 4, 1981). Publication No. 2: Tropical Cyclones in Fiji: November 1969 – April 1980 (Report). Fiji Meteorological Service. p.3-5.
↑"January 2021"(PDF). Fiji Climate Summary. Vol.42, no.1. Fiji Meteorological Service. February 5, 2021. Archived(PDF) from the original on April 28, 2021. Retrieved April 28, 2024.
↑Terry, James P; Raj, Rishi (1999). "Island Environment and Landscape Responses to 1997 Tropical Cyclones in Fiji". Pacific Science. 53 (3). University of Hawai'i Press: 257–272. hdl:10125/2184.
↑"April 2016"(PDF). Fiji Climate Summary. Vol.37, no.4. Fiji Meteorological Service. May 6, 2016. Archived from the original(PDF) on July 7, 2016. Retrieved March 12, 2024.
↑"December 2012"(PDF). Fiji Climate Summary. Vol.33, no.12. Fiji Meteorological Service. January 7, 2013. Archived from the original(PDF) on October 19, 2012. Retrieved May 2, 2024.
↑Avila, Lixion A; National Hurricane Center (October 23, 1996). Hurricane Hortense 3-16 September 1996 (Preliminary Report). United States National Oceanic and Atmospheric Administration's National Weather Service. Archived from the original on July 3, 2013. Retrieved June 17, 2012.
↑"COMMUNIQUE". February 21, 2009. Archived from the original on February 21, 2009. Retrieved October 19, 2016.{{cite web}}: CS1 maint: bot: original URL status unknown (link)
↑Tropical Cyclone Florine 4–10 January. National Climatic Data Center (Report). Global tropical/extratropical cyclone climatic atlas. 1996. Retrieved November 20, 2016.
↑Pasch, Richard J; National Hurricane Center (November 22, 1999). Hurricane Jose: October 17 – 25, 1999 (Preliminary Report). United States National Oceanic and Atmospheric Administration's National Weather Service. Retrieved December 7, 2012.
↑Cangialosi, John P; National Hurricane Center (November 17, 2010). Hurricane Otto October 6–10(PDF) (Tropical Cyclone Report). United States National Oceanic and Atmospheric Administration's National Weather Service. pp.6–7. Retrieved December 7, 2012.
↑Rappaport, Edward N; National Hurricane Center (January 17, 1996). Hurricane Marilyn: September 12 – 22, 1995 (Preliminary Report). United States National Oceanic and Atmospheric Administration's National Weather Service. Retrieved December 7, 2012.
↑Stewart, Stacy R (April 3, 2017). Tropical Cyclone Report: Hurricane Matthew(PDF) (Report). United States National Hurricane Center. p.4. Archived(PDF) from the original on April 18, 2024. Retrieved April 6, 2017.
↑Finnigan, Sean (October 4, 2002). Hurricane Lili almost drowns Camp-Perin, Haiti(PDF) (Report). Organisation for the Rehabilitation of the Environment. p.1. Archived(PDF) from the original on April 25, 2012. Retrieved June 9, 2012.
↑Brown, Daniel P; Kimberlain, Todd B (March 27, 2009). Tropical Cyclone Report: Hurricane Hanna(PDF) (Report). United States National Hurricane Center. Archived(PDF) from the original on September 8, 2023. Retrieved June 1, 2012.
↑Beven II, John L; Kimberlain, Todd B (January 22, 2009). Tropical Cyclone Report: Hurricane Gustav(PDF) (Report). United States National Hurricane Center. p.4. Archived(PDF) from the original on September 9, 2023. Retrieved June 1, 2012.
↑Nation's Encyclopedia. Jamaica. Retrieved on February 19, 2007.
↑Paulhaus, J. L. H. (1973). World Meteorological Organization Operational Hydrology Report No. 1: Manual For Estimation of Probable Maximum Precipitation. World Meteorological Organization. p.178.
12Evans, C. J.; Royal Meteorological Society (1975). "Heavy rainfall in Jamaica associated with Hurricane Flora 1963 and Tropical Storm Gilda 1973". Weather. 30 (5). Blackwell Publishing Ltd: 157–161. doi:10.1002/j.1477-8696.1975.tb03360.x. ISSN1477-8696.
↑Blake, Eric S.; National Hurricane Center (March 7, 2011). Tropical Storm Nicole(PDF) (Tropical Cyclone Report). United States National Oceanic and Atmospheric Administration's National Weather Service. Retrieved May 13, 2012.
↑Stewart, Stacey R. (December 16, 2004). Hurricane Ivan (Tropical Cyclone Report). United States National Hurricane Center. Retrieved May 13, 2012.
↑Blake, Eric S; Kimberlain, Todd B; Berg, Robert J; Cangialosi, John P; Beven II, John L (February 12, 2013). Hurricane Sandy: October 22– 29, 2012(PDF) (Tropical Cyclone Report). United States National Hurricane Center. Archived(PDF) from the original on May 18, 2024. Retrieved January 29, 2014.
↑"Typhoon Talas". Japan Meteorological Agency. 2011. Retrieved September 6, 2011.
↑"Typhoons of the Western North Pacific, 1971". Climatological Data: National Summary. 22 (1). National Oceanic and Atmospheric Administration: 771. January 1971. Retrieved April 12, 2013.
↑"台風200514号 (Nabi) - 災害情報" (in Japanese). National Institute of Informatics. 2011. Retrieved December 31, 2011.
↑"台風199211号 (Kent) - 災害情報" (in Japanese). National Institute of Informatics. 2011. Retrieved December 31, 2011.
↑"アメダス日出岳(64211)@台風198911号" (in Japanese). National Institute of Informatics. 2011. Retrieved December 31, 2011.
↑"台風198305号 (Abby) - 災害情報" (in Japanese). National Institute of Informatics. 2011. Retrieved December 31, 2011.
↑"台風199019号 (Flo) - 災害情報" (in Japanese). National Institute of Informatics. 2011. Retrieved December 31, 2011.
↑J. L. H. Paulhaus (1973). World Meteorological Organization Operational Hydrology Report No. 1: Manual For Estimation of Probable Maximum Precipitation. World Meteorological Organization. p.178.
↑Padgett, Gary; Kevin Boyle; John Wallace; Huang Chunliang; Simon Clarke (May 17, 2005). "Monthly Global Tropical Cyclone Summary August 2002". Australian Severe Weather Index. Jimmy Deguara. Retrieved January 1, 2007.
12Padgett, Gary; Kevin Boyle; John Wallace; Huang Chunliang; Simon Clarke (May 17, 2005). "Monthly Global Tropical Cyclone Summary August 2002". Australian Severe Weather Index. Jimmy Deguara. Retrieved January 13, 2007.
↑Padgett, Gary; Boyle, Kevin; Wallace, John; Chunliang, Huang; Clarke, Simon (May 17, 2005). "Monthly Global Tropical Cyclone Summary August 2004". Australian Severe Weather Index. Jimmy Deguara. Retrieved January 13, 2007.
↑LTJG Robert C. Weir (1982). "Typhoon Agnes (18)"(PDF). Annual Tropical Cyclone Report. Joint Typhoon Warning Center (Report). United States Navy. pp.70–73. Archived from the original(PDF) on March 4, 2016. Retrieved September 11, 2014.
↑"Pacific ENSO Update: 2nd Quarter 2015"(PDF). United States Pacific el Niño-Southern Oscillation (ENSO) Applications Climate Center. 21 (2). May 29, 2015. Archived(PDF) from the original on March 4, 2016. Retrieved March 19, 2016.
↑Pasch, Richard J; National Hurricane Center (November 22, 1999). Hurricane Jose: October 17 - 25, 1999(PDF) (Preliminary Report). United States National Oceanic and Atmospheric Administration's National Weather Service. Retrieved December 7, 2012.
↑Lawrence, Miles B; National Hurricane Center (January 8, 1996). Hurricane Luis: August 27 - September 11, 1995(PDF) (Preliminary Report). United States National Oceanic and Atmospheric Administration's National Weather Service. Retrieved December 7, 2012.
↑Cangialosi, John P; National Hurricane Center (November 17, 2010). Hurricane Otto October 6 - 10(PDF) (Tropical Cyclone Report). United States National Oceanic and Atmospheric Administration's National Weather Service. p.6-7. Retrieved December 7, 2012.
12Connor, Desiree; Etienne-LeBlanc, Sheryl (January 2013). Climatological Summary 2012(PDF) (Report). Meteorological Department St. Maarten. p.10. Archived(PDF) from the original on February 5, 2014. Retrieved December 7, 2012.
↑March 1990 North Island Ex-tropical Cyclone Hilda (NZ Historic Weather Events Catalog). National Institute of Water and Atmospheric Research. November 7, 2013. Archived from the original on February 23, 2014. Retrieved February 4, 2014.
↑March 1988 North Island Ex-tropical Cyclone Bola (NZ Historic Weather Events Catalog). National Institute of Water and Atmospheric Research. November 7, 2013. Archived from the original on April 10, 2017. Retrieved February 4, 2014.
↑January 1989 Northland Cyclone Delilah (NZ Historic Weather Events Catalog). National Institute of Water and Atmospheric Research. November 7, 2013. Archived from the original on August 10, 2014. Retrieved February 4, 2014.
↑April 1968 New Zealand Ex-tropical Cyclone Giselle (NZ Historic Weather Events Catalog). National Institute of Water and Atmospheric Research. November 7, 2013. Archived from the original on February 23, 2014. Retrieved February 4, 2014.
12Appendix VI - 6: Niue Country Report: Tropical Cyclone Season 1996-97 & 1997–98. RA V Tropical Cyclone Committee for the South Pacific and the South-East Indian Ocean Seventh Session. 1998.
↑Economic and Social Commission for Asia and the Pacific (March 10, 2003). "2002 Annual Tropical Cyclones Review"(PDF). World Meteorological Organization. p.52. Retrieved July 15, 2008.
↑National Weather Service Office in Guam (2013). Palau Event Report: Hurricane. National Climatic Data Center (Report). National Oceanic and Atmospheric Administration. Retrieved August 3, 2015.
12J. L. H. Paulhaus (1973). World Meteorological Organization Operational Hydrology Report No. 1: Manual For Estimation of Probable Maximum Precipitation. World Meteorological Organization. p.178.
↑Padgett, Gary; Kevin Boyle; John Wallace; Huang Chunliang; Simon Clarke (October 26, 2006). "Monthly Global Tropical Cyclone Summary June 2004". Australian Severe Weather Index. Jimmy Deguara. Retrieved January 13, 2007.
↑Radford, Deirdre A; Blong, Russell J (1992). Natural Disasters in the Solomon Islands(PDF). Vol.1 (2ed.). The Australian International Development Assistance Bureau. pp.125–126. Archived from the original(PDF) on May 2, 2014. Retrieved April 25, 2016.
↑Tropical Cyclone Raquel (Report). Australian Bureau of Meteorology. 2015. Archived from the original on January 20, 2016. Retrieved April 25, 2016.
12Central Weather Bureau (2010). "侵台颱風資料庫". Retrieved October 19, 2011.
↑Unattributed (September 9, 2009). "莫拉克颱風暴雨量及洪流量分析"(PDF). Water Resources Agency, Ministry of Economic Affairs, Republic of China. Retrieved July 17, 2011.
↑Unattributed (September 9, 2009). "莫拉克颱風暴雨量及洪流量分析"(PDF). Water Resources Agency, Ministry of Economic Affairs, Republic of China. Retrieved July 17, 2011.
↑"113山陀兒颱風". 水利災害應變學習中心 (in Chinese). 經濟部水利署. Retrieved April 18, 2025.
↑Joint Typhoon Warning Center; Naval Pacific Meteorology and Oceanography Center (1988). Annual Tropical Cyclone Report: 1987(PDF) (Report). United States Navy, United States Air Force. Retrieved July 1, 2014.
↑Tonga Meteorological Services (April 9, 2009). Cyclone Lin(PDF) (Meteorological Report). Tongan Ministry of Transport. Archived from the original(PDF) on January 20, 2016. Retrieved June 7, 2012.
↑Woodroffe, Colin D. (1983). "The Impact of Cyclone Isaac on the Coast of Tonga". Pacific Science. 37 (3). University of Hawaii: 181–210. hdl:10125/675. ISSN0030-8870.
↑Tonga Meteorological Services (March 30, 2006). Cyclone Vainau(PDF) (Meteorological Report). Ministry of Civil Aviation. Archived(PDF) from the original on February 22, 2012. Retrieved June 7, 2012.
↑Tonga Meteorology & Coast Watch Services (February 11, 2012). Tropical Cyclone "Cyril"(PDF) (Meteorological report). Ministry of Transport. Archived from the original(PDF) on February 22, 2012. Retrieved June 7, 2012.
↑Tonga Meteorology & Coast Watch Services (January 21, 2011). Tropical Cyclone "Wilma"(PDF) (Meteorological report). Ministry of Transport. p.3. Archived(PDF) from the original on January 20, 2016. Retrieved June 7, 2012.
↑"Hydrological Data UK 1986 Yearbook"(PDF). Natural Environment Research Council. British Geological Survey Institute of Hydrology. Retrieved October 15, 2022.
12Terry Tucker (1966). Beware the Hurricane! The Story of the Cyclonic Tropical Storms That Have Struck Bermuda and the Islanders' Folk-lore Regarding Them (1ed.). The Hamilton Press. p.206.
↑Barnes, Jay (May 2007). "Hurricanes in the Sunshine State, 1900–1949". Florida's hurricane history (2nded.). United States: The University of North Carolina Press. p.165. ISBN978-0-8078-5809-7.
↑Knabb, Richard D. (June 10, 2006). Tropical Depression One Advisory Number 2 (National Hurricane Center Public Advisory). Miami, Florida: National Hurricane Center. Retrieved July 17, 2019.
↑Annual Report 2010–2011(PDF) (Report). Grand Cayman, Cayman Islands: Hazard Management Department of the Cayman Islands. n.d. p.9. Retrieved July 17, 2019.
↑Beven, Jack (January 23, 2002). Hurricane Michelle(PDF) (Tropical Cyclone Report). Miami, Florida: National Hurricane Center. p.8. Retrieved July 17, 2019.
↑Kodama. NATIONAL WEATHER SERVICE HONOLULU HI. National Weather Service (Report). National Oceanic and Atmospheric Administration. Archived from the original on August 26, 2018. Retrieved August 26, 2018.
↑Central Pacific Hurricane Center. Tropical Cyclones During the Years 1900-1952 (Report). United States National Oceanic and Atmospheric Administration's National Weather Service. Retrieved January 26, 2007.
↑Meg Wagner, Paul P. Murphy, Mike Hayes and Fernando Alfonso III (September 19, 2019). "Serious flooding in Texas". cnn.com. CNN. Retrieved September 19, 2019.{{cite web}}: CS1 maint: multiple names: authors list (link)
↑Roth, David M.; Hydrometeorological Prediction Center. "Remains of Paul"(GIF). Tropical Cyclone Point Maxima. United States National Oceanic and Atmospheric Administration's National Weather Service. Retrieved December 28, 2007.
This page is based on this Wikipedia article Text is available under the CC BY-SA 4.0 license; additional terms may apply. Images, videos and audio are available under their respective licenses.


