The 2007–08 South Pacific cyclone season was one of the least active South Pacific tropical cyclone seasons on record, with only four tropical cyclones occurring within the South Pacific basin to the east of 160°E. The season officially ran from November 1, 2007, until April 30, 2008, although the first cyclone, Tropical Depression 01F, developed on October 17. The most intense tropical cyclone of the season was Severe Tropical Cyclone Daman, which reached a minimum pressure of 925 hPa (27.32 inHg) as it affected Fiji. After the season had ended, the names Daman, Funa, and Gene were retired from the tropical cyclone naming lists.
The 2006–07 South Pacific cyclone season was an event in the annual cycle of tropical cyclone formation. It began on November 1, 2006 and ended on April 30, 2007. These dates conventionally delimit the period of each year when most tropical cyclones form in the southern Pacific Ocean east of 160°E. Additionally, the regional tropical cyclone operational plan defines a tropical cyclone year separately from a tropical cyclone season, and the "tropical cyclone year" runs from July 1, 2006 to June 30, 2007.

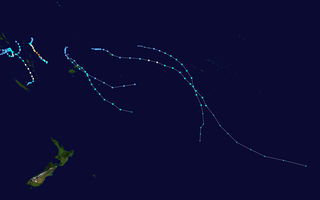
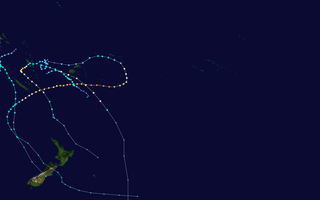
The 2003–04 South Pacific cyclone season was a below-average season with only three tropical cyclones occurring within the South Pacific to the east of 160°E. The season officially ran from November 1, 2003 to April 30, 2004 with the first disturbance of the season forming on December 4 and the last disturbance dissipating on April 23. This is the period of the year when most tropical cyclones form within the South Pacific Ocean.

The 2008–09 South Pacific cyclone season was a below average tropical cyclone season, which featured six named tropical cyclones compared to an average of about nine. Ahead of the season officially starting on November 1, 2008, the Island Climate Update tropical cyclone outlook predicted that the season, would feature an average risk of tropical cyclones impacting the South Pacific between 160°E and 120°W. The first tropical disturbance of the season developed to the northeast of the Samoan Islands on December 1, however, it remained weak and was last noted during the next day.

Severe Tropical Cyclone Xavier was a strong pre-season cyclone that formed on October 20, 2006 to the north of the Santa Cruz Islands. Cyclone Xavier was also the strongest storm of the season. During the next day it rapidly developed and was designated as Tropical Depression 01F later that day, before being designated as Tropical Cyclone Xavier while over Santa Cruz early on October 22. Later on October 22, Xavier intensified into a category 3 severe tropical cyclone on the Australian Tropical Cyclone Intensity Scale, before passing over Tikopia early the next day. Xavier then reached its peak wind speeds of 175 km/h, which made it a Category 4 cyclone early on October 24. Xavier stayed at its peak wind speeds until early the next day when it started to rapidly weaken, becoming a depression early on October 26. The remnants of Xavier persisted until October 28 before dissipating. There were no casualties reported as a result of the storm and little impact reported in the Solomon Islands and Vanuatu.

The 1990–91 South Pacific cyclone season was one of the least active tropical cyclone seasons on record, with only two tropical cyclones occurring within the South Pacific basin to the east of 160°E. The season officially ran from November 1, 1990 to April 30, 1991, with the first disturbance of the season forming on November 23, 1990, while the final disturbance dissipated on May 19, 1991. During the season there were no deaths recorded from any of the tropical cyclones while they were within the basin. However, six people were killed by Cyclone Joy, when it made landfall on Australia. As a result of the impacts caused by Joy and Sina, the names were retired from the tropical cyclone naming lists.
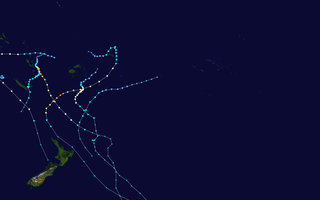
The 2010–11 South Pacific cyclone season was an average tropical cyclone season, with seven tropical cyclones and five severe tropical cyclones developing during the season. The season ran from November 1, 2010 until April 30, 2011, though if any tropical cyclones had developed between July 1, 2010 and June 30, 2011, the official tropical cyclone year, they would have been counted towards the season's total. Within the South Pacific basin tropical cyclones were officially monitored by the Fiji Meteorological Service's Regional Specialized Meteorological Center in Nadi, Fiji, north of 25°S, and to the south the Meteorological Service of New Zealand's Tropical Cyclone Warning Center in Wellington, New Zealand. Any disturbances forming in the region were designated with a sequential number suffixed by the letter F. In addition, the United States Military's Joint Typhoon Warning Center unofficially monitored parts of the basin during the season, where any systems judged to have achieved tropical storm strength or greater received a number suffixed with the letter P. RSMC Nadi and TCWC Wellington both use the Australian Tropical Cyclone Intensity Scale, and measure wind speeds over a period of ten minutes, while the JTWC measures sustained winds over a period of one minute which can be applied to the Saffir–Simpson hurricane scale. Seven named storms formed or moved into the South Pacific basin during the 2010–11 season, the strongest of which was Severe Tropical Cyclone Wilma in late January.

The 2012–13 South Pacific cyclone season was a below average tropical cyclone season, with five tropical cyclones occurring within the basin between 160°E and 120°W. The season officially ran from November 1, 2012, to April 30, 2013, however the last tropical disturbance was last noted on May 1, as it moved into the subtropics. During the season, tropical cyclones were officially monitored by the Fiji Meteorological Service (FMS), Australian Bureau of Meteorology (BoM) and New Zealand's MetService. The United States Joint Typhoon Warning Center (JTWC) and other national meteorological services including Météo-France and NOAA also monitored the basin during the season. During the season there were 22 significant tropical disturbances assigned a number and a F suffix by the FMS's Regional Specialized Meteorological Center in Nadi, Fiji (RSMC Nadi), including Severe Tropical Cyclone Sandra which moved into the basin from the Australian region on March 9. The BoM, MetService and RSMC Nadi all estimated sustained wind speeds over a period of 10-minutes and used the Australian tropical cyclone intensity scale, while the JTWC estimated sustained winds over a 1-minute period, which are subsequently compared to the Saffir–Simpson hurricane wind scale (SSHS).

The 2013–14 South Pacific cyclone season was a slightly below average tropical cyclone season, with six tropical cyclones occurring within the basin between 160°E and 120°W. The season ran from November 1, 2013, to April 30, 2014, however, the first four tropical disturbances occurred during October 2013 and were included as a part of the season. During the season, tropical cyclones were officially monitored by the Fiji Meteorological Service (FMS), Australian Bureau of Meteorology (BoM) and New Zealand's MetService. The United States Joint Typhoon Warning Center (JTWC) and other national meteorological services including Météo-France and NOAA also monitored the basin during the season. During the season there were 21 significant tropical disturbances were assigned a number and an "F" suffix by the FMS's Regional Specialized Meteorological Center in Nadi, Fiji (RSMC Nadi), including the remnants of Tropical Cyclone Hadi from the Australian region. The BoM, MetService and RSMC Nadi all estimated sustained wind speeds over a period of 10-minutes and used the Australian tropical cyclone intensity scale, while the JTWC estimated sustained winds over a 1-minute period, which are subsequently compared to the Saffir–Simpson hurricane wind scale (SSHS).
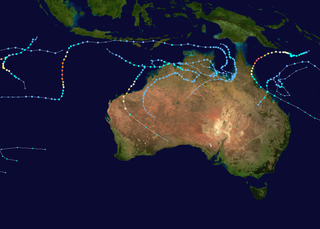
The 2013–14 Australian region cyclone season was a slightly below-average tropical cyclone season, with 10 tropical cyclones occurring within the Australian region. It officially started on 1 November 2013, and ended on 30 April 2014. The regional tropical cyclone operational plan defines a "tropical cyclone year" separately from a "tropical cyclone season"; the "tropical cyclone year" began on 1 July 2013 and ended on 30 June 2014.

The 2014–15 Australian region cyclone season was a slightly below average tropical cyclone season, though it featured numerous intense cyclones. The season officially ran from 1 November 2014, to 30 April 2015, however, a tropical cyclone could form at any time between 1 July 2014, and 30 June 2015, and would count towards the season total. During the season, tropical cyclones were officially monitored, by one of the five Tropical Cyclone Warning Centres (TCWCs) that are operated in this region.

The 2015–16 Australian region cyclone season was the least active Australian region cyclone season since reliable records started during 1969, with only three named tropical cyclones developing in the region. Reasons for the low activity during the year included a positive Indian Ocean Dipole occurring and the 2014–16 El Niño event. Ahead of the season starting; the Australian Bureau of Meteorology predicted that there was a 91% chance that the season would be below average. As the 2015–16 tropical cyclone year opened on 1 July 2015, the newly named Tropical Cyclone Raquel moved south-westward into the Australian region. Over the next couple of days, the system meandered around 160°E and moved through the Solomon Islands, before it was last noted on 5 July. The basin subsequently remained quiet with only several weak tropical lows developing, before the first named tropical cyclone of the season was named Stan during 29 January 2016.

The 2014–15 South Pacific cyclone season was a slightly-below average tropical cyclone season, with five tropical cyclones occurring within the basin between 160°E and 120°W. The season officially ran from November 1, 2014, to April 30, 2015. During the season, tropical cyclones were officially monitored by the Regional Specialized Meteorological Center (RSMC) in Nadi, Fiji and the Tropical Cyclone Warning Centers in Brisbane, Australia and Wellington, New Zealand. The United States Armed Forces through the Joint Typhoon Warning Center (JTWC) also monitored the basin and issued unofficial warnings for American interests. RSMC Nadi attaches a number and an F suffix to tropical disturbances that form in or move into the basin while the JTWC designates significant tropical cyclones with a number and a P suffix. RSMC Nadi, TCWC Wellington and TCWC Brisbane all use the Australian Tropical Cyclone Intensity Scale and estimate windspeeds over a period of ten minutes, while the JTWC estimated sustained winds over a 1-minute period, which are subsequently compared to the Saffir–Simpson hurricane wind scale (SSHWS).

The 2015–16 South Pacific cyclone season was one of the most disastrous South Pacific tropical cyclone seasons on record, with a total of 50 deaths and $1.405 billion in damage. Throughout the season, 8 systems attained tropical cyclone status, whilst 5 became severe tropical cyclones. The most notable cyclone of the season by far was Winston, which attained a minimum pressure of 884 hPa, and maximum ten-minute sustained winds of 175 mph (280 km/h), making it the most intense tropical cyclone on record in the Southern Hemisphere. Winston went on to devastate Fiji, causing $1.4 billion in damage and 44 deaths across the country.
The 2017–18 South Pacific cyclone season was a slightly below-average season that produced 6 tropical cyclones, 3 of which became severe tropical cyclones. The season officially began on November 1, 2017, and ended on April 30, 2018; however, a tropical cyclone could form at any time between July 1, 2017, and June 30, 2018, and would count towards the season total. During the season, tropical cyclones were officially monitored by the Fiji Meteorological Service, MetService and the Australian Bureau of Meteorology, while the United States Joint Typhoon Warning Center (JTWC) also monitored the basin and issued warnings for American interests. The FMS attaches a number and an F suffix to significant tropical disturbances that form in or move into the basin, while the JTWC designates significant tropical cyclones with a number and a P suffix. The BoM, FMS and MetService all use the Australian Tropical Cyclone Intensity Scale and estimate wind speeds over a period of ten minutes, while the JTWC estimates sustained winds over a 1-minute period, which are subsequently compared to the Saffir–Simpson hurricane wind scale (SSHWS).

The 2018–19 South Pacific cyclone season was a below-average season that produced 5 tropical cyclones, 2 of which became severe tropical cyclones. The season officially runs from November 1, 2018, to April 30, 2019; however, a tropical cyclone could have formed at any time between July 1, 2018, and June 30, 2019, and would count towards the season total. During the season, tropical cyclones were officially monitored by the Fiji Meteorological Service, Australian Bureau of Meteorology, and New Zealand's MetService. The United States Armed Forces through the Joint Typhoon Warning Center (JTWC) also monitored the basin and issued warnings for American interests. RSMC Nadi attaches a number and an F suffix to tropical disturbances that form in or move into the basin, while the JTWC designates significant tropical cyclones with a number and a P suffix. The FMS, the BoM and MetService all use the Australian Tropical Cyclone Intensity Scale and estimate wind speeds over a period of ten minutes, while the JTWC estimates sustained winds over a 1-minute period, which are subsequently compared to the Saffir–Simpson hurricane wind scale (SSHWS).

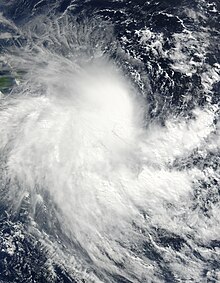
Severe Tropical Cyclone Freda was an intense tropical cyclone that developed during the 2012–13 South Pacific cyclone season and affected New Caledonia and the Solomon Islands as a weak tropical cyclone. The system that was to become Cyclone Freda was first classified on 26 December 2012, as a tropical disturbance. It gradually developed and was classified as a tropical cyclone and named Freda as it passed through the Solomon Islands on 28 December.

During 2015, tropical cyclones formed in seven major bodies of water, commonly known as tropical cyclone basins. Tropical cyclones will be assigned names by various weather agencies if they attain maximum sustained winds of 35 knots. During the year, one hundred thirty-four systems have formed and ninety-two were named. The most intense storm of the year was Hurricane Patricia, with maximum 1-minute sustained wind speeds of 345 km/h (215 mph) and a minimum pressure of 872 hPa (25.75 inHg). The deadliest tropical cyclone was Cyclone Komen, which caused 280 fatalities in Southeast India and Bangladesh, while the costliest was Typhoon Mujigae, which caused an estimated $4.25 billion USD in damage after striking China. Forty Category 3 tropical cyclones formed, including nine Category 5 tropical cyclones in the year. The accumulated cyclone energy (ACE) index for the 2015, as calculated by Colorado State University (CSU) was 1047 units.

The 2023–24 South Pacific cyclone season was a below-average season within the South Pacific Ocean to the east of 160°E. The season officially started on November 1, 2023, and ended on April 30, 2024, however a tropical cyclone could form between July 1, 2023, and June 30, 2024, and still be included in the season, as shown by Cyclone Lola which formed in October. During the season, tropical cyclones will be officially monitored by the Fiji Meteorological Service, Australian Bureau of Meteorology and New Zealand's MetService. The United States Armed Forces through the Joint Typhoon Warning Center (JTWC) will also monitor the basin and issue unofficial warnings for American interests. The FMS attaches a number and an F suffix to systems that are active in the basin while the JTWC designates significant tropical cyclones with a number and a P suffix. The BoM, FMS and MetService all use the Australian Tropical Cyclone Intensity Scale and estimate winds with a 10-minute period, while the JTWC estimates winds over a 1-minute period, which are subsequently compared to the Saffir–Simpson hurricane wind scale (SSHWS).