Lili's precursor tropical low caused significant flooding in several villages in Indonesia's Maluku province as a result of heavy rainfall. Flooding also occurred in many locations throughout East Timor,causing damage to infrastructure and cutting off roads. Strong winds were experienced along the length of the cyclone's track,as well as on exposed coastal sections of far-northern Australia;namely the Top End and northern Kimberley,and nearby islands. No injuries or fatalities were reported in connection with the cyclone.[3]
Meteorological history
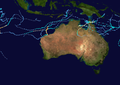
Map plotting the storm's track and intensity,according to the Saffir–Simpson scale
Lili continued slowly southwards towards Australia during 9May. Despite the otherwise favourable environmental conditions, the development of the storm was hindered by the presence of dry air in the middle and upper layers of the troposphere.[11] Following only a small amount of further intensification, Lili reached peak intensity at 18:00UTC on 9May, while located halfway between Timor and the Tiwi Islands. As a mid-range Category1 tropical cyclone, Lili had ten-minute sustained winds of 75km/h (47mph), gusting to 100km/h (62mph), and a minimum barometric pressure of 997hPa (29.44inHg).[12] The JTWC indicated that one-minute mean winds of 85km/h (53mph) were present at the storm's centre.[10] Lili began to decay soon afterwards, as dry air continued to infiltrate the cyclone's inner core and the frictional effects of land interaction inhibited the storm's circulation.[13] Wind velocity decreased steadily, and the BMKG indicated that the system had fallen below tropical cyclone intensity at 12:00UTC on 10May.[14] Assuming a westwards track under the influence of a strong subtropicalridge anchored over Australia, the system's structure continued to deteriorate.[15] The JTWC issued their final warning on the system at 21:00UTC, noting that deep convection had become almost entirely absent, leaving the storm's low-level circulation centre exposed.[16] Lili accelerated west-northwestwards across the Timor Sea, before dissipating while making landfall in northern East Timor, at 06:00UTC on 11 May.[10][17]
Impacts
Ex-Tropical Cyclone Lili making landfall in northeastern East Timor on 11May2019, just prior to dissipation
Prior to development into a tropical cyclone, Lili's precursor tropical low tracked southwards across the southern Banda Sea, bringing the storm near Indonesia's Maluku Islands.[9] Heavy rainfall and strong winds were experienced on the islands for several days, with impacts peaking at around 12:00 UTC on 8May. The prolonged rainfall caused significant flooding in numerous places across the region, with the most severe effects occurring in the Southeast Maluku Regency.[3] In particular, the villages of Laitutun on Leti Island; Tounwawan in Moa Lakor; and Luang Timur in Mdona Hiera, experienced major inundation to an average depth of 1.5m (4.9ft). The flooding and strong winds resulted in widespread damage in the villages. Many houses and numerous public facilities sustained damage, causing many residents to be displaced.[18][19] Lili's strong winds also generated dangerous sea conditions, reportedly causing a ship to sink.[9][3]
Despite not making landfall at tropical cyclone strength, Ex-Tropical Cyclone Lili caused significant impacts in East Timor. Protracted periods of heavy rainfall, with widespread 24-hour totals of 100–150mm (3.9–5.9in), led to river level rise and subsequent flooding. Many roads, bridges and other pieces of infrastructure were damaged by flooding, especially in the eastern half of the country. Other roads and bridges were also cut off or threatened by floodwaters. The primary road link from Lospalos to the national capital Dili was covered by mud and water, severely impeding the passage of traffic. Damage was sustained in the Baucau municipality from riverine flooding. A truck was also submerged in a swollen stream in the south of the country. Damaging winds were experienced on the eastern tip of East Timor, with gusts of approximately 75–100km/h (47–62mph).[20][3]
Mild impacts were also experienced across large areas of eastern Indonesia and sections of exposed coastline in the Northern Territory, northern Kimberley, and nearby islands. Strong winds and enhanced rainfall occurred throughout the region, as well as large waves and strong tides. McCluer Island, situated 30km (19mi) off the northern coast of the Top End; and Troughton Island, located 15km (9.3mi) off Western Australia's far-northern coast, both experienced sustained winds exceeding 50km/h (31mph), with gusts reaching 63km/h (39mph).[21][22] Strong winds and moderate rainfall were also observed in the Indonesian provinces of West Nusa Tenggara and East Nusa Tenggara, and in parts of Sulawesi.[18] At peak intensity, the BMKG reported that Lili's winds were generating waves of up to 6.0m (19.7ft) in height in parts of the Timor and Arafura Seas. Waves of up to 4.0m (13.1ft) in height were also generated in the ocean and waterways surrounding several islands further to the west.[9][23]
1 2 3 "Tropical Cyclone Lili Track File". National Center for Environmental Prediction. National Oceanic and Atmospheric Administration. 11 May 2019. Archived from the original on 11 May 2019. Retrieved 11 May 2019.
This page is based on this Wikipedia article Text is available under the CC BY-SA 4.0 license; additional terms may apply. Images, videos and audio are available under their respective licenses.


