In meteorology, a low-pressure area, low area or low is a region where the atmospheric pressure is lower than that of surrounding locations. Low-pressure areas are commonly associated with inclement weather, while high-pressure areas are associated with lighter winds and clear skies. Winds circle anti-clockwise around lows in the northern hemisphere, and clockwise in the southern hemisphere, due to opposing Coriolis forces. Low-pressure systems form under areas of wind divergence that occur in the upper levels of the atmosphere (aloft). The formation process of a low-pressure area is known as cyclogenesis. In meteorology, atmospheric divergence aloft occurs in two kinds of places:

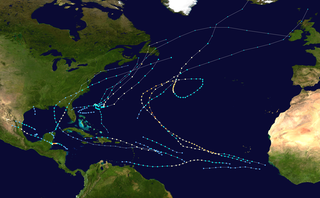
The 2000 Atlantic hurricane season was a fairly active hurricane season, but featured the latest first named storm in a hurricane season since 1992. The hurricane season officially began on June 1, and ended on November 30. It was slightly above average due to a La Niña weather pattern although most of the storms were weak. It was also the only season to have two of the storms affect Ireland. The first cyclone, Tropical Depression One, developed in the southern Gulf of Mexico on June 7 and dissipated after an uneventful duration. However, it would be almost two months before the first named storm, Alberto, formed near Cape Verde; Alberto also dissipated with no effects on land. Several other tropical cyclones—Tropical Depression Two, Tropical Depression Four, Chris, Ernesto, Nadine, and an unnamed subtropical storm—did not impact land. Five additional storms—Tropical Depression Nine, Florence, Isaac, Joyce, and Leslie—minimally affected land areas.

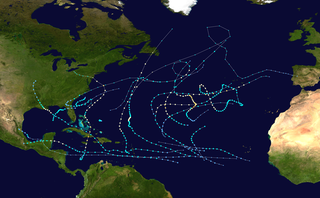
The 1992 Atlantic hurricane season was a significantly below average season for overall tropical or subtropical cyclones as only ten formed. Six of them became named tropical storms, and four of those became hurricanes; one hurricane became a major hurricane. The season was also near-average in terms of accumulated cyclone energy. The season officially started on June 1 and officially ended on November 30. However, tropical cyclogenesis is possible at any time of the year, as demonstrated by formation in April of an unnamed subtropical storm in the central Atlantic.

A mesoscale convective system (MCS) is a complex of thunderstorms that becomes organized on a scale larger than the individual thunderstorms but smaller than extratropical cyclones, and normally persists for several hours or more. A mesoscale convective system's overall cloud and precipitation pattern may be round or linear in shape, and include weather systems such as tropical cyclones, squall lines, lake-effect snow events, polar lows, and mesoscale convective complexes (MCCs), and generally forms near weather fronts. The type that forms during the warm season over land has been noted across North and South America, Europe, and Asia, with a maximum in activity noted during the late afternoon and evening hours.

Hurricane Kathleen was a Category 1 Pacific hurricane that had a destructive impact in California. On September 7, 1976, a tropical depression formed; two days later it accelerated north towards the Baja California Peninsula. Kathleen brushed the Pacific coast of the peninsula as a hurricane on September 9 and made landfall as a fast-moving tropical storm the next day. With its circulation intact and still a tropical storm, Kathleen headed north into the United States and affected California and Arizona. Kathleen finally dissipated late on September 11.

Hurricane Kyle was the fifth-longest-lived Atlantic tropical or subtropical cyclone on record. The eleventh named storm and third hurricane of the 2002 Atlantic hurricane season, Kyle developed as a subtropical cyclone on September 20 to the east-southeast of Bermuda. Looping westward, it transitioned into a tropical cyclone and became a hurricane on September 25. For the next two weeks, Kyle tracked generally westward, oscillating in strength several times because of fluctuations in environmental conditions. On October 11, the cyclone turned northeastward and made landfalls near Charleston, South Carolina, and Long Beach, North Carolina, at tropical storm status. After lasting as a cyclone for 22 days, Kyle dissipated on October 12 as it was absorbed by an approaching cold front.

Tropical cyclone rainfall forecasting involves using scientific models and other tools to predict the precipitation expected in tropical cyclones such as hurricanes and typhoons. Knowledge of tropical cyclone rainfall climatology is helpful in the determination of a tropical cyclone rainfall forecast. More rainfall falls in advance of the center of the cyclone than in its wake. The heaviest rainfall falls within its central dense overcast and eyewall. Slow moving tropical cyclones, like Hurricane Danny and Hurricane Wilma, can lead to the highest rainfall amounts due to prolonged heavy rains over a specific location. However, vertical wind shear leads to decreased rainfall amounts, as rainfall is favored downshear and slightly left of the center and the upshear side is left devoid of rainfall. The presence of hills or mountains near the coast, as is the case across much of Mexico, Haiti, the Dominican Republic, much of Central America, Madagascar, Réunion, China, and Japan act to magnify amounts on their windward side due to forced ascent causing heavy rainfall in the mountains. A strong system moving through the mid latitudes, such as a cold front, can lead to high amounts from tropical systems, occurring well in advance of its center. Movement of a tropical cyclone over cool water will also limit its rainfall potential. A combination of factors can lead to exceptionally high rainfall amounts, as was seen during Hurricane Mitch in Central America.

The United States tropical cyclone rainfall climatology concerns the amount of precipitation, primarily in the form of rain, which occurs during tropical cyclones and their extratropical cyclone remnants across the United States. Typically, five tropical cyclones and their remnants impact the country each year, contributing between a tenth and a quarter of the annual rainfall across the southern tier of the country. The highest rainfall amounts appear close to the coast, with lesser amounts falling farther inland. Obstructions to the precipitation pattern, such as the Appalachian Mountains, focus higher amounts from northern Georgia through New England. While most impacts occur with systems moving in from the Atlantic Ocean or Gulf of Mexico, some emanate from the eastern Pacific Ocean, with a few crossing Mexico before impacting the Southwest. Those making landfall within the Southeast portion of the country tend to have the greatest potential for heavy rains.

Tropical Storm Beryl was an unusual Atlantic tropical cyclone that formed over southeastern Louisiana in August 1988. The second tropical storm of the 1988 Atlantic hurricane season, Beryl developed from a slow-moving trough of low pressure on August 8. It tracked southeastward into the coastal waters of eastern Louisiana, and Beryl reached peak winds of 50 mph (80 km/h) while located about 75 miles (121 km) southeast of New Orleans. The storm turned to the northwest over Louisiana and Texas, and slowly dissipated. The remnants of Beryl continued northward into the central United States, dropping some rainfall and providing relief to a severe heat wave.

Tropical cyclone forecasting is the science of forecasting where a tropical cyclone's center, and its effects, are expected to be at some point in the future. There are several elements to tropical cyclone forecasting: track forecasting, intensity forecasting, rainfall forecasting, storm surge, tornado, and seasonal forecasting. While skill is increasing in regard to track forecasting, intensity forecasting skill remains unchanged over the past several years. Seasonal forecasting began in the 1980s in the Atlantic basin and has spread into other basins in the years since.
The following outline is provided as an overview of and topical guide to tropical cyclones:

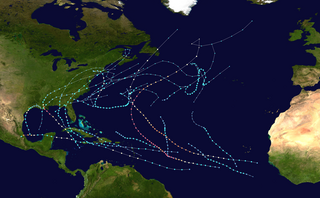
The 2011 Atlantic hurricane season was the second in a group of three very active Atlantic hurricane seasons, each with 19 named storms, tied with 1887, 1995, 2010, and 2012. The above-average activity was mostly due to a La Niña that persisted during the previous year. Of the season's 19 tropical storms, only seven strengthened into hurricanes, and four of those became major hurricanes: Irene, Katia, Ophelia, and Rina. The season officially began on June 1 and ended on November 30, dates which conventionally delimit the period during each year in which most tropical cyclones develop in the Atlantic Ocean. However, the first tropical storm of the season, Arlene, did not develop until nearly a month later. The final system, Tropical Storm Sean, dissipated over the open Atlantic on November 11.

Tropical Storm Candy produced minor impact in the state of Texas during the 1968 Atlantic hurricane season. The third tropical cyclone of the annual season, it developed from a tropical disturbance in the southwestern Gulf of Mexico on June 22. Gradual strengthening occurred, with the depression becoming Tropical Storm Candy on the following day. The storm reached its peak intensity of 70 mph (110 km/h) later that day and made landfall Port Aransas, Texas on June 23. Candy weakened into a tropical depression only hours after moving inland. However, the system remained a designated cyclone until June 26, at which time it completed extratropical transition over the state of Michigan.

The 2010 Atlantic hurricane season was the first of three consecutive very active Atlantic hurricane seasons, each with 19 named storms. This above average activity included 12 hurricanes, equaling the number that formed in 1969. Only the 2020 and 2005 seasons have had more, at 14 and 15 hurricanes respectively. Despite the high number of hurricanes, not one hurricane hit the United States making the season the only season with 10 or more hurricanes without a United States landfall. The overall tropical cyclone count in the Atlantic exceeded that in the West Pacific for only the second time on record. The season officially began on June 1 and ended on November 30, dates that conventionally delimit the period during each year when tropical cyclone formation is most likely. The first cyclone, Alex intensified into the first June hurricane since Allison in 1995. The month of September featured eight named storms. October featured five hurricanes, including Tomas, which became the latest on record in a calendar year to move through the Windward Islands. Activity was represented with an accumulated cyclone energy (ACE) value of 165 units, which was the eleventh highest value on record at the time. The activity in 2010 was heightened due to a very strong La Niña, which also led to an inactive Pacific hurricane season.

The 2012 Atlantic hurricane season was the final year in a string of three consecutive very active seasons since 2010, with 19 tropical storms. The 2012 season was also a costly one in terms of property damage, mostly due to Hurricane Sandy. The season officially began on June 1 and ended on November 30, dates that conventionally delimit the period during each year in which most tropical cyclones form in the Atlantic Ocean. However, Alberto, the first named system of the year, developed on May 19 – the earliest date of formation since Subtropical Storm Andrea in 2007. A second tropical cyclone, Beryl, developed later that month. This was the first occurrence of two pre-season named storms in the Atlantic basin since 1951. It moved ashore in North Florida on May 29 with winds of 65 mph (105 km/h), making it the strongest pre-season storm to make landfall in the Atlantic basin. This season marked the first time since 2009 where no tropical cyclones formed in July. Another record was set by Hurricane Nadine later in the season; the system became the fourth-longest-lived tropical cyclone ever recorded in the Atlantic, with a total duration of 22.25 days. The final storm to form, Tony, dissipated on October 25 – however, Hurricane Sandy, which formed before Tony, became extratropical on October 29.

The 2020 Atlantic hurricane season was the most active Atlantic hurricane season on record, in terms of number of systems. It featured a total of 31 tropical or subtropical cyclones, with all but one cyclone becoming a named storm. Of the 30 named storms, 14 developed into hurricanes, and a record-tying seven further intensified into major hurricanes. It was the second and final season to use the Greek letter storm naming system, the first being 2005, the previous record. Of the 30 named storms, 11 of them made landfall in the contiguous United States, breaking the record of nine set in 1916. During the season, 27 tropical storms established a new record for earliest formation date by storm number. This season also featured a record ten tropical cyclones that underwent rapid intensification, tying it with 1995, as well as tying the record for most Category 4 hurricanes in a singular season in the Atlantic Basin. This unprecedented activity was fueled by a La Niña that developed in the summer months of 2020, continuing a stretch of above-average seasonal activity that began in 2016. Despite the record-high activity, this was the first season since 2015 in which no Category 5 hurricanes formed.

The 2021 Atlantic hurricane season was the third-most active Atlantic hurricane season on record in terms of number of tropical cyclones, although many of them were weak and short-lived. With 21 named storms forming, it became the second season in a row and third overall in which the designated 21-name list of storm names was exhausted. Seven of those storms strengthened into a hurricane, four of which reached major hurricane intensity, which is slightly above-average. The season officially began on June 1 and ended on November 30. These dates historically describe the period in each year when most Atlantic tropical cyclones form. However, subtropical or tropical cyclogenesis is possible at any time of the year, as demonstrated by the development of Tropical Storm Ana on May 22, making this the seventh consecutive year in which a storm developed outside of the official season.

The 2022 Atlantic hurricane season was a very destructive and deadly Atlantic hurricane season. Despite having an average number of named storms, it became the third-costliest Atlantic hurricane season on record, behind only 2017 and 2005, mostly due to Hurricane Ian. The season officially began on June 1, and ended on November 30. These dates, adopted by convention, historically describe the period in each year when most subtropical or tropical cyclogenesis occurs in the Atlantic Ocean. This year's first Atlantic named storm, Tropical Storm Alex, developed five days after the start of the season, making this the first season since 2014 not to have a pre-season named storm.

The meteorological history of Hurricane Florence spanned 22 days from its inception on August 28, 2018, to its dissipation on September 18. Originating from a tropical wave over West Africa, Florence quickly organized upon its emergence over the Atlantic Ocean. Favorable atmospheric conditions enabled it to develop into a tropical depression on August 31 just south of the Cape Verde islands. Intensifying to a tropical storm the following day, Florence embarked on a west-northwest to northwest trajectory over open ocean. Initially being inhibited by increased wind shear and dry air, the small cyclone took advantage of a small area of low shear and warm waters. After achieving hurricane strength early on September 4, Florence underwent an unexpected period of rapid deepening through September 5, culminating with it becoming a Category 4 hurricane on the Saffir-Simpson scale. Thereafter, conditions again became unfavorable and the hurricane quickly diminished to a tropical storm on September 7.


