Tropical cyclone rainfall forecasting

Last updated

Hurricane QPF Rita5dayqpf.png
Hurricane QPF

Tropical cyclone rainfall forecasting involves using scientific models and other tools to predict the precipitation expected in tropical cyclones such as hurricanes and typhoons. Knowledge of tropical cyclone rainfall climatology is helpful in the determination of a tropical cyclone rainfall forecast. More rainfall falls in advance of the center of the cyclone than in its wake. The heaviest rainfall falls within its central dense overcast and eyewall. Slow moving tropical cyclones, like Hurricane Danny and Hurricane Wilma, can lead to the highest rainfall amounts due to prolonged heavy rains over a specific location. However, vertical wind shear leads to decreased rainfall amounts, as rainfall is favored downshear and slightly left of the center and the upshear side is left devoid of rainfall. The presence of hills or mountains near the coast, as is the case across much of Mexico, Haiti, the Dominican Republic, much of Central America, Madagascar, Réunion, China, and Japan act to magnify amounts on their windward side due to forced ascent causing heavy rainfall in the mountains. A strong system moving through the mid latitudes, such as a cold front, can lead to high amounts from tropical systems, occurring well in advance of its center. Movement of a tropical cyclone over cool water will also limit its rainfall potential. A combination of factors can lead to exceptionally high rainfall amounts, as was seen during Hurricane Mitch in Central America. [1]

Contents

Use of forecast models can help determine the magnitude and pattern of the rainfall expected. Climatology and persistence models, such as r-CLIPER, can create a baseline for tropical cyclone rainfall forecast skill. Simplified forecast models, such as the Kraft technique and the eight and sixteen-inch rules, can create quick and simple rainfall forecasts, but come with a variety of assumptions which may not be true, such as assuming average forward motion, average storm size, and a knowledge of the rainfall observing network the tropical cyclone is moving towards. The forecast method of TRaP assumes that the rainfall structure the tropical cyclone currently has changes little over the next 24 hours. The global forecast model which shows the most skill in forecasting tropical cyclone-related rainfall in the United States is the ECMWF IFS (Integrated Forecasting System). [2] [3]

Rainfall distribution around a tropical cyclone

The relative sizes of Typhoon Tip, Cyclone Tracy, and the United States. Typhoonsizes.svg
The relative sizes of Typhoon Tip, Cyclone Tracy, and the United States.

A larger proportion of rainfall falls in advance of the center (or eye) than after the center's passage, with the highest percentage falling in the right-front quadrant. A tropical cyclone's highest rainfall rates can lie in the right rear quadrant within a training (non-moving) inflow band. [4] Rainfall is found to be strongest in their inner core, within a degree of latitude of the center, with lesser amounts farther away from the center. Most of the rainfall in hurricanes is concentrated within its radius of gale-force winds. [5] Larger tropical cyclones have larger rain shields, which can lead to higher rainfall amounts farther from the cyclone's center. [5] Storms which have moved slowly, or loop, lead to the highest rainfall amounts. Riehl calculated that 33.97 inches (863 mm) of rainfall per day can be expected within one-half degree, or 35 miles (56 km), of the center of a mature tropical cyclone. [6] Many tropical cyclones progress at a forward motion of 10 knots, which would limit the duration of this excessive rainfall to around one-quarter of a day, which would yield about 8.50 inches (216 mm) of rainfall. This would be true over water, within 100 miles (160 km) of the coastline, [7] and outside topographic features. As a cyclone moves farther inland and is cut off from its supply of warmth and moisture (the ocean), rainfall amounts from tropical cyclones and their remains decrease quickly. [8]

Vertical wind shear

Circulation around the east side of Floyd forcing rainfall near and behind a front to its northeast Floyd1999RadarPANYNJDMP.gif
Circulation around the east side of Floyd forcing rainfall near and behind a front to its northeast

Vertical wind shear forces the rainfall pattern around a tropical cyclone to become highly asymmetric, with most of the precipitation falling to the left and downwind of the shear vector, or downshear left. In other words, southwesterly shear forces the bulk of the rainfall north-northeast of the center. [9] If the wind shear is strong enough, the bulk of the rainfall will move away from the center leading to what is known as an exposed circulation center. When this occurs, the potential magnitude of rainfall with the tropical cyclone will be significantly reduced.

Interaction with frontal boundaries and upper level troughs

As a tropical cyclone interacts with an upper-level trough and the related surface front, a distinct northern area of precipitation is seen along the front ahead of the axis of the upper level trough. Surface fronts with precipitable water amounts of 1.46 inches (37 mm) or more and upper level divergence overhead east of an upper level trough can lead to significant rainfall. [10] This type of interaction can lead to the appearance of the heaviest rainfall falling along and to the left of the tropical cyclone track, with the precipitation streaking hundreds of miles or kilometers downwind from the tropical cyclone. [11]

Mountains

Moist air forced up the slopes of coastal hills and mountain chains can lead to much heavier rainfall than in the coastal plain. [12] This heavy rainfall can lead to landslides, which still cause significant loss of life such as seen during Hurricane Mitch in Central America, where several thousand perished. [13]

Tools used in preparation of forecast

r-CLIPER for Isabel (2003) Isabel2003rcliper.jpg
r-CLIPER for Isabel (2003)

Climatology and persistence

The Hurricane Research Division of the Atlantic Oceanographic and Meteorological Laboratory created the r-CLIPER (rainfall climatology and persistence) model to act as a baseline for all verification regarding tropical cyclone rainfall. The theory is, if the global forecast models cannot beat predictions based on climatology, then there is no skill in their use. There is a definite advantage to using the forecast track with r-CLIPER because it could be run out 120 hours/5 days with the forecast track of any tropical cyclone globally within a short amount of time. [14] The short range variation which uses persistence is the Tropical Rainfall Potential technique (TRaP) technique, which uses satellite-derived rainfall amounts from microwave imaging satellites and extrapolates the current rainfall configuration forward for 24 hours along the current forecast track. [15] This technique's main flaw is that it assumes a steady state tropical cyclone which undergoes little structural change with time, which is why it is only run forward for 24 hours into the future. [16]

GFS for Isabel (2003) GFSisabel2003.jpg
GFS for Isabel (2003)

Numerical weather prediction

Computer models can be used to diagnose the magnitude of tropical cyclone rainfall. Since forecast models output their information on a grid, they only give a general idea as to the areal coverage of moderate to heavy rainfall. No current forecast models run at a small enough grid scale (1 km or smaller) to be able to detect the absolute maxima measured within tropical cyclones. Of the United States forecasting models, the best performing model for tropical cyclone rainfall forecasting is known as the GFS, or Global Forecasting System. [17] The GFDL model has been shown to have a high bias concerning the magnitude of heavier core rains within tropical cyclones. [18] Beginning in 2007, the NCEP Hurricane-WRF became available to help predict rainfall from tropical cyclones. [19] Recent verification shows that both the European ECMWF forecast model and North American Mesoscale Model (NAM) show a low bias with heavier rainfall amounts within tropical cyclones. [20]

Kraft rule

During the late 1950s, this rule of thumb came into being, developed by R. H. Kraft. [21] It was noted from rainfall amounts (in imperial units) reported by the first order rainfall network in the United States that the storm total rainfall fit a simple equation: 100 divided by the speed of motion in knots. [22] This rule works, even in other countries, as long as a tropical cyclone is moving and only the first order or synoptic station network (with observations spaced about 60 miles (97 km) apart) are used to derive storm totals. Canada uses a modified version of the Kraft rule which divides the results by a factor of two, which takes into account the lower sea surface temperatures seen around Atlantic Canada and the prevalence of systems undergoing vertical wind shear at their northerly latitudes. [20] The main problem with this rule is that the rainfall observing network is denser than either the synoptic reporting network or the first order station networks, which means the absolute maximum is likely to be underestimated. Another problem is that it does not take the size of the tropical cyclone or topography into account.

See also

Related Research Articles

<span class="mw-page-title-main">1992 Atlantic hurricane season</span>

The 1992 Atlantic hurricane season was a significantly below average season for overall tropical or subtropical cyclones as only ten formed. Six of them became named tropical storms, and four of those became hurricanes; one hurricane became a major hurricane. The season was also near-average in terms of accumulated cyclone energy. The season officially started on June 1 and officially ended on November 30. However, tropical cyclogenesis is possible at any time of the year, as demonstrated by formation in April of an unnamed subtropical storm in the central Atlantic.

<span class="mw-page-title-main">Weather Prediction Center</span> United States weather agency

The Weather Prediction Center (WPC), located in College Park, Maryland, is one of nine service centers under the umbrella of the National Centers for Environmental Prediction (NCEP), a part of the National Weather Service (NWS), which in turn is part of the National Oceanic and Atmospheric Administration (NOAA) of the U.S. Government. Until March 5, 2013 the Weather Prediction Center was known as the Hydrometeorological Prediction Center (HPC). The Weather Prediction Center serves as a center for quantitative precipitation forecasting, medium range forecasting, and the interpretation of numerical weather prediction computer models.

<span class="mw-page-title-main">Rainband</span> Cloud and precipitation structure

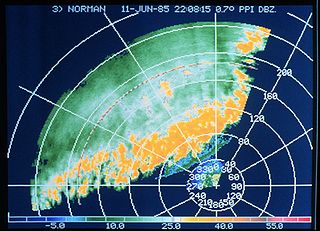
A rainband is a cloud and precipitation structure associated with an area of rainfall which is significantly elongated. Rainbands in tropical cyclones can be either stratiform or convective and are curved in shape. They consist of showers and thunderstorms, and along with the eyewall and the eye, they make up a tropical cyclone. The extent of rainbands around a tropical cyclone can help determine the cyclone's intensity.

<span class="mw-page-title-main">Mesoscale convective system</span> Complex of thunderstorms organized on a larger scale

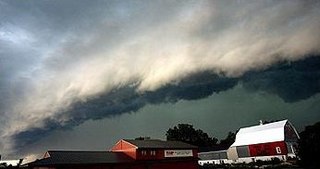
A mesoscale convective system (MCS) is a complex of thunderstorms that becomes organized on a scale larger than the individual thunderstorms but smaller than extratropical cyclones, and normally persists for several hours or more. A mesoscale convective system's overall cloud and precipitation pattern may be round or linear in shape, and include weather systems such as tropical cyclones, squall lines, lake-effect snow events, polar lows, and mesoscale convective complexes (MCCs), and generally forms near weather fronts. The type that forms during the warm season over land has been noted across North and South America, Europe, and Asia, with a maximum in activity noted during the late afternoon and evening hours.

<span class="mw-page-title-main">Tropical cyclone rainfall climatology</span>

A tropical cyclone rainfall climatology is developed to determine rainfall characteristics of past tropical cyclones. A tropical cyclone rainfall climatology can be used to help forecast current or upcoming tropical cyclone impacts. The degree of a tropical cyclone rainfall impact depends upon speed of movement, storm size, and degree of vertical wind shear. One of the most significant threats from tropical cyclones is heavy rainfall. Large, slow moving, and non-sheared tropical cyclones produce the heaviest rains. The intensity of a tropical cyclone appears to have little bearing on its potential for rainfall over land, but satellite measurements over the last several years show that more intense tropical cyclones produce noticeably more rainfall over water. Flooding from tropical cyclones remains a significant cause of fatalities, particularly in low-lying areas.

<span class="mw-page-title-main">Tropical cyclone forecast model</span> Computer program that uses meteorological data to forecast tropical cyclones

A tropical cyclone forecast model is a computer program that uses meteorological data to forecast aspects of the future state of tropical cyclones. There are three types of models: statistical, dynamical, or combined statistical-dynamic. Dynamical models utilize powerful supercomputers with sophisticated mathematical modeling software and meteorological data to calculate future weather conditions. Statistical models forecast the evolution of a tropical cyclone in a simpler manner, by extrapolating from historical datasets, and thus can be run quickly on platforms such as personal computers. Statistical-dynamical models use aspects of both types of forecasting. Four primary types of forecasts exist for tropical cyclones: track, intensity, storm surge, and rainfall. Dynamical models were not developed until the 1970s and the 1980s, with earlier efforts focused on the storm surge problem.

<span class="mw-page-title-main">Hurricane Gabrielle (2001)</span> Category 1 Atlantic hurricane in 2001

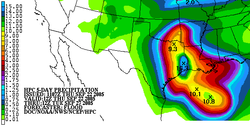
Hurricane Gabrielle was a North Atlantic hurricane that caused flooding in both Florida and Newfoundland in September 2001. It developed in the Gulf of Mexico on the same day as the September 11 attacks; after the attacks, flights were canceled nationwide for two days, and when Gabrielle struck Florida on September 14, it caused a day of additional cancellations. The storm moved ashore with winds of 70 mph (110 km/h) near Venice, a city located south of the Tampa Bay area. The combination of the winds and heavy rainfall, which peaked at 15.1 in (380 mm) in Parrish, left 570,000 customers without power along the west coast and 126,000 customers without power on the east coast. The storm caused about $230 million (2001 USD) in damage in Florida. In the Gulf of Mexico, high waves contributed to two deaths, one of which was indirect; there was also a death due to flooding in Winter Haven.

<span class="mw-page-title-main">November 2006 nor'easter</span>

The November 2006 nor'easter was a powerful extratropical cyclone that formed offshore of the Southeastern United States on November 20, bringing heavy rains, high winds, beach erosion, and coastal flooding to the Carolinas and southern New England. In addition, the earliest snowfall ever noted in both Charleston, South Carolina and Savannah, Georgia occurred on the southwest side of this cyclone. Over 10,000 were without power during the storm. No longer a nor'easter, the extratropical cyclone accelerated rapidly across the North Atlantic while rapidly strengthening, becoming a cyclonic storm again by November 25, but this time with hurricane-force sustained winds. The intense low made a cyclonic loop west of Iceland, before being absorbed by another strengthening extratropical cyclone to the west of Great Britain, late on December 1.

<span class="mw-page-title-main">Tropical cyclone</span> Rapidly rotating storm system

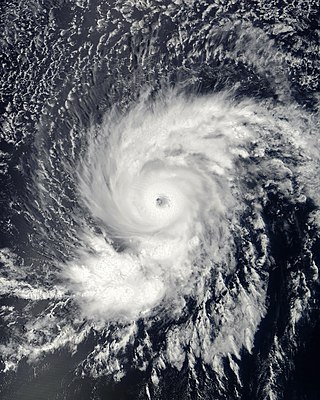
A tropical cyclone is a rapidly rotating storm system with a low-pressure center, a closed low-level atmospheric circulation, strong winds, and a spiral arrangement of thunderstorms that produce heavy rain and squalls. Depending on its location and strength, a tropical cyclone is called a hurricane, typhoon, tropical storm, cyclonic storm, tropical depression, or simply cyclone. A hurricane is a strong tropical cyclone that occurs in the Atlantic Ocean or northeastern Pacific Ocean. A typhoon occurs in the northwestern Pacific Ocean. In the Indian Ocean and South Pacific, comparable storms are referred to as "tropical cyclones". In modern times, on average around 80 to 90 named tropical cyclones form each year around the world, over half of which develop hurricane-force winds of 65 kn or more.

<span class="mw-page-title-main">United States rainfall climatology</span> Characteristics of weather in U.S.

The characteristics of United States rainfall climatology differ significantly across the United States and those under United States sovereignty. Summer and early fall bring brief, but frequent thundershowers and tropical cyclones which create a wet summer and drier winter in the eastern Gulf and lower East Coast. During the winter, and spring, Pacific storm systems bring Hawaii and the western United States most of their precipitation. Low pressure systems moving up the East Coast and through the Great Lakes, bring cold season precipitation to from the Midwest to New England, as well as Great Salt Lake. The snow to liquid ratio across the contiguous United States averages 13:1, meaning 13 inches (330 mm) of snow melts down to 1 inch (25 mm) of water.

<span class="mw-page-title-main">United States tropical cyclone rainfall climatology</span>

The United States tropical cyclone rainfall climatology concerns the amount of precipitation, primarily in the form of rain, which occurs during tropical cyclones and their extratropical cyclone remnants across the United States. Typically, five tropical cyclones and their remnants impact the country each year, contributing between a tenth and a quarter of the annual rainfall across the southern tier of the country. The highest rainfall amounts appear close to the coast, with lesser amounts falling farther inland. Obstructions to the precipitation pattern, such as the Appalachian Mountains, focus higher amounts from northern Georgia through New England. While most impacts occur with systems moving in from the Atlantic Ocean or Gulf of Mexico, some emanate from the eastern Pacific Ocean, with a few crossing Mexico before impacting the Southwest. Those making landfall within the Southeast portion of the country tend to have the greatest potential for heavy rains.

<span class="mw-page-title-main">Tropical cyclone forecasting</span> Science of forecasting how a tropical cyclone moves and its effects

Tropical cyclone forecasting is the science of forecasting where a tropical cyclone's center, and its effects, are expected to be at some point in the future. There are several elements to tropical cyclone forecasting: track forecasting, intensity forecasting, rainfall forecasting, storm surge, tornado, and seasonal forecasting. While skill is increasing in regard to track forecasting, intensity forecasting skill remains unchanged over the past several years. Seasonal forecasting began in the 1980s in the Atlantic basin and has spread into other basins in the years since.

<span class="mw-page-title-main">Tropical cyclone track forecasting</span> Predicting where a tropical cyclone is going to track over the next five days, every 6 to 12 hours

Tropical cyclone track forecasting involves predicting where a tropical cyclone is going to track over the next five days, every 6 to 12 hours. The history of tropical cyclone track forecasting has evolved from a single-station approach to a comprehensive approach which uses a variety of meteorological tools and methods to make predictions. The weather of a particular location can show signs of the approaching tropical cyclone, such as increasing swell, increasing cloudiness, falling barometric pressure, increasing tides, squalls and heavy rainfall.

<span class="mw-page-title-main">Climate of Florida</span>

The climate of the north and central parts of the U.S. state of Florida is humid subtropical. South Florida has a tropical climate. There is a defined rainy season from May through October when air-mass thundershowers that build in the heat of the day drop heavy but brief summer rainfall.

<span class="mw-page-title-main">Severe weather</span> Any dangerous meteorological phenomenon

Severe weather is any dangerous meteorological phenomenon with the potential to cause damage, serious social disruption, or loss of human life. These vary depending on the latitude, altitude, topography, and atmospheric conditions. High winds, hail, excessive precipitation, and wildfires are forms and effects, as are thunderstorms, downbursts, tornadoes, waterspouts, tropical cyclones, and extratropical cyclones. Regional and seasonal phenomena include blizzards (snowstorms), ice storms, and duststorms.

<span class="mw-page-title-main">Mexico tropical cyclone rainfall climatology</span>

Mexico tropical cyclone rainfall climatology discusses precipitation characteristics of tropical cyclones that have struck Mexico over the years. One-third of the annual rainfall received along the Mexican Riviera and up to half of the rainfall received in Baja California Sur is directly attributable to tropical cyclones moving up the west coast of Mexico. The central plateau is shielded from the high rainfall amounts seen on the oceanward slopes of the Sierra Madre Oriental and Occidental mountain chains.

<span class="mw-page-title-main">Quantitative precipitation forecast</span> Expected amount of melted precipitation

The quantitative precipitation forecast is the expected amount of melted precipitation accumulated over a specified time period over a specified area. A QPF will be created when precipitation amounts reaching a minimum threshold are expected during the forecast's valid period. Valid periods of precipitation forecasts are normally synoptic hours such as 00:00, 06:00, 12:00 and 18:00 GMT. Terrain is considered in QPFs by use of topography or based upon climatological precipitation patterns from observations with fine detail. Starting in the mid-to-late 1990s, QPFs were used within hydrologic forecast models to simulate impact to rivers throughout the United States. Forecast models show significant sensitivity to humidity levels within the planetary boundary layer, or in the lowest levels of the atmosphere, which decreases with height. QPF can be generated on a quantitative, forecasting amounts, or a qualitative, forecasting the probability of a specific amount, basis. Radar imagery forecasting techniques show higher skill than model forecasts within 6 to 7 hours of the time of the radar image. The forecasts can be verified through use of rain gauge measurements, weather radar estimates, or a combination of both. Various skill scores can be determined to measure the value of the rainfall forecast.

<span class="mw-page-title-main">Hurricane Flossie (2007)</span> Category 4 Pacific hurricane in 2007

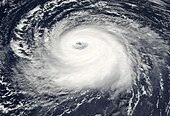
Hurricane Flossie was a powerful Pacific tropical cyclone that brought squally weather and light damage to Hawaii in August 2007. The sixth named storm, second hurricane, first and only major hurricane of the inactive 2007 Pacific hurricane season, Flossie originated from a tropical wave that emerged off Africa on July 21. After traversing the tropical Atlantic, the wave crossed Central America and entered the eastern Pacific on August 1. There, a favorable environment allowed it to become a tropical depression and a tropical storm shortly thereafter on August 8.

<span class="mw-page-title-main">Climate of North Carolina</span>

North Carolina's climate is varying, from the Atlantic coast in the east to the Appalachian Mountain range in the west. The mountains often act as a "shield", blocking low temperatures and storms from the Midwest from entering the Piedmont and Coastal Plain of North Carolina.

References

  1. Federal Emergency Management Agency. Are You Ready? Archived 2006-06-29 at the Wayback Machine Retrieved on 2006-04-05.
  2. "Tropical Cyclone Guidance". Archived from the original on 2017-09-10. Retrieved 2017-09-10.
  3. "US forecast models have been pretty terrible during Hurricane Irma". 8 September 2017. Archived from the original on 10 September 2017. Retrieved 10 September 2017.
  4. Ivan Ray Tannehill. Hurricanes. Princeton University Press: Princeton, 1942. Pages 70-76.
  5. 1 2 Corene J. Matyas. Relating Tropical Cyclone Rainfall Patterns to Storm Size. Archived 2006-10-25 at the Wayback Machine Retrieved on 2007-02-14.
  6. Herbert Riehl. Tropical Meteorology. McGraw-Hill Book Company, Inc.: New York, 1954. Pages 293-297.
  7. Russell Pfost. Tropical Cyclone Quantitative Precipitation Forecasting. Archived 2006-12-31 at the Wayback Machine Retrieved on 2007-02-25.
  8. Roth, David M (May 12, 2022). "Maximum Rainfall caused by North Atlantic and Northeast Pacific Tropical Cyclones and their remnants Per State (1950–2020)". Tropical Cyclone Rainfall. United States Weather Prediction Center. Retrieved January 6, 2023.PD-icon.svg This article incorporates text from this source, which is in the public domain.
  9. Shuyi S. Chen, John A. Knaff, and Frank D. Marks, Jr. Effects of Vertical Wind Shear and Storm Motion on Tropical Cyclone Rainfall Asymmetries Deduced from TRMM. Archived 2007-11-29 at the Wayback Machine Retrieved on 2007-03-28.
  10. Norman W. Junker. Original Maddox et al. MCS archetypes associated with flash flooding. Archived 2015-10-29 at the Wayback Machine Retrieved on 2007-06-24.
  11. Norman W. Junker. Hurricanes and extreme rainfall. Archived 2013-05-30 at the Wayback Machine Retrieved on 2006-02-13.
  12. Yuh-Lang Lin, S. Chiao, J. A. Thurman, D. B. Ensley, and J. J. Charney. Some Common Ingredients for heavy Orographic Rainfall and their Potential Application for Prediction. Archived 2007-10-07 at the Wayback Machine Retrieved on 2007-04-26.
  13. John L. Guiney and Miles B. Lawrence. Hurricane Mitch. Archived 2014-02-16 at the Wayback Machine Retrieved on 2007-04-26.
  14. Frank Marks. GPM and Tropical Cyclones. Archived 2006-10-06 at the Wayback Machine Retrieved on 2007-03-15.
  15. Elizabeth Ebert, Sheldon Kusselson, and Michael Turk. Validation of Tropical Rainfall Potential (TRaP) Forecasts for Australian Tropical Cyclones. Retrieved on 2007-03-28.
  16. Stanley Q. Kidder, Sheldon J. Kusselson, John A. Knaff, and Robert J. Kuligowski. Improvements to the Experimental Tropical Rainfall Potential (TRaP) Technique. Archived 2007-08-17 at the Wayback Machine Retrieved on 2007-03-15.
  17. Timothy P. Marchok, Robert F. Rogers, and Robert E. Tuleya. Improving the Validation and Prediction of Tropical Cyclone Rainfall. Archived 2006-10-10 at the Wayback Machine Retrieved on 2007-03-15.
  18. Robert E. Tuleya, Mark DeMaria, and Robert J. Kuligowski. Evaluation of GFDL and Simple Statistical Model Rainfall Forecasts for U. S. Landfalling Tropical Storms. Archived 2007-08-24 at the Wayback Machine
  19. WRF Program Coordinator. Monthly Report of the WRF Program Coordinator. Archived 2007-10-11 at the Wayback Machine Retrieved on 2007-04-10.
  20. 1 2 David M. Roth Tropical Cyclone Rainfall (July 2007 presentation). Retrieved on 2009-05-07.
  21. Frank Marks. WSR-88D Derived Rainfall Distributions in Hurricane Danny (1997). Archived 2011-06-09 at the Wayback Machine Retrieved on 2007-04-13.
  22. Norman W. Junker. Hurricanes and Extreme Rainfall. Retrieved on 2007-03-15.