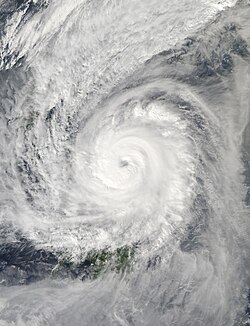
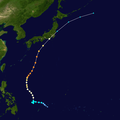
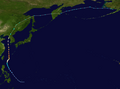
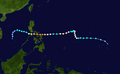
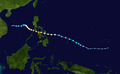
A very strong typhoon is the second highest category used by the Japan Meteorological Agency (JMA) to classify tropical cyclones that has reached typhoon intensity in the Northwest Pacific basin. The basin is limited to the north of the equator between the 100th meridian east and the 180th meridian. The category of a very strong typhoon is defined as a tropical cyclone that has 10-minute sustained wind speeds between 85 and 104 knots (157–193 km/h; 97–121 mph) or greater.
The Northwest Pacific basin covers a vast area in the Pacific Ocean, located north of the equator, between 100°E and 180°E.[1] Several weather agencies monitor this basin, however it is officially monitored by the Japan Meteorological Agency (JMA, RSMC Tokyo), who is responsible for forecasting, naming and issuing warnings for tropical cyclones.[1] Unofficially, the Joint Typhoon Warning Center also monitors the basin, however these warnings measures 1-minute sustained wind speeds, comparing their scale to the Saffir–Simpson scale.[2] The JMA uses a simpler scale on classifying tropical cyclones adapted by the ESCAP/WMO Typhoon Committee measuring 10-minute sustained wind speeds, ranging from a tropical depression, tropical storm, severe tropical storm and typhoon.[3] Furthermore, the JMA divides the typhoon category into three sub-categories for domestic purposes – a strong typhoon, very strong typhoon and violent typhoon.[3]
This article covers a list of systems developing in the Northwest Pacific basin that were classified by the JMA's category of a violent typhoon. The category of a violent typhoon ranges with 10-minute sustained winds of 105 kn (54m/s; 121mph; 194km/h) or greater.[3]
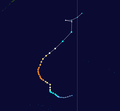
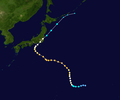
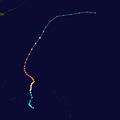
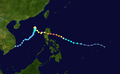
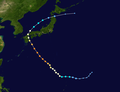
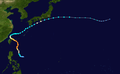
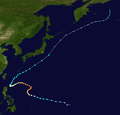
Systems
Key
† Discontinuous duration (weakened below a "Very strong" typhoon then restrengthened to that classification at least once)
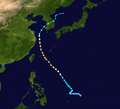
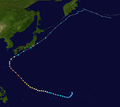
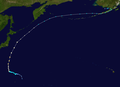
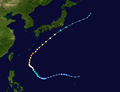
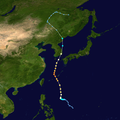
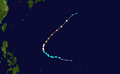
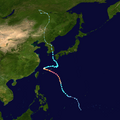
Compared to the previous decade, only 46 typhoons reached the very strong category as its peak strength from 2010 to 2019. Some notable very strong typhoons include Typhoon Bopha in December 2012 which ravaged the Philippines, killing 1,901 people. Typhoon Faxai of 2019 impacted Japan, costing damages of an estimated US$10 billion, making it the sixth costliest typhoon on record.[4] The longest duration of a storm to hold in a category of a very strong typhoon this decade was Typhoon Goni of 2015, a year where 12 very strong typhoons developed.
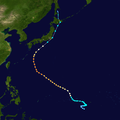
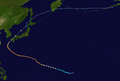
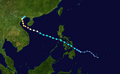
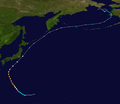
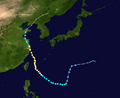
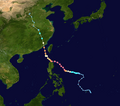
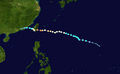
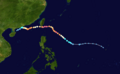
As of the 2024 season, only 21 typhoons have had a peak classification of very strong typhoon. Some notable very strong typhons for this decade are Typhoon Vamco of 2020, which worsened the floods in Vietnam and the Philippines. Typhoon Noru of 2022 which ravaged the Philippines, causing widespread agricultural damages. The costliest very strong typhoon so far is Doksuri of 2023, which caused $28.4 billion of damages. The deadliest tropical cyclone so far for this decade is Gaemi of 2024, which killed 152 people. While the longest duration of a storm to hold in a category of a very strong typhoon this decade was Khanun of 2023.
This page is based on this Wikipedia article Text is available under the CC BY-SA 4.0 license; additional terms may apply. Images, videos and audio are available under their respective licenses.