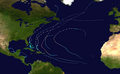
The 2014 Atlantic hurricane season was a well below-average hurricane season that is currently the most recent to have fewer than 10 tropical depressions or named storms, despite the number of hurricanes and major hurricanes[nb 1] being overall average. It produced nine tropical cyclones, eight of which became named storms; six storms became hurricanes and two intensified further into major hurricanes.[2] The season officially began on June 1, and ended on November 30. These dates historically describe the period each year when most tropical cyclones form in the Atlantic basin. The first storm of the season, Arthur, developed on July 1, while the final storm, Hanna, dissipated on October 28, about a month prior to the end of the season.
Most major forecasting agencies predicted that below-average activity would occur in this season due to unfavorable conditions linked with the expected development of a strong El Niño. While the predicted El Niño did not develop until October 2014, unfavorable conditions still were established across the basin, suppressing activity. Although every named storm impacted land, overall effects were minimal. Arthur caused one indirect fatality and $16.8million (2014 USD)[nb 2] in damage after striking North Carolina and becoming the first Category 2 hurricane to make landfall in the United States since 2008'sHurricane Ike, and its remnants moving across Atlantic Canada. Hurricane Bertha brushed the Lesser Antilles but its impacts were relatively minor. Three deaths occurred offshore the United States and one fatal injury was reported off the coast of the United Kingdom. Hurricane Cristobal caused two deaths each in Haiti and the Dominican Republic and one in Turks and Caicos Islands, all due to flooding. Rip currents affected Maryland and New Jersey, resulting in one fatality in each state. The remnants of Cristobal were responsible for three indirect deaths in the United Kingdom. Tropical Storm Dolly made landfall in eastern Mexico and triggered flooding due to heavy rains, leaving minor impact. Hurricane Edouard caused two deaths near the coast of Maryland due to strong rip currents.
Fay struck Bermuda and caused about $3.8million in damage. Hurricane Gonzalo was the most intense hurricane of the season. A powerful Atlantic hurricane, Gonzalo had destructive impacts in the Lesser Antilles and Bermuda, and it was also the first Category 4 hurricane since Ophelia in 2011 and the strongest in the basin since Igor in 2010. It caused three fatalities in the Lesser Antilles and at least $200million in damage in Bermuda. The remnants brought flooding and strong winds in Europe, causing three deaths in the United Kingdom. With two hurricanes striking Bermuda, this was the first season featuring more than one hurricane landfall on the island. The last storm of the season, Tropical Storm Hanna, made landfall over Central America in late October producing minimal impact.
Seasonal forecasts
Predictions of tropical activity in the 2014 season
* June–November only † Most recent of several such occurrences. (See all)
In advance of, and during, each hurricane season, several forecasts of hurricane activity are issued by national meteorological services, scientific agencies, and noted hurricane experts. These include forecasters from the United States National Oceanic and Atmospheric Administration (NOAA)'s National Hurricane and Climate Prediction Center, Tropical Storm Risk, the United Kingdom's Met Office, and Philip J. Klotzbach, William M. Gray and their associates at Colorado State University (CSU). The forecasts include weekly and monthly changes in significant factors that help determine the number of tropical storms, hurricanes, and major hurricanes within a particular year. According to NOAA and CSU, the average Atlantic hurricane season between 1981 and 2010contained roughly 12tropical storms, six hurricanes, three major hurricanes, and an accumulated cyclone energy (ACE) index of 66–103 units.[3][5] Broadly speaking, ACE is a measure of the power of a tropical or subtropical storm multiplied by the length of time it existed. Therefore, a storm with a longer duration or stronger intensity, such as Gonzalo, will have high values of ACE. It is only calculated for full advisories on specific tropical and subtropical systems reaching or exceeding wind speeds of 39mph (63km/h). Accordingly, tropical depressions are not included here. After the storm has dissipated, typically after the end of the season, the NHC reexamines the data, and produces a final report on each storm. These revisions can lead to a revised ACE total either upward or downward compared to the operational value.[16] NOAA typically categorizes a season as either above-average, average, or below-average based on the cumulative ACE Index, but the number of tropical storms, hurricanes, and major hurricanes within a hurricane season are considered occasionally as well.[3]
Pre-season forecasts
On December 13, 2013, Tropical Storm Risk (TSR), a public consortium consisting of experts on insurance, risk management, and seasonal climate forecasting at University College London, issued their first outlook on seasonal hurricane activity during the 2014 season. Their report called for a near-normal year, with 14 (±4) tropical storms, 6 (±3) hurricanes, 3 (±2) intense hurricanes, and a cumulative ACE index of 106 (±58) units. The basis for such included slightly stronger than normal trade winds and slightly warmer than normal sea surface temperatures across the Caribbean Sea and tropical North Atlantic.[5] A few months later, on March 24, 2014, Weather Services International (WSI), a subsidiary company of The Weather Channel, released their first outlook, calling for 11 named storms, 5 hurricanes, and 2 major hurricanes. Two factors—cooler-than-average waters in the eastern Atlantic, and the likelihood of an El Niño developing during the summer of 2014—were expected to negate high seasonal activity.[6]
On April7, TSR issued their second extended-range forecast for the season, lowering the predicted numbers to 12 (±4) named storms, 5 (±3) hurricanes, 2 (±2) major hurricanes, and an ACE index of 75 (±57) units.[7] Three days later, CSU issued their first outlook for the year, predicting activity below the 1981–2010 average. Citing a likely El Niño of at least moderate intensity and cooler-than-average tropical Atlantic sea surface temperatures, the organization predicted nine named storms, three hurricanes, one major hurricane, and an ACE index of 55 units. The probability of a major hurricane making landfall on the United States or tracking through the Caribbean Sea was expected to be lower than average.[8]
On May16, the United Kingdom Met Office (UKMO) issued a forecast of a slightly below-average season. It predicted 10 named storms with a 70% chance that the number would be between 7 and 13 and 6 hurricanes with a 70% chance that the number would be between 3 and 9. It also predicted an ACE index of 84 with a 70% chance that the index would be in the range 47 to 121.[10] NOAA released their pre-season forecasts on May22 and called for a 70% chance that there would be between 8 and 13 named storms, 3 to 6 hurricanes, and 1 to 2 major hurricanes.[11] On May 29, the Florida State University Center for Ocean-Atmospheric Prediction Studies, FSU COAPS, issued its first and only prediction for the season. The organization called for five to nine named storms, of which two to six would further intensify into hurricanes; one to two of the hurricanes would reach major hurricane intensity. In addition, an ACE index of 60units was forecast.[12]
Mid-season predictions
In July and August, CSU, TSR, and NOAA released similar outlooks for the remainder of the season. CSU increased its prediction on July31 to ten named storms, four hurricanes, and one major hurricane, which was unchanged from its forecast on May23. The forecast team noted that conditions for tropical cyclogenesis appeared "detrimental", with abnormally cold sea surface temperatures, higher than average sea-level pressures, and strong vertical wind shear.[13] TSR issued another forecast on July5, indicated that there would be nine to fifteen named storms, four to eight hurricanes, and one to three major hurricanes, citing conditions similar to those forecast by CSU.[14] Two days later, NOAA revised its predictions and called for seven to twelve named storms, three to six hurricanes, and zero to two major hurricanes. NOAA noted similar atmospheric and oceanic conditions, but also indicated a weaker African monsoon, a stable atmosphere, and sinking air.[15]
The Atlantic hurricane season officially began on June 1, 2014.[12] It was a below average season in which nine tropical cyclones formed. Eight of the nine designated cyclones attained tropical storm status, the fewest since the 1997 Atlantic hurricane season.[17] Of the eight tropical storms, six reached at least Category1 hurricane intensity. The 2014 season extended the period without major hurricane landfalls in the United States to nine years, with the last such system being Hurricane Wilma in 2005. The lack of activity was attributed to an atmospheric circulation that favored dry, sinking air over the Atlantic Ocean and strong wind shear over the Caribbean Sea. Additionally, sea surface temperatures were near-average.[18] A few notable events occurred during the season. Arthur made landfall between Cape Lookout and Cape Hatteras as a Category2 hurricane, becoming the first U.S. landfalling cyclone of that intensity since Hurricane Ike in 2008.[19] Arthur also became the earliest known hurricane to strike the North Carolina coastline on record, doing so on July4.[20] In October, Fay became the first hurricane to make landfall on Bermuda since Emily in 1987.[21] With Gonzalo striking the island only four days later, 2014 became the first season on record in which more than one hurricane struck Bermuda.[22] Four hurricanes and two tropical storms made landfall during the season and caused 21deaths and at least $233million in damage. Hurricane Cristobal also caused fatalities, though it did not strike land.[23] The Atlantic hurricane season officially ended on November 30, 2014.[12]
Tropical cyclogenesis commenced with the development of Arthur on July1. The system intensified into the first hurricane of the year early on July3. Both events occurred ahead of the respective long-term climatological average date: July9 for first named storm, and August10 for first hurricane.[24] Later that month, a tropical depression developed over the eastern Atlantic, but dissipated after only two days. There were also two tropical cyclones in August, with the development of hurricanes Bertha and Cristobal. Despite being the climatological peak of hurricane season, only two additional systems originated in September – Tropical Storm Dolly and Hurricane Edouard. In October, three storms developed, including hurricanes Fay and Gonzalo and Tropical Storm Hanna.[25] The most intense tropical cyclone – Hurricane Gonzalo – peaked with maximum sustained winds of 145mph (235km/h) on October16 which is a Category4 on the Saffir–Simpson hurricane wind scale. It was the first Category4 hurricane since Hurricane Ophelia in 2011.[26] The final tropical cyclone of the season was Hanna, which dissipated on October28.[25]
The season's activity was reflected with an Accumulated Cyclone Energy (ACE) rating of 66.7.[27] This was nearly double that of the previous season, but still well below the 1981–2010 median of 92.[8] The ACE value in October was higher than August and September combined, which has not occurred since 1963.[18]
On June25, a low-pressure area formed within a mesoscale convective complex over the northwestern Gulf of Mexico. After crossing Georgia and South Carolina, it became absorbed by a weak frontal boundary that drifted south-southeastward. An area of low pressure developed off the Southeast United States by June28, eventually leading to the formation of a tropical depression by 00:00UTC on July1. Amid a generally favorable environment, the depression intensified into Tropical Storm Arthur at 12:00UTC that same day and further to a Category1 hurricane by 00:00UTC on July3. An approaching mid-level trough directed the storm north-northeastward as it continued to intensify, and Arthur reached its peak as a Category2 hurricane with winds of 100mph (160km/h) at 00:00UTC on July4. A few hours later, it moved ashore just west of Cape Lookout, North Carolina, becoming the earliest landfalling hurricane on record in the state. Following landfall, Arthur accelerated northeast across the western Atlantic while encountering an increasingly unfavorable environment, weakening to a tropical storm at 06:00UTC on July5 and transitioning into an extratropical cyclone six hours later. The post-tropical low eventually dissipated east of Labrador late on July9.[28]
As a developing tropical cyclone, Arthur produced light rainfall across the northwestern Bahamas.[29][30] Maximum sustained winds peaked at 77mph (124km/h), with a peak gust of 101mph (163km/h), at Cape Lookout,[31] and Oregon Inlet recorded a peak storm surge of 4.5ft (1.4m).[32] At its height, Arthur knocked out power to 44,000people in North Carolina, triggering Duke Energy to deploy over 500 personnel to restore electricity.[33] Widespread rainfall totals of 6–8in (150–200mm) led to the inundation of numerous buildings in Manteo.[34] As the storm passed offshore New England, sustained winds of 47mph (76km/h) and gusts up to 63mph (101km/h) were observed. Observed rainfall totals over a half foot required the issuance of a flash flood emergency for New Bedford, Massachusetts, while several roads were shut down in surrounding locations.[35] After transitioning into an extratropical cyclone, Arthur knocked out power to more than 290,000 individuals across the Maritimes,[36] with damage to the electrical grid considered the worst since Hurricane Juan in Nova Scotia.[37] One person died after his oxygen support was cut off during a power outage.[38] Hurricane-force gusts were observed in Nova Scotia, with tropical storm-force winds observed as far away as Quebec.[36] Overall, Arthur caused at least $28.6million in damage.[39][40][41][42][43]
A tropical wave emerged off the western coast of Africa on July17. Steered westward, a small area of low pressure developed in association with the wave two days later. Convection steadily increased and organized, leading to the formation of a tropical depression by 12:00UTC on July21. The depression failed to intensify into a tropical storm amid an exceptionally dry and stable environment and instead degenerated into a trough by 18:00UTC on July23 while located east of the Lesser Antilles.[44]
On August1, a tropical wave developed into Tropical Storm Bertha while roughly 345mi (555km) east-southeast of Barbados. A mostly disorganized cyclone, Bertha quickly moved across the Lesser Antilles, clipping the northern end of Martinique, later that day. During its trek across the eastern Caribbean Sea, its circulation became severely disrupted and it may have degenerated into a tropical wave. On August 3, it traversed the Mona Passage and moved over the Southeastern Bahamas where conditions favored development. Despite an overall ragged appearance on satellite imagery, data from hurricane hunters indicated it intensified to a hurricane on August 4; it acquired peak winds of 80mph (130km/h) that day. Turning north, and later northeast, Bertha soon weakened as it began to merge with an approaching trough to the west. This merger ultimately took place on August 6, at which time Bertha was declared extratropical well to the south of Nova Scotia.[45]
As a tropical cyclone, Bertha's impact was relatively minor. In the Lesser Antilles, widespread power outages occurred along its path but no major damage or loss of life took place. Enhanced swells and rip currents associated with the hurricane resulted in three fatalities and dozens of rescues along the East Coast of the United States.[45][46][47] After becoming an extratropical system, it had significant effects in Western Europe, with the United Kingdom being particularly hard hit. Unseasonably heavy rains triggered widespread flooding which shut down roads and prompted evacuations.[48] One fatality took place offshore after a man suffered a fatal head injury on his yacht amid rough seas.[49] On mainland Europe, a small tornado outbreak resulted in scattered structural damage in Belgium, France, and Germany.[50]
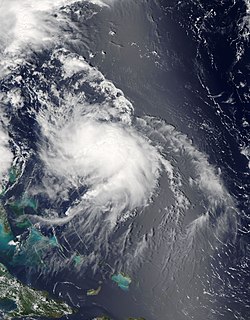
A tropical wave and attendant region of convection developed into a tropical depression at 18:00UTC on August23 while located near Mayaguana in the Bahamas; twelve hours later, the depression intensified into Tropical Storm Cristobal. The newly formed cyclone turned northward following formation, directed toward a break in a subtropical ridge. Although located in an unfavorable environment, Cristobal steadily intensified and was upgraded to a Category1 hurricane at 00:00UTC on August26 despite a partially exposed circulation and disorganized cloud pattern. As the hurricane turned east-northeastward the following day, its cloud pattern became much more symmetric and an eye became evident, yielding peak winds of 85mph (135km/h). Thereafter, a frontal boundary wrapped around the storm's circulation, transitioning the system into an extratropical cyclone by 12:00UTC on August29. The post-tropical low maintained hurricane-force winds while accelerating across the North Atlantic, finally merging with a second extratropical low north of Iceland by September2.[51]
The precursor of Cristobal and the storm itself dropped heavy precipitation on Puerto Rico, with 13.21 in (336mm) of rain observed in the municipality of Tibes, bring drought relief to the island.[52] The storm downed many trees and power lines and left more than 23,500 people without power and 8,720without water.[53] In Dominican Republic, large amounts of rainfall left several communities isolated, flooded at least 800homes,[54] and killed two people.[51] Thousands of people were evacuated from their homes.[54] In Haiti, mudslides and flooding rendered 640families homeless and destroyed or severely damaged at least 34homes. Two people who went missing were later presumed to have drowned.[55] In the Turks and Caicos Islands, the storm produced over 10in (250mm) of precipitation on various islands. The international airport on Providenciales briefly closed due to flooding, where one drowning death occurred.[51] Portions of North Caicos were inundated with up to 5ft (1.5 m) of water.[56] Along the East Coast of the United States, rip currents resulted in two deaths, one each in Maryland and New Jersey.[57][58]
An area of low pressure interacted with an atmospheric Kelvin wave, leading to the formation of a tropical depression in the Bay of Campeche at 18:00UTC on August31. Six hours later, the depression was upgraded to Tropical Storm Dolly. Steered generally westward by a mid-level ridge to its north, the cyclone struggled with strong wind shear and reached peak winds of 50mph (80km/h) at 12:00UTC on September2. At 04:00UTC the next day, Dolly moved ashore just south of Tampico, Mexico, with winds of 45mph (70km/h). Following landfall, the mountainous terrain of eastern Mexico quickly caused the cyclone to degenerate into a remnant low at 12:00UTC on September3. The post-tropical low continued westward prior to dissipating the next day.[59]
Heavy rains from the storm triggered flooding that temporarily isolated three communities in Tampico. One fatality was attributed to the storm. The hardest hit area was Cabo Rojo where 210homes were affected, 80of which sustained damage.[60] Total losses to the road network in Tamaulipas reached 80million pesos (US$6million),[61] while structural damage amounted to 7million pesos (US$500,000).[62] In Texas, more than 2in (51mm) of rain fell in Brownsville, causing street flooding.[63] Two Mexican fishing vessels ran aground in the Port of Brownsville and a third on South Padre Island. The United States Coast Guard attributed the mishaps to the sudden influx of numerous ships.[64]
A tropical wave accompanied by a broad area of low pressure exited the western coast of Africa on September6, acquiring sufficient organization to be declared a tropical depression by 12:00UTC on September11. Twelve hours later, the depression intensified into Tropical Storm Edouard. The newly formed cyclone moved northwest, steered around a subtropical ridge to its northeast. The storm intensified in a generally favorable environment and became a hurricane by 12:00UTC on September14. With a well-defined eye surrounded by intense eyewall convection, Edouard further strengthened into a major hurricane early on September16, attaining peak winds of 120mph (195km/h) at 12:00UTC, the first major hurricane in the Atlantic since Hurricane Sandy in 2012. The cyclone abruptly weakened thereafter as it curved northeastward in advance of an upper-level trough, falling below hurricane intensity by 00:00UTC on September19 and degenerating into a remnant low eighteen hours later. The remnant low moved generally southward, merging with a frontal boundary well south-southwest of the Azores on September21.[65]
Though Edouard remained well away from land throughout its existence, large swells and dangerous rip currents affected much of the East Coast of the United States. Rip current warnings were issued on September17 for Duval, Flagler, Nassau, and St. Johns counties in Florida and Camden and Glynn counties in Georgia.[66] Waves in the area were forecast to reach 3 to 4ft (0.91 to 1.22m).[67] On September17, two men drowned off the coast of Ocean City, Maryland, due to strong rip currents.[68] The Bermuda Weather Service noted the hurricane as a "potential threat"; however, Edouard remained several hundred miles away from the islands.[69]
On September16, several uncrewed drones designed by NOAA were launched by Hurricane Hunter aircraft while investigating Edouard. This marked the first time that drones were used in such a manner by NOAA. Unlike the crewed aircraft, the drones were able to fly to the lower-levels of hurricanes and investigate the more dangerous areas near the surface.[70] Additionally, a NASA-operated Global Hawk flew into the storm, equipped with two experimental instruments: the Scanning High-resolution Interferometer Sounder (S-HIS) and Cloud Physics Lidar (CPL). The S-HIS provided measurements of temperature and relative humidity while the CPL was for studying aerosols and the structure of cloud layers within hurricanes.[71]
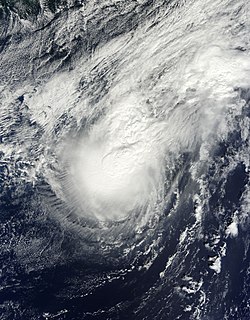
A low-level disturbance was designated as Subtropical Storm Fay at 06:00UTC on October10 while located about 615mi (990km) south of Bermuda. Directed north-northwestward around a mid-level ridge across the central Atlantic, the system became dislocated from a cold-core low, allowing for a subsequent transition into a fully tropical storm by early on October11. Fay continued to strengthen in spite of excessively strong wind shear as it accelerated north-northeast, becoming a hurricane as it approached Bermuda the next morning. With an asymmetric cloud pattern, the hurricane reached peak winds of 80mph (130km/h) and made landfall on the island at 08:10UTC on October12. An approaching shortwave further turned the system to the east-northeast while also acting to increase wind shear, causing Fay to begin weakening. It fell below hurricane intensity on October12 and degenerated into an open trough by 06:00UTC on October13.[21]
A few tropical cyclone warnings and watches were issued in anticipation of Fay's impact on Bermuda.[21] Public schools were closed in advance of the storm.[72] Despite its modest strength, Fay produced relatively extensive damage on Bermuda. Winds gusting over 80mph (130km/h) clogged roadways with downed trees and power poles, and left a majority of the island's electricity customers without power. The terminal building at L.F. Wade International Airport was severely flooded after the storm compromised its roof and sprinkler system.[21] Immediately after the storm, 200Bermuda Regiment soldiers were called to clear debris and assist in initial damage repairs.[73] Cleanup efforts overlapped with preparations for the approach of the stronger Hurricane Gonzalo. There were concerns that debris from Fay could become airborne during Gonzalo and exacerbate future destruction.[74] Overall, it is estimated that the hurricane left at least $3.8million in damage.[21]
A tropical depression formed about 390mi (630km) east of the Leeward Islands by 00:00UTC on October12 from a tropical wave that emerged off Africa on October4. Twelve hours later, it intensified into Tropical Storm Gonzalo. Steered west and eventually west-northwest, the cyclone rapidly intensified amid favorable atmospheric dynamics, becoming a minimal hurricane by 12:00UTC on October13. After curving northwest and emerging into the southwestern Atlantic, Gonzalo continued its period of rapid intensification, becoming a major hurricane by 18:00UTC on October14 and a Category4 hurricane six hours later. The hurricane underwent an eyewall replacement cycle the next day, but ultimately attained peak winds of 145mph (235km/h) and a minimum barometric pressure of 940mbar (28inHg) by 12:00UTC on October16. Late that afternoon, the effects of a second eyewall replacement cycle, cooler waters, and increased shear caused the storm to begin a steady weakening trend as it accelerated north-northeast ahead of an approaching trough. Gonzalo weakened below major hurricane intensity by 00:00UTC on October18 and made landfall in Bermuda with winds of 110mph (175km/h) six hours later. The cyclone continued north-northeast, transitioning into an extratropical cyclone by 18:00UTC on October19 while located roughly 460mi (740km) northeast of Cape Race, Newfoundland. The extratropical cyclone turned east-northeast and was absorbed by a cold front early on October20.[22]
Widespread impact was observed across the northeastern Caribbean Sea as Gonzalo moved through the region. Sustained winds of 67mph (108km/h), with gusts to 88mph (142km/h), were observed on Antigua,[75] where downed trees blocked roads and damaged houses. Numerous fishing boats were destroyed and the island was subject to a widespread power outage.[76] On Saint Martin, 37 docked boats were destroyed and the airport recorded sustained winds of 55mph (90km/h) with gusts to 94mph (151km/h).[77][78] As Gonzalo made landfall on Bermuda, L.F. Wade International Airport recorded sustained winds of 93mph (150km/h) and gusts up to 113mph (182km/h); an elevated observing station at St. Davids reported a peak gust of 144mph (232km/h).[79] At the height of the storm about 86% of electricity customers on the island lost power.[80] Multiple buildings suffered roof damage, and downed trees and power lines prevented travel across the island.[81] On Bermuda alone, the storm left at least $200million in damage.[22] After transitioning into an extratropical cyclone, Gonzalo delivered strong winds to Newfoundland, with gusts peaking at 66mph (106km/h) at Cape Pine.[82] Approximately 100households lost power, while heavy rain caused localized urban flooding in St. Johns.[83]
Extratropical Gonzalo was absorbed by a cold front several hundred nautical miles south-southwest of Iceland on October 20.[22] The storm complex incorporating Gonzalo's remnants generated heavy rain and wind gusts between 50–70mph (80–113km/h) in Ireland and the United Kingdom; trees were downed, transportation was disrupted, and one fatality was reported. The storm also produced widespread heavy snow across Germany, France, Switzerland, and Austria.[84] The system later contributed to torrential rains over the Balkans, which resulted in severe flooding in Greece and Bulgaria.[85][86]
On October19, the remnants of Tropical Storm Trudy emerged over the Bay of Campeche, after losing its low-level circulation over the mountainous terrain of Mexico. Moving slowly eastward, the system redeveloped a new surface circulation on October21, becoming a tropical depression on the next day about 175mi (280km) west of Campeche, Mexico. A reconnaissance aircraft flight measured a central pressure of 1000 mbar (hPa; 29.53inHg) upon its formation, the lowest in relation to the depression. Increasing wind shear and dry air intrusion soon caused the depression to degrade into a remnant low early on October23 before moving inland over the southwestern Yucatán Peninsula. After crossing the southern Yucatán and northern Belize, the low emerged over the northwestern Caribbean Sea on October24. Hostile conditions from a nearby frontal boundary ultimately caused the system to degrade into a trough and become entangled within the front.[87]
Subsequent weakening of the frontal system on October26 allowed the depression's remnants to become better defined as they moved southeast and later southward. The system regained a closed circulation by 12:00UTC that day as it began turning west. Following the development of deep convection the system regenerated into a tropical depression around 00:00UTC on October27 roughly 80mi (130km) east of the Nicaragua–Honduras border. ASCAT scatterometer data shortly thereafter resulted in the depression being upgraded to Tropical Storm Hanna at 06:00UTC. Just ten hours later Hanna made landfall over extreme northeastern Nicaragua and quickly weakened back to a depression. The system degraded to a remnant low early on October28 before turning northwestward and emerging over the Gulf of Honduras. Some signs of redevelopment appeared throughout the day, but the remnants of Hanna soon moved inland over Belize early on October29. The system finally dissipated over northwest Guatemala on the following day.[87] Hanna and its remnants contributed to an ongoing flood in Nicaragua that was responsible for 28fatalities, many cattle deaths, and a significant loss of grain.[88]
The following list of names was used for named storms that formed in the North Atlantic in 2014.[89] This was the same list used in the 2008 season, with the exceptions of Gonzalo, Isaias, and Paulette, which replaced Gustav, Ike, and Paloma, respectively.[90] The name Gonzalo was the only name used for the first time this year. There were no names retired following the 2014 season, so the same list was used again for the 2020 season.[91]
This is a table of all of the storms that formed in the 2014 Atlantic hurricane season. It includes their name, duration, peak classification and intensities, areas affected, damage, and death totals. Deaths in parentheses are additional and indirect (an example of an indirect death would be a traffic accident), but were still related to that storm. Damage and deaths include totals while the storm was extratropical, a wave, or a low, and all of the damage figures are in 2014 USD.
↑ All damage figures are in 2014 USD, unless otherwise noted
References
↑ Saffir–Simpson Hurricane Wind Scale. National Hurricane Center (Report). Miami, Florida: National Oceanic and Atmospheric Administration. May 23, 2013. Retrieved April 18, 2014.
↑ Atlantic basin Comparison of Original and Revised HURDAT. Hurricane Research Division; Atlantic Oceanographic and Meteorological Laboratory (Report). Miami, Florida: National Oceanic and Atmospheric Administration. Archived from the original on March 29, 2014. Retrieved July 22, 2015.
National Weather Service Office in Tallahassee, Florida (2014). Florida Event Report: Thunderstorm Wind. National Climatic Data Center (Report). National Oceanic and Atmospheric Administration. Retrieved December 9, 2014.
National Weather Service Office in Newport/Morehead City, North Carolina (2014). North Carolina Event Report: Tropical Storm. National Climatic Data Center (Report). National Oceanic and Atmospheric Administration. Retrieved December 9, 2014.
Eric S. Blake (December 18, 2014). Tropical Cyclone Report: Hurricane Bertha(PDF) (Report). Miami, Florida: National Hurricane Center. pp.2, 3. Retrieved May 24, 2015.
National Weather Service Office in Jacksonville, Florida (2014). Florida Event Report: Rip Current. National Climatic Data Center (Report). National Oceanic and Atmospheric Administration. Retrieved December 21, 2014.
Todd B. Kimberlain (December 17, 2014). Tropical Cyclone Report: Hurricane Fay(PDF) (Report). Miami, Florida: National Hurricane Center. Retrieved May 24, 2015.
Daniel P. Brown (January 20, 2015). Tropical Cyclone Report: Hurricane Gonzalo(PDF) (Report). Miami, Florida: National Hurricane Center. pp.2, 3. Retrieved January 21, 2015.
↑ Jack L. Beven; Eric S. Blake (July 3, 2014). "Hurricane Arthur Tropical Cyclone Update". National Hurricane Center. Miami, Florida: National Oceanic and Atmospheric Administration. Retrieved August 25, 2014.
↑ National Weather Service Office in Tallahassee, Florida (2014). Florida Event Report: Thunderstorm Wind. National Climatic Data Center (Report). National Oceanic and Atmospheric Administration. Retrieved December 9, 2014.
↑ National Weather Service Office in Newport/Morehead City, North Carolina (2014). North Carolina Event Report: Tropical Storm. National Climatic Data Center (Report). National Oceanic and Atmospheric Administration. Retrieved December 9, 2014.
↑ Lixion A. Avila (September 24, 2014). Tropical Cyclone Report: Tropical Depression Two(PDF). National Hurricane Center (Report). Miami, Florida: National Oceanic and Atmospheric Administration. Retrieved January 14, 2015.
↑ National Weather Service Office in Jacksonville, Florida (2014). "Florida Event Report: Rip Current". National Climatic Data Center. National Oceanic and Atmospheric Administration. Retrieved December 21, 2014.
↑ Hainey, Raymond; Bell, Jonathan; Jones, Simon (October 13, 2014). "Island counts cost of Fay's fury". The Royal Gazette. Archived from the original on October 15, 2014. Retrieved October 16, 2014.
↑ Stacy R. Stewart (October 13, 2014). "Tropical Storm Gonzalo Discussion Number 5". National Hurricane Center. Miami, Florida: National Oceanic and Atmospheric Administration. Retrieved January 21, 2015.
↑ Stacy R. Stewart (October 18, 2014). "Hurricane Gonzalo Tropical Cyclone Update". National Hurricane Center. Miami, Florida: National Oceanic and Atmospheric Administration. Retrieved January 21, 2015.
1 2 John P. Cangialosi (December 16, 2014). Tropical Cyclone Report: Tropical Storm Hanna(PDF). National Hurricane Center (Report). Miami, Florida: National Oceanic and Atmospheric Administration. Retrieved December 17, 2014.
This page is based on this Wikipedia article Text is available under the CC BY-SA 4.0 license; additional terms may apply. Images, videos and audio are available under their respective licenses.