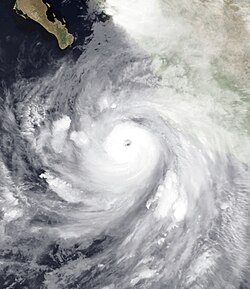
A train of four storms in the Northern Pacific on August 6; shown from left to right are Typhoon Halong, Hurricane Genevieve, Hurricane Iselle, and Hurricane JulioSatellite photos of 25 tropical cyclones worldwide that reached at least Category3 on the Saffir–Simpson scale during 2014, from Narelle in January to Kate in December.
The strongest of these tropical cyclones was Typhoon Vongfong, which strengthened to a minimum barometric pressure of 900 mbar (hPa; 26.58inHg) before striking the east coast of Japan. The costliest and deadliest tropical cyclone in 2014 was Typhoon Rammasun, which struck China in July, causing US$8.08billion in damage. Rammasun killed 222 people; 106 in Philippines, 88 in China and 28 in Vietnam.
During January 2014, after surveying various climate models, the World Meteorological Organization warned that there was an enhanced possibility of a weak El Niño event happening during 2014.[1] Over the next few months the climate of the Pacific Ocean started to exhibit features that suggested the impending onset of an El Niño event.[2] Over the ocean, these features included: a rapid fall of the sea level in western Micronesia, as well as a large area of enhanced sea surface temperatures that were present at low latitudes near the International Date Line.[3] In the atmosphere these features included persistent westerly winds at equatorial latitudes, which were displaced eastwards towards the Marshall Islands.[3] A large area of atmospheric convection was present at a low latitude near the International Date Line, in association with the development of an unusual amount of early season tropical cyclones near the Marshall Islands.[3] As a result of some of these conditions, an El Niño Watch was issued by the United States Climate Prediction Center (NOAA's CPC) and the International Research Institute for Climate and Society within their March 2014 diagnostic discussion.[nb 1][5][6]
Over the next few months, the atmosphere failed to respond in order to reinforce the developing El Niño, with the monsoon trough remaining weak and tropical cyclone activity slowing, while no episodes of strong westerly winds at a low latitude occurred.[2] Some of the oceanic indicators of El Niño also failed to develop further, with a cooling of sea and sub surface temperatures over the tropical Pacific occurring.[2][7] However, by the end of 2014, several of the El Niño indexes that were used to judge the state of the ENSO state, indicated that weak El Niño conditions had developed over the Pacific Ocean.[8] As a result, a few of the international meteorological agencies, including the Japan Meteorological Agency and the Hong Kong Observatory reported that an El Niño event had developed during 2014, while others such as the Fiji Meteorological Service considered 2014 to be a near miss.[7][8][9] At this time it was thought that the ENSO state would continue to hover at the borderline El Niño conditions, before easing back into neutral ENSO conditions.[10]
The Atlantic hurricane season officially began on June 1, 2014.[citation needed] It was a below average season in which nine tropical cyclones formed. Eight of the nine designated cyclones attained tropical storm status, the fewest since the 1997 Atlantic hurricane season.[11] Of the eight tropical storms, six reached at least Category1 hurricane intensity. The 2014 season extended the period without major hurricane landfalls in the United States to nine years, with the last such system being Hurricane Wilma in 2005. The lack of activity was attributed to an atmospheric circulation that favored dry, sinking air over the Atlantic Ocean and strong wind shear over the Caribbean Sea. Additionally, sea surface temperatures were near-average.[12] A few notable events occurred during the season. Arthur made landfall between Cape Lookout and Cape Hatteras as a Category2 hurricane, becoming the first U.S. landfalling cyclone of that intensity since Hurricane Ike in 2008.[13] Arthur also became the earliest known hurricane to strike the North Carolina coastline on record, doing so on July4.[14] In October, Fay became the first hurricane to make landfall on Bermuda since Emily in 1987. With Gonzalo striking the island only four days later, 2014 became the first season on record in which more than one hurricane struck Bermuda.[citation needed] Four hurricanes and two tropical storms made landfall during the season and caused 21deaths and at least $233million in damage. Hurricane Cristobal also caused fatalities, though it did not strike land.[15] The Atlantic hurricane season officially ended on November 30, 2014.[citation needed]
Tropical cyclogenesis began in early July, with the development of Hurricane Arthur on July1, ahead of the long-term climatological average of July9. Early on July3, the system intensified into a hurricane, preceding the climatological average of August10.[16] Later that month, a tropical depression developed over the eastern Atlantic, but dissipated after only two days. There were also two tropical cyclones in August, with the development of hurricanes Bertha and Cristobal. Despite being the climatological peak of hurricane season, only two additional systems originated in September – Tropical Storm Dolly and Hurricane Edouard. In October, three storms developed, including hurricane Fay and Gonzalo and Tropical Storm Hanna.[17] The most intense tropical cyclone – Hurricane Gonzalo – peaked with maximum sustained winds of 145mph (235km/h) on October16 which is a Category4 on the Saffir–Simpson hurricane wind scale. It was the first Category4 hurricane since Hurricane Ophelia in 2011.[18] The final tropical cyclone of the season was Hanna, which dissipated on October28.[17]
The season's activity was reflected with an Accumulated Cyclone Energy (ACE) rating of 67.[citation needed] This was nearly double that of the previous season, but still well below the 1981–2010 median of 92.[citation needed] The ACE value in October was higher than August and September combined, which has not occurred since 1963.[12]
The season's first named storm, Amanda, developed on May23, shortly after the official start to the Pacific hurricane season on May15. On May24, the system intensified into a hurricane, transcending the climatological average date of June26 for the first hurricane. The next day, Amanda attained major hurricane status, over a month sooner than the average date of July19.[19] Owing to Amanda's extreme intensity the ACE value for May was the highest on record in the East Pacific at 18.6units, eclipsing the previous record of 17.9units set in 2001.[20] Hurricane Cristina became the second's major hurricane, the system broke the previous record set by Hurricane Darby in 2010 which reached major status on June 25. However, this record was broken by Hurricane Blanca in 2015 which reached major status on June 3. Through June14, the seasonal ACE reached its highest level since 1971, when reliable records began, for so early in the season. By the end of June, the ACE total remained at 230% of the normal value,[21] before subsiding to near-average levels to end July.[22] By late July, the basin became rejuvenated, with 3 systems forming during the final 10 days of the month. Activity in August ramped up significantly, with four hurricanes developing during the month, two of which became major hurricanes, excluding Iselle and Genevieve, which formed in July, but became a major hurricane during August. By the end of August, ACE values rose to 60% above the 30-year average.[23]
Continued, though less prolific, activity extended through September with four hurricanes developing that month. ACE values remained 45% above-average by the end of the month.[24] Following the rapid intensification of Hurricane Simon to a Category3 hurricane during the afternoon of October4, the 2014season featured the highest number of major hurricanes in the Eastern Pacific basin since the advent of satellite imagery. With eight such storms east of 140°W, the year tied with the record set in the 1992season.[25][26] However, this record was surpassed by the 2015 Pacific hurricane season.
Systems
A total of 114 systems formed globally in 2014 with 71 of them causing significant damage, deaths, and/or setting records for their basin.
The month of January was very active with 18 systems, starting with Ian bringing damages in Fiji and Tonga. Adding on, Lingling was the first disturbance in the West Pacific, affecting Philippines. Colin became the strongest tropical cyclone in the month of January this 2014, but it stayed well from land. 14 more disturbances formed on different basins, 6 are named by their respective meteorological agencies.
In the month of March, 8 systems formed, of which 5 were named. Cyclone Hellen was one of the most powerful tropical cyclones in the Mozambique Channel on record, as well as the most intense of the 2013–14 South-West Indian Ocean cyclone season: however, it made landfall on Madagascar with winds of 110 kilometres per hour (68mph). In the Australian basin, Cyclone Gillian was the second most powerful cyclone of the 2013–14 Australian region cyclone season and the strongest in the basin in the last four years. 17F, Lusi, Mike, and 21F formed in the South Pacific basin while Caloy formed in the West Pacific basin near the Philippines.
In the month of April, 7 systems formed, the second-least active month of this year; however, 5 storms were named. Severe Tropical Cyclone Ita was the strongest tropical cyclone in the Australian region by minimum central pressure since George in 2007, and since Monica in 2006 by wind speed. In the Australian basin, including Ita, 2 more systems formed: Jack and a weak 17U. Ivanoe formed in the South-West Indian Ocean basin, while Peipah (Domeng), a weak tropical depression, and Tapah existed in the West Pacific basin.
May of 2014 was one of the least active months in the history of worldwide tropical cyclogenesis despite an extant El Niño event, with two tropical cyclones forming. One of them was BOB 02, a depression that brought relief to Odisha, which had been suffering from a heat wave that claimed 22lives. Coastal areas previously reporting temperatures near 40°C (104°F) fell below 30°C (86°F) during the system's passage.[42] The other was Amanda, which was the strongest Eastern Pacific tropical cyclone ever recorded in the month of May,[43] and it is also the strongest cyclone of the month with a wind speed of 135 knots (155mph) and a pressure of 932 hectopascals (27.5inHg).
A total of 7 storms formed within the month of November, of which 4 were named. Typhoon Hagupit was the strongest storm of the month and the second-most intense storm of the year, impacting the Philippines a few weeks after Sinlaku affected the Philippines as a tropical depression. Cyclone Qendresa was a rare system that caused damages and 3 deaths in Italy.
↑ The sum of the number of systems and fatalities in each basin will not equal the number shown as the total. This is because when systems move between basins, it creates a discrepancy in the actual number of systems and fatalities.
Notes
↑ An El Niño watch is issued by the Climate Prediction Center when conditions are favourable for the development of an El Niño within the next six months.[4]
1 Only systems that formed either on or after January 1, 2014 are counted in the seasonal totals. 2 Only systems that formed either before or on December 31, 2014 are counted in the seasonal totals. 3 The wind speeds for this tropical cyclone/basin are based on the IMD Scale which uses 3-minute sustained winds. 4 The wind speeds for this tropical cyclone/basin are based on the Saffir Simpson Scale which uses 1-minute sustained winds. 5The wind speeds for this tropical cyclone are based on Météo-France which uses gust winds.
1 2 Climate Services Division (18 August 2015). Fiji Annual Climate Summary 2014(PDF) (Report). Fiji Meteorological Service. Archived(PDF) from the original on 4 March 2016. Retrieved 25 August 2015.
↑ "Pacific ENSO Update: 2nd Quarter 2015"(PDF). 21 (2). United States Pacific El Niño–Southern Oscillation (ENSO) Applications Climate Center. 29 May 2015. Archived(PDF) from the original on 4 March 2016.{{cite journal}}: Cite journal requires |journal= (help)
National Weather Service Office in Tallahassee, Florida (2014). Florida Event Report: Thunderstorm Wind. National Climatic Data Center (Report). National Oceanic and Atmospheric Administration. Retrieved December 9, 2014.
National Weather Service Office in Newport/Morehead City, North Carolina (2014). North Carolina Event Report: Tropical Storm. National Climatic Data Center (Report). National Oceanic and Atmospheric Administration. Retrieved December 9, 2014.
Eric S. Blake (December 18, 2014). Tropical Cyclone Report: Hurricane Bertha(PDF) (Report). Miami, Florida: National Hurricane Center. pp.2, 3. Retrieved May 24, 2015.
National Weather Service Office in Jacksonville, Florida (2014). Florida Event Report: Rip Current. National Climatic Data Center (Report). National Oceanic and Atmospheric Administration. Retrieved December 21, 2014.
Todd B. Kimberlain (December 17, 2014). Tropical Cyclone Report: Hurricane Fay(PDF) (Report). Miami, Florida: National Hurricane Center. Retrieved May 24, 2015.
Daniel P. Brown (January 20, 2015). Tropical Cyclone Report: Hurricane Gonzalo(PDF) (Report). Miami, Florida: National Hurricane Center. pp.2, 3. Retrieved January 21, 2015.
↑ "Tropical Cyclone Climatology". National Hurricane Center. Miami, Florida: National Oceanic and Atmospheric Administration. Retrieved May 23, 2014.
↑ Hurricane Specialists Unit (June 1, 2014). Monthly Tropical Weather Summary(.TXT). National Hurricane Center (Report). Miami, Florida: National Oceanic and Atmospheric Administration. Retrieved March 2, 2015.
↑ Hurricane Specialist Unit (July 1, 2014). Monthly Tropical Weather Summary. National Hurricane Center (Report). Miami, Florida: National Oceanic and Atmospheric Administration. Retrieved August 13, 2014.
↑ Hurricane Specialist Unit (August 1, 2014). Monthly Tropical Weather Summary(.TXT). National Hurricane Center (Report). Miami, Florida: National Oceanic and Atmospheric Administration. Retrieved August 13, 2014.
↑ Hurricane Specialist Unit (September 1, 2014). Monthly Tropical Weather Summary(.TXT). National Hurricane Center (Report). Miami, Florida: National Oceanic and Atmospheric Administration. Retrieved September 2, 2014.
↑ Hurricane Specialists Unit (October 1, 2014). Monthly Tropical Weather Summary(.TXT). National Hurricane Center (Report). Miami, Florida: National Oceanic and Atmospheric Administration. Retrieved October 1, 2014.
↑ Daniel P. Brown (September 14, 2014). Hurricane Odile Discussion Number 17. National Hurricane Center (Report). Miami, Florida: National Oceanic and Atmospheric Administration. Retrieved September 14, 2014.
↑ Jack L. Beven II (October 4, 2014). Hurricane Simon Discussion Number 13. National Hurricane Center (Report). Miami, Florida: National Oceanic and Atmospheric Administration. Retrieved October 4, 2014.
↑ United States National Oceanic and Atmospheric Administration's Climate Prediction Center (January 8, 2014). Africa Hazards Outlook January 9– January 15, 2014 (Report). ReliefWeb. Retrieved 10 January 2014.
↑ Event Details: Rip Current: Guam (Storm Events Database). National Oceanic and Atmospheric Administration's National Climatic Data Center. Archived from the original on November 30, 2014. Retrieved November 30, 2014.
↑ Stacy R. Stewart (June 24, 2014). "Tropical Cyclone Report: Hurricane Amanda"(PDF). National Hurricane Center. National Oceanic and Atmospheric Administration. Retrieved December 26, 2016.
↑ Eric S. Blake (December 18, 2014). Tropical Cyclone Report: Hurricane Bertha(PDF). National Hurricane Center (Report). Miami, Florida: National Oceanic and Atmospheric Administration. p.3. Retrieved December 21, 2014.
↑ National Weather Service Office in Jacksonville, Florida (2014). "Florida Event Report: Rip Current". National Climatic Data Center. National Oceanic and Atmospheric Administration. Retrieved December 21, 2014.
↑ David A. Zelinski and Richard J. Pasch (January 30, 2015). Tropical Cyclone Report: Hurricane Marie(PDF). National Hurricane Center (Report). Miami, Florida: National Oceanic and Atmospheric Administration. p.4. Retrieved February 12, 2015.
↑ John L. Beven II (January 28, 2015). Tropical Cyclone Report: Tropical Storm Dolly(PDF). National Hurricane Center (Report). Miami, Florida: National Oceanic and Atmospheric Administration. Retrieved June 2, 2015.
↑ John Cangialosi and Todd Kimberlain (March 4, 2015). Hurricane Odile Tropical Cyclone Report(PDF). National Oceanic and Atmospheric Administration (Report). National Hurricane Center. p.6. Retrieved June 27, 2015.
↑ Robbie Berg (January 29, 2015). Hurricane Polo Tropical Cyclone Report(PDF). National Oceanic and Atmospheric Administration (Report). National Hurricane Center. p.4. Retrieved February 12, 2021.
↑ 台風被害2人死亡1人不明96人けが. NHKニュース (in Japanese). Japan Broadcasting Corporation. October 14, 2014. Archived from the original on October 15, 2014. Retrieved October 14, 2014.
This page is based on this Wikipedia article Text is available under the CC BY-SA 4.0 license; additional terms may apply. Images, videos and audio are available under their respective licenses.