Tropical cyclones in 2010

Last updated

Tropical cyclones in 2010
Tropical cyclones in 2010.png
Year summary map
Year boundaries
First system Edzani
FormedJanuary 1, 2010
Last system 08U
DissipatedJanuary 2, 2011
Strongest system
Name Megi
Lowest pressure885 mbar (hPa); 26.13 inHg
Longest lasting system
Name Megi
Duration19 days
Year statistics
Total systems113
Named systems67
Total fatalities1,553 total
Total damage$15.34 billion (2010 USD)
Related articles
Other years
2008, 2009, 2010, 2011, 2012
Satellite photos of the 19 tropical cyclones worldwide that reached at least Category 3 on the Saffir-Simpson scale during 2010, from Edzani in January to Chaba in October.
Among them, Megi (center image on the final row) was the most intense, with a minimum central pressure of 885 hPa. Major Tropical Cyclones of 2010.png
Satellite photos of the 19 tropical cyclones worldwide that reached at least Category 3 on the Saffir–Simpson scale during 2010, from Edzani in January to Chaba in October.
Among them, Megi (center image on the final row) was the most intense, with a minimum central pressure of 885 hPa.

2010 was considered as one of the least active years for tropical cyclones on record, with only 64 named systems forming. During the year, tropical cyclones formed within seven different tropical cyclone basins, located within various parts of the Atlantic, Pacific and Indian Oceans. During the year, a total of 111 tropical cyclones developed, with 64 of them being named by either a Regional Specialized Meteorological Center (RSMC) or a Tropical Cyclone Warning Center (TCWC). The most active basin was the North Atlantic, which documented 19 named systems, while the North Indian Ocean, despite only amounting to five named systems, was its basin's most active since 1998. Conversely, both the West Pacific typhoon and East Pacific hurricane seasons experienced the fewest cyclones reaching tropical storm intensity in recorded history, numbering 14 and 8, respectively. Activity across the southern hemisphere's three basins—South-West Indian, Australian, and South Pacific—was spread evenly, with each region recording 7 named storms apiece. The southern hemisphere's strongest tropical cyclone was Cyclone Edzani, which bottomed out with a barometric pressure of 910 mbar (hPa; 26.87 inHg) in the South-West Indian Ocean. Nineteen Category 3 tropical cyclones formed, including four Category 5 tropical cyclones in the year. The accumulated cyclone energy (ACE) index for the 2010 (seven basins combined), as calculated by Colorado State University was 573.8 units.

Contents

The strongest of these tropical cyclones was Typhoon Megi, which strengthened to a minimum barometric pressure of 885 mbar (hPa; 26.13  inHg) before striking the east coast of Luzon in the Philippines. The costliest tropical cyclone in 2010 was Hurricane Karl, which struck the Veracruz, Mexico area in September, causing US$5.6 billion in damage. [nb 1] Hurricane Alex, Tropical Storm Matthew, and Tropical Storm Agatha were the only other tropical cyclones worldwide in 2010 to accrue over US$1 billion in damage. Agatha was also the year's deadliest storm, killing 190 people primarily in Guatemala after lasting for only one day over the waters of the East Pacific.

Global atmospheric and hydrological conditions

The previous El Niño event broke down during the first quarter of 2010. [1] The climate of the Pacific Ocean subsequently returned to neutral conditions by the end of April, while climate models used and developed by various meteorological agencies, subsequently started to show signs that a La Niña event would develop later in 2010. [1] [2] Over the next month the Pacific Ocean started to show various signals that indicated a La Niña event was developing and as a result, a La Niña watch was issued by the United States Climate Prediction Center during their June 2010 ENSO diagnostic discussion. [1] [3] As the ocean's surface temperature cooling progressed, more colder anomalies appeared at the International Date Line rather than over eastern Pacific, what made the event a Modoki La Nina. [4]

Season summary

Tropical Storm OmekaCyclone JalHurricane TomasHurricane SharyHurricane RichardCyclone GiriTyphoon Chaba (2010)Typhoon Megi (2010)Hurricane PaulaHurricane Otto (2010)Tropical Storm Nicole (2010)Tropical Storm Matthew (2010)Tropical Storm Georgette (2010)Typhoon FanapiHurricane KarlHurricane Julia (2010)Hurricane IgorTropical Storm Hermine (2010)Tropical Depression Eleven-E (2010)Typhoon Kompasu (2010)Hurricane Earl (2010)Hurricane Frank (2010)Tropical Depression Five (2010)Tropical Storm Colin (2010)Tropical Storm Bonnie (2010)Typhoon Chanthu (2010)Typhoon Conson (2010)Tropical Depression Two (2010)Hurricane Alex (2010)Hurricane Celia (2010)Cyclone PhetTropical Storm Agatha (2010)Cyclone LailaCyclone TomasCyclone UluiTropical Storm HubertCyclone PatCyclone Olitropical cyclone basinsTropical cyclones in 2010

Systems

January

Cyclone Edzani Edzani 07 jan 2010 0825Z.jpg
Cyclone Edzani

During the month of January, a total of twelve tropical cyclones formed, with only five receiving names by their meteorological agencies of responsibility. The most intense tropical cyclone of the month was Cyclone Edzani, peaking with 910 hPa and 150 mph in 10-minute sustained winds.

Tropical cyclones formed in January 2010
Storm nameDates activeMax wind
km/h (mph)
Pressure
(hPa)
Areas affectedDamage
(USD)
DeathsRefs
Edzani January 1–14220 (140)910NoneNoneNone
03F January 7–1065 (40)1002 French Polynesia, Southern Cook Islands NoneNone [5]
04U January 14–21UnspecifiedUnspecifiedNoneNoneNone
09 January 15–1645 (30)1005 Réunion, Mauritius, Madagascar MinimalNone
Magda January 18–24130 (80)975 Western Australia MinimalNone
01W January 18–2055 (35)1006 Vietnam, Cambodia $243 thousand3 [6] [7] [8]
Neville January 19–2165 (40)995 Queensland NoneNone [9]
Olga January 20–3095 (60)983 Solomon Islands, Queensland, Northern Territory Unknown2 [10] [11]
05F January 23–28Not specified997NoneNoneNone
Subtropical Depression 10 January 25–3165 (40)995NoneNoneNone
Nisha January 27–3175 (45)990 Samoan Islands, Southern Cook Islands NoneNone
Oli January 29 – February 7185 (115)925 Samoan Islands, Cook Islands, French Polynesia $70 million1

February

Cyclone Gelane Tropical Cyclone Gelane 2010-02-19 lrg.jpg
Cyclone Gelane

The month of February was quite inactive, with only seven tropical cyclones forming, with five becoming named storms. Cyclone Gelane was the most intense of the month, peaking at 930 hPa, along with 10-minute sustained winds of 125 mph. No one was killed by a tropical cyclone in the month.

Tropical cyclones formed in February 2010
Storm nameDates activeMax wind
km/h (mph)
Pressure
(hPa)
Areas affectedDamage
(USD)
DeathsRefs
Fami February 1 – 385 (50)994 Madagascar NoneNone
08F February 2 – 455 (35)997 French Polynesia, Cook Islands NoneNone
Pat February 6 – 11140 (85)960 Cook Islands $13.7 millionNone
Rene February 9 – 17155 (100)955 Samoan Islands, Tonga $18 millionNone
08U February 22 – 24Not specifiedNot specified Northern Territory NoneNone
Gelane February 15 – 22205 (125)930 Reunion, Mauritius, Rodrigues, Madagascar NoneNone
Sarah February 17 – March 365 (40)995 Cook Islands UnknownNone

March

Cyclone Ului Ului 2010-03-14 0315Z.jpg
Cyclone Ului

March was somewhat active with eight tropical cyclones forming with seven receiving names. Cyclone Ului was the most intense for March, as it was one of the fastest intensifying tropical cyclones on record. Ului was a Category 5 tropical cyclone (in 1-minute sustained winds) for a near-record breaking 30 hours. When Ului made landfall in Queensland, Brisbane, damages totaled to be US$72 million ($100 million AUD)

Tropical cyclones formed in March 2010
Storm nameDates activeMax wind
km/h (mph)
Pressure
(hPa)
Areas affectedDamage
(USD)
DeathsRefs
Hubert March 7 – 15100 (65)985 Madagascar Unknown85
Anita March 8 – 1285 (50)995BrazilNoneNone
Ului March 9 – 21215 (130)915 Queensland $72 million1
Tomas March 9 – 17185 (115)925 Wallis and Futuna, Fiji $45 million3
Imani March 20–27130 (80)965NoneNoneNone
Omais (Agaton) March 22–2665 (40)998 Woleai, Fais, Ulithi, Yap $10 thousandNone
Paul March 22 – April 3130 (80)971 Northern Territory UnknownNone
15F March 30 – April 555 (35)999NoneNoneNone

April

Cyclone Robyn Robyn 2010-04-05 0735Z.jpg
Cyclone Robyn

April was an unusually inactive month with only three tropical cyclones forming and two of them being named. No tropical cyclones attained pressure less than 980 hPa, which makes Cyclone Robyn the most intense of the month, attaining that intensity, as well as 10-minute sustained winds of 70 miles per hour. No deaths occurred during this month.

Tropical cyclones formed in April 2010
Storm nameDates activeMax wind
km/h (mph)
Pressure
(hPa)
Areas affectedDamage
(USD)
DeathsRefs
Robyn April 1 – 7110 (70)980NoneNoneNone
Sean April 22 – 25100 (65)988 Northern Territory UnknownNone
TD April 26Not specified1008 Mindanao NoneNone

May

Cyclone Phet Phet 2010-06-02 0655Z.jpg
Cyclone Phet

May was a relatively inactive month with five tropical cyclones forming and all five received names. Tropical Storm Agatha was the deadliest and costliest of the month, killing around 204 people and inflicting $1.11 billion in damage. Cyclone Phet was the most intense tropical cyclone in the month. As Category 4 tropical cyclone on the Saffir–Simpson Hurricane Wind Scale (SSHWS), Phet was the least intense for that category on record, with a high pressure of 970 hPa. Phet attained 3-minute sustained winds of 100 MPH.

Tropical cyclones formed in May 2010
Storm nameDates activeMax wind
km/h (mph)
Pressure
(hPa)
Areas affectedDamage
(USD)
DeathsRefs
Laila May 17 – 21100 (65)986India$118 million65
Bandu May 19 – 2375 (45)994 Yemen, Somalia None1
Joël May 22 – 29100 (65)990 Madagascar Mozambique NoneNone
Agatha May 29 – 3075 (45)1001Mexico, Guatemala $1.11 billion204
Phet May 30 – June 7155 (100)970 Oman, Pakistan, India$780 million44

June

Hurricane Celia Celia 2010-06-25 0830Z.jpg
Hurricane Celia

June was relatively inactive with only six systems forming all within the northern hemisphere, with four further developing into tropical storms and receiving names. Hurricane Celia was the strongest and most intense tropical cyclone of the month which became a Category 5 hurricane on the Saffir–Simpson hurricane wind scale; the first Category 5 in the month of June in the Eastern Pacific basin since Ava in 1973. Hurricane Alex is tied with 1957's Hurricane Audrey as the most intense hurricane in the month of June on record in the Atlantic, peaking at 946 hPa.

Tropical cyclones formed in June 2010
Storm nameDates activeMax wind
km/h (mph)
Pressure
(hPa)
Areas affectedDamage
(USD)
DeathsRefs
TD June 3–5Not specified1002NoneNoneNone
Two-E June 16–1755 (35)1007MexicoMinimalNone
Blas June 17–21100 (65)994NoneNoneNone
Celia June 18–28260 (160)921Mexico, Clipperton Island NoneNone
Darby June 23–28195 (120)959MexicoNoneNone
Alex June 25 – July 2175 (110)946 Greater Antilles, Belize, Yucatán Peninsula, Northern Mexico, Texas $1.52 billion33

July

Typhoon Chanthu Chanthu Jul 22 2010 0325Z.jpg
Typhoon Chanthu

July was a very inactive month and the least active July on record for any given year, with only eight tropical cyclones forming, three of which becoming named tropical storms. Only two reached hurricane strength, with no major-hurricane equivalent tropical cyclones. Typhoon Chanthu was the most intense tropical cyclone in the month, with a minimum pressure of 965 hPa, and 10-minute sustained winds of 80 mph.

Tropical cyclones formed in July 2010
Storm nameDates activeMax wind
km/h (mph)
Pressure
(hPa)
Areas affectedDamage
(USD)
DeathsRefs
Two July 8–955 (35)1005 Northern Mexico, South Texas MinimalNone
Conson (Basyang) July 11–18130 (80)975 Philippines China, Vietnam $82 million106
Six-E July 14–1655 (35)1006MexicoNoneNone
Chanthu (Caloy) July 17–23130 (80)965 Philippines China$818 million19
TD July 18–2055 (35)1004JapanNoneNone
Bonnie July 22–2475 (45)1005 Puerto Rico, Hispaniola, Turks and Caicos Islands, The Bahamas, Florida $1.36 million1
TD July 23–24Not specified1008 Taiwan NoneNone
TD July 26–2855 (35)1002ChinaNoneNone

August

Hurricane Earl Earl 2010-09-02 0320Z.jpg
Hurricane Earl

August was above average, featuring 16 systems with 12 of them being named. The strongest storm was Hurricane Earl, with a minimum pressure of 927 hPa, and 1-minute sustained winds of 145 MPH.

Tropical cyclones formed in August 2010
Storm nameDates activeMax wind
km/h (mph)
Pressure
(hPa)
Areas affectedDamage
(USD)
DeathsRefs
Colin August 2–860 (95)1005 Leeward Islands, Bermuda, Carolinas, New England Minimal1
Domeng August 3–540 (65)997 Philippines Minimal3
Dianmu (Ester) August 6–1295 (60)985 South Korea, Japan$42 million37
Estelle August 6–10100 (65)994MexicoNoneNone
Five August 10–1155 (35)1007 Gulf Coast of the United States $1 millionNone
Eight-E August 20–2155 (35)1003NoneNoneNone
Frank August 21–28150 (90)978Mexico$8.3 million6
Danielle August 21–30215 (130)942 Bermuda, East Coast of the United States Minimal2
Mindulle August 22–2585 (50)985 Vietnam $43.3 million10
Earl August 25 – September 4230 (145)927 Leeward Islands, Puerto Rico, The Bahamas, Eastern United States, Atlantic Canada, Quebec $45 million5
TD August 26–2855 (35)1004NoneNoneNone
Lionrock (Florita) August 27 – September 495 (60)985 Philippines Taiwan, China$65.1 millionNone
Kompasu (Glenda) August 28 – September 2150 (90)960China, Korea $58.3 million29
Namtheun August 29–3165 (40)996 Taiwan, ChinaNoneNone
Fiona August 30 – September 3100 (65)998 Leeward Islands, Bermuda MinimalNone
TD August 30–3155 (35)1008NoneNoneNone

September

Hurricane Igor Igor 2010-09-14 1945Z.png
Hurricane Igor

September was fairly-above average, featuring 15 storms, with 13 of them being named. Igor was the strongest system, with a minimum pressure of 924 hPa and 1-minute sustained winds of 155 MPH.

Tropical cyclones formed in September 2010
Storm nameDates activeMax wind
km/h (mph)
Pressure
(hPa)
Areas affectedDamage
(USD)
DeathsRefs
Malou (Henry) September 1–1095 (60)985JapanUnknownNone
Gaston September 1–265 (40)1005 Leeward Islands, Puerto Rico NoneNone
Ten-E September 3–455 (35)1003NoneNoneNone
Eleven-E September 3–455 (35)1004Mexico, Central America$500 millionNone
Hermine September 5–9110 (70)989Central America, Mexico, Texas Oklahoma, Kansas $740 million52
Meranti September 7–10100 (65)985 Taiwan, China$118 million3
Georgette September 20–2365 (40)999 Baja California Peninsula, MexicoMinimalNone
Igor September 8–21250 (155)924 Cape Verde, Leeward Islands, Bermuda, East Coast of the United States, Newfoundland and Labrador $200 million4
Julia September 12–20220 (140)948 Cape Verde MinimalNone
Fanapi (Inday) September 14–21175 (110)935 Taiwan, China$1 billion105
Karl September 14–18205 (125)956 Belize, Yucatán Peninsula, Veracruz $3.9 billion22
Malakas September 20–25155 (100)945JapanNoneNone
Lisa September 20–26140 (85)982NoneNoneNone
Matthew September 23–2695 (60)998 Venezuela, Jamaica, Central America, Mexico$172.2 million126
Nicole September 28–2975 (45)995 Cayman Islands, Jamaica, Cuba, The Bahamas, Florida, East Coast of the United States $245.4 million16

October

Typhoon Megi Megi 2010-10-18 0235Z.jpg
Typhoon Megi

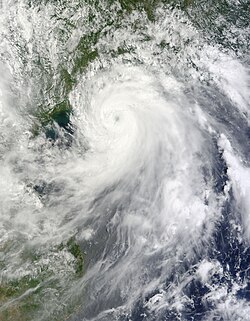
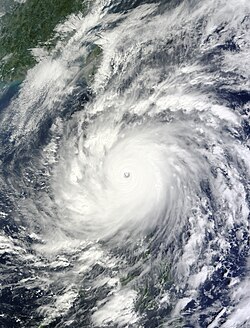
October was slightly-below average, featuring 15 storms, with 9 of them being named. October featured Typhoon Megi, the strongest storm of the year, with a minimum pressure of 885 hPa and 10-minute sustained winds of 145 MPH.

Tropical cyclones formed in October 2010
Storm nameDates activeMax wind
km/h (mph)
Pressure
(hPa)
Areas affectedDamage
(USD)
DeathsRefs
14W October 5–1055 (35)1006ChinaNoneNone
Otto October 6–10140 (85)976 Leeward Islands, Virgin Islands, Puerto Rico $22.5 millionNone
TD October 7–8Not specified1012NoneNoneNone
BOB 02 October 7 –945 (30)996India, Bangladesh Minimal17
Paula October 11–16165 (105)981 Honduras, Nicaragua, Mexico, Cuba, The Bahamas, Florida Unknown1
Megi (Juan) October 12–24230 (145)885 Philippines, Taiwan, China$709 million69
BOB 03 October 13–1665 (40)995IndiaMinimalNone
Richard October 20–26155 (100)977Central America$80 million1
Giri October 20–23195 (120)950 Bangladesh Myanmar, Thailand, Yunnan $359 million157
17W October 20–2755 (35)1004NoneNoneNone
Chaba (Katring) October 20–31175 (110)935JapanMinimalNone
01 October 25—2955 (35)997NoneNoneNone
Shary October 28–30120 (75)989 Bermuda MinimalNone
Anggrek October 28 – November 474 (45)995 Cocos (Keeling) Islands NoneNone
Tomas October 29 — November 7155 (100)982 Windward Islands, Leeward Islands, Greater Antilles, Lucayan Archipelago $463.4 million51

November

Cyclone Abele Abele 2010-12-02 0820Z.jpg
Cyclone Abele

November was extremely inactive, featuring 5 storms and only 2 named storms. Due to this inactivity, Cyclone Abele was the strongest of the month, with a minimum barometric pressure of 974 hPa and 10-minute sustained winds of 80 MPH.

Tropical cyclones formed in November 2010
Storm nameDates activeMax wind
km/h (mph)
Pressure
(hPa)
Areas affectedDamage
(USD)
DeathsRefs
Jal November 1–8110 (70)988 Thailand, Malaysia, Andaman Islands, India$392 million117
TD November 3–455 (35)1006 Vietnam NoneNone
18W November 12–1455 (35)1004 Vietnam, Laos, Thailand UnknownNone
01F November 24–3065 (40)999 Vanuatu, Fiji NoneNone
Abele November 28 — December 4130 (80)974NoneNoneNone

December

Cyclone Tasha Tasha dec 25 2010 0040Z.jpg
Cyclone Tasha

December was somewhat active, however, it was very inactive in terms of named systems, with only two of the ten tropical cyclones forming, Omeka and Tasha, getting named. The month started off extremely late on December 20th, with both Omeka and Tasha forming, the latter becoming the most intense cyclone this month, with a minimum pressure of only 993hPa.

Tropical cyclones formed in December 2010
Storm namesDates activeMax wind
km/h (mph)
Pressure
(hPa)
Areas affectedDamage
(USD)
DeathsRefs
BOB 06 December 7 –845 (30)1000IndiaMinimalNone
19W December 12–1355 (35)1002 Vietnam NoneNone
03U December 15–2065 (40)989 Western Australia $77 millionNone
Omeka December 20–2185 (50)997 Hawaii NoneNone
Tasha December 20–2575 (45)993 Queensland Unknown1
05U December 22–24Not specifiedNot specifiedNoneNoneNone
06U December 30 – January 255 (35)993 Northern Territory, Western Australia NoneNone
07U December 30 – January 2Not specifiedNot specifiedNoneNoneNone
02F December 31 – January 2Not specified1004NoneNoneNone
08U December 31 – January 2Not specifiedNot specifiedNoneNoneNone

Global effects

There are a total of seven tropical cyclone basins that tropical cyclones typically form in this table, data from all these basins are added. [12]

Season nameAreas affectedSystems formedNamed stormsHurricane-force
tropical cyclones
Damage
(2010 USD)
DeathsRef.
North Atlantic Ocean [a] Greater Antilles, Central America, Yucatán Peninsula, Northern Mexico, Leeward Islands, Bermuda, East Coast of the United States, Cabo Verde, Eastern Mexico, Central America, Windward Islands, Leeward Antilles, Lucayan Archipelago 211812~$7.39 billion315 (77)
Eastern and Central Pacific Ocean [a] Northwestern Mexico, Southwestern Mexico, Central America, Clipperton Island, Hawaii 1393$1.62 billion210 (58)
Western Pacific Ocean [b] Vietnam, Cambodia, Woleai, Fais, Ulithi, Yap, Mindanao, Philippines, South China, Japan, Taiwan, Northern Luzon, South Korea, East China, Laos, Thailand 28149$2.95 billion384
North Indian Ocean [c] India, Somalia, Yemen, Oman, Pakistan, Bangladesh, Myanmar, Thailand, Yunnan, Malaysia, Andaman Islands 853$3.07 billion414
South-West Indian Ocean January – June [d] [e] Reunion, Mauritius, Madagascar, Mauritius, Rodrigues 931Un­known85
July – December [b] 211
Australian region January – June [d] Western Australia, Eastern Indonesia, Top End, Kimberley, Queensland, Papua New Guinea, Cocos (Keeling) Islands 9752
July – December [b] Cocos (Keeling) Islands, Western Australia, Queensland, Northern Territory71$77 million1
South Pacific Ocean January – June [d] French Polynesia, Southern Cook Islands, Solomon Islands, Samoan Islands, Tonga, Vanuatu, Wallis and Futuna, Fiji 1285$226.7 million7
July – December [b] Vanuatu, Fiji 2
South Atlantic Ocean Brazil 21Un­known
Worldwide(See above)113 [f] 6739$15.34 billion1,418 (135)
  1. 1 2 The wind speeds for this tropical cyclone/basin are based on the Saffir Simpson Scale which uses 1-minute sustained winds.
  2. 1 2 3 4 Only systems that formed either before or on December 31, 2010 are counted in the seasonal totals.
  3. The wind speeds for this tropical cyclone/basin are based on the IMD Scale which uses 3-minute sustained winds.
  4. 1 2 3 Only systems that formed either on or after January 1, 2010 are counted in the seasonal totals.
  5. The wind speeds for this tropical cyclone are based on Météo-France, which uses wind gusts.
  6. The sum of the number of systems in each basin will not equal the number shown as the total. This is because when systems move between basins, it creates a discrepancy in the actual number of systems.

See also

Notes

  1. All damage figures are in their respective currency's 2010 value.
5All storms occurring outside of 2010 are not counted in the death and damage figures

References

  1. 1 2 3 Record-breaking La Niña events (PDF) (Report). Australian Bureau of Meteorology. July 2012. Archived (PDF) from the original on March 4, 2016. Retrieved March 20, 2016.
  2. "ENSO Wrap-Up: Neutral conditions returning to the Pacific" (PDF). Retrieved February 18, 2024.
  3. El Niño/Southern Oscillation (ENSO) diagnostic discussion: June 2010 (PDF) (Report). United States Climate Prediction Center. June 3, 2010. Archived (PDF) from the original on August 6, 2016.
  4. V. Platonov; E. Semenov; E. Sokolikhina (February 13, 2014). "Extreme La-Nina 2010/11 and the vigorous flood at the north-east of Australia" (PDF). EGU General Assembly/Geophysical Research. Retrieved October 15, 2014.
  5. "International Marine Warning — Other 2010-01-07 00z". Fiji Meteorological Service. January 7, 2010. Archived from the original on May 20, 2024. Retrieved January 7, 2010.
  6. Staff Writer (January 18, 2010). "JTWC Tropical Cyclone Warning: 01W: 2010-01-18 21z". Joint Typhoon Warning Center. Archived from the original on May 22, 2024. Retrieved January 20, 2010.
  7. Staff Writer (January 19, 2010). "JTWC Tropical Cyclone Warning: 01W: 2010-01-19 09z". Joint Typhoon Warning Center. Archived from the original on May 22, 2024. Retrieved January 20, 2010.
  8. Staff Writer (January 19, 2010). "Prognostic reasoning for Tropical Depression 01W 2010-01-19 15z". Joint Typhoon Warning Center. Archived from the original on May 22, 2024. Retrieved January 20, 2010.
  9. DARWIN Tropical Cyclone Warning Centre 0708 UTC 16/01/2010
  10. "Issued at 11:03 pm CST Monday 25 January 2010. Refer to Tropical Cyclone Advice Number 16". Bureau of Meteorology, Darwin. January 25, 2010. Archived from the original on May 21, 2024. Retrieved January 25, 2010.
  11. "Issued at 02:00 am CST Thursday 28 January 2010. Refer to Tropical Cyclone Advice Number 30". Bureau of Meteorology, Darwin. January 28, 2010. Archived from the original on May 21, 2024. Retrieved January 27, 2010.
  12. "Tropical Cyclone Heat Potential Seven Basins". NOAA. Retrieved October 20, 2021.

Regional Specialized Meteorological Centers

Tropical Cyclone Warning Centers

PD-icon.svg This article incorporates public domain material from websites or documents of the National Weather Service .