The 2015 Atlantic hurricane season was the last of three consecutive below average Atlantic hurricane seasons. It produced twelve tropical cyclones, eleven named storms, four hurricanes, and two major hurricanes.[nb 1] The Accumulated Cyclone Energy (ACE) for the season was 68% of the long-term median value.[2] The hurricane season officially began on June 1, 2015, and ended on November 30, 2015. These dates historically describe the period each year when most tropical cyclones form in the North Atlantic basin. However, the first named storm, Ana, developed on May8, nearly a month before the official start of the season, the first pre-season cyclone since Beryl in 2012 and the earliest since Ana in 2003. The formation of Ana marked the start of a series of seven consecutive seasons with pre-season activity, spanning from 2015 to 2021.[3] The season concluded with Kate transitioning into an extratropical cyclone on November11, almost three weeks before the official end.
Although most of the storms impacted land, overall effects were minimal. Ana caused minor flooding and wind damage in the Carolinas and left two dead in North Carolina. Tropical Storm Bill and its remnants caused flooding primarily in the South Central, Midwestern, and Mid-Atlantic regions of the United States, while its precursor also left flooding in Central America and Mexico. The storm resulted in two deaths in Honduras, two in Guatemala, one in Mexico, and three deaths in the United States. Additionally, the United States suffered at least $100million (2015USD) in damage.[nb 2] Claudette and Danny left very minimal impact on land. In late August, Tropical Storm Erika brought heavy rainfall to Dominica, leading to devastating floods. Erika caused nearly $500million in damage and 30fatalities, making it, at the time, the island's deadliest natural disaster since Hurricane David in 1979. The storm also flooded other nearby islands, but to a much lesser degree, such as Guadeloupe, Puerto Rico, and Hispaniola. Five additional deaths occurred in Haiti.
Fred prompted a hurricane warning for Cape Verde for the first time ever and was the first storm to pass through the islands as a hurricane since 1892. Strong winds there left about $2.5million in damage. Two deaths were presumed to have occurred after two fishermen never returned to port. Seven other sailors likely drowned offshore Guinea-Bissau after their fishing boat collapsed. Tropical storms Grace, Henri, and Ida left negligible impact on land. Hurricane Joaquin's intensity and slow movement in the vicinity of the Bahamas resulted in severe damage on some islands. Additionally, the American cargo ship SSEl Faro went missing near Crooked Island and eventually capsized during the storm, drowning 33people. Rough seas in Haiti also caused damage and one death from a fisherman drowning. Joaquin was the most intense satellite era tropical cyclone of non-tropical origins. The remnants of Kate affected the British Isles, particularly Wales in the United Kingdom. Throughout the season, these storms collectively caused $813.9million in damage and 89deaths.
With the exception of Tropical Storm Risk's initial season prediction in December2014, all major forecasting agencies called for a below or near-average season, due to the strong 2014–16 El Niño event and colder than average sea surface temperatures. Overall, the forecasts were fairly accurate.
Seasonal forecasts
Predictions of tropical activity in the 2015 season
* June–November only † Most recent of several such occurrences. (See all)
In advance of, and during, each hurricane season, several forecasts of hurricane activity are issued by national meteorological services, scientific agencies, and noted hurricane experts. These include forecasters from the United States National Oceanic and Atmospheric Administration (NOAA)'s National Hurricane and Climate Prediction Center, Tropical Storm Risk, the United Kingdom's Met Office, and Philip J. Klotzbach, William M. Gray and their associates at Colorado State University (CSU). The forecasts include weekly and monthly changes in significant factors that help determine the number of tropical storms, hurricanes, and major hurricanes within a particular year. According to NOAA and CSU, the average Atlantic hurricane season between 1981 and 2010contained roughly 12tropical storms, six hurricanes, three major hurricanes, and an accumulated cyclone energy (ACE) index of 66–103 units.[4][6] Broadly speaking, ACE is a measure of the power of a tropical or subtropical storm multiplied by the length of time it existed. Therefore, a storm with a longer duration or stronger intensity will have high values of ACE. It is only calculated for full advisories on specific tropical and subtropical systems reaching or exceeding wind speeds of 39mph (63km/h). Accordingly, tropical depressions are not included here. After the storm has dissipated, typically after the end of the season, the NHC reexamines the data, and produces a final report on each storm. These revisions can lead to a revised ACE total either upward or downward compared to the operational value.[17] NOAA typically categorizes a season as either above-average, average, or below-average based on the cumulative ACE Index, but the number of tropical storms, hurricanes, and major hurricanes within a hurricane season are considered occasionally as well.[4]
Pre-season forecasts
On December9, 2014, Tropical Storm Risk (TSR), a public consortium consisting of experts on insurance, risk management, and seasonal climate forecasting at University College London, issued its first outlook on seasonal hurricane activity during the 2015 season. In its report, the organization forecast activity about 20% below the 1950–2014 average, or about 30% below the 2005–2014 average, totaling to 13 (±4) tropical storms, 6 (±3) hurricanes, 2 (±2) major hurricanes, and a cumulative ACE index of 79 (±58) units. This forecast was largely based on an enhancement of low-level trade winds across the tropical Atlantic during the July to September period. TSR's report stressed that uncertainty in this forecast existed due to the unpredictability in the El Niño–Southern Oscillation and North Atlantic sea surface temperatures.[6]
A few months later, on April9, 2015, TSR updated its report, detailing its prediction of activity 45% below the 1950–2014 average, or about 50% below the recent 2005–2014 average, with 11 named storms, 5 hurricanes, 2 major hurricanes, and a cumulative ACE index of 56 units. TSR cited what were expected to be cooler than average ocean temperatures across the tropical North Atlantic and Caribbean Sea as reasoning for lower activity. In addition, the report stated that if the ACE forecast for 2015 were to verify, the total values during the three-year period from 2013 to 2015 would be the lowest since 1992–1994, signalling a possible end to the active phase of Atlantic hurricane activity that began in 1995.[7]
On April9, CSU also released its first quantitative forecast for the 2015 hurricane season, predicting 7 named storms, 3 hurricanes, 1 major hurricane, and a cumulative ACE index of 40 units. The combination of cooler than average waters in the tropical and subtropical Atlantic, as well as a developing El Niño predicted to reach at least moderate intensity, were expected to favor one of the least active seasons since the mid-1990s. The probabilities of a major hurricane striking various coastal areas across the Atlantic were lower than average, although CSU stressed that it only takes one landfalling hurricane to make it an active season for residents involved.[8] On April13, North Carolina State University (NCSU) released its forecast, predicting a near record-low season with just 4 to 6 named storms, 1 to 3 hurricanes, and 1 major hurricane.[9]
On May21, the United Kingdom Met Office (UKMO) issued its forecast, predicting a season with below-normal activity. It predicted 8 storms, with a 70% chance that the number of storms would be between 6 and 10; it predicted 5 hurricanes, with a 70% chance that that number would fall in the range of 3 to 7. UKMO's ACE index prediction was 74 units, with a 70% chance of the index falling in the range of 40 to 108 units.[10] On May27, NOAA released its seasonal forecast, predicting a below-normal season with 6 to 11 named storms, 3 to 6 hurricanes, and 0 to 2 major hurricanes. NOAA indicated that there was a 70% chance of a below-normal season, a 20% chance of a near-normal season, and a 10% chance of an above-normal season.[11]
Mid-season outlooks
On June1, CSU released an updated forecast, increasing the number of predicted named storms to 8, due to the early formation of Tropical Storm Ana, while keeping the predictions for hurricanes and major hurricanes at 3 and 1, respectively; the ACE index forecast was also kept at 40 units. Probabilities of a major hurricane making landfall on various coastal areas remained below average.[12] CSU's third forecast, issued on July1, remained unchanged.[13] The fourth and final forecast issued by CSU on August4 again predicted eight named storms and one major hurricane, but the number of hurricanes was decreased to two.[14] On August5, TSR updated their forecast and lowered the number of hurricanes developing within the basin to 4, with only 1 forecasted to be a major hurricane. The ACE index was also reduced to 44 units.[15]
The Atlantic hurricane season officially began on June 1, 2015.[9] It was a slightly below average season in which twelve tropical cyclones formed. Eleven of the twelve designated cyclones attained tropical storm status. Of the eight tropical storms, four reached at least Category 1 hurricane intensity. The 2015 season extended the period without major hurricane landfalls in the United States to ten years, with the last such system being Hurricane Wilma in 2005. The lack of activity was primarily attributed to an atmospheric circulation that favored dry, sinking air over low latitudes to the west of 40°W and westerly wind shear enhanced by El Niño.[18] A few notable events occurred during the season. Ana was the first tropical cyclone to form in the off-season since 2012.[19]Erika became only the second storm in the satellite era to be retired without reaching hurricane strength (Tropical Storm Allison was the first) and only the third to be retired without having made landfall (Hurricanes Klaus and Fabian were the first and second, respectively). Fred was one of the easternmost tropical storms recorded and made landfall in Cape Verde as a Category1 hurricane, becoming the first hurricane to strike that country since 1892.[20] Joaquin was the most intense storm of non-tropical origin in the satellite era and the strongest to affect the Bahamas in October since 1866.[21] The tropical cyclones of this season caused 89 deaths and at least $731.8million in damage.[22] The Atlantic hurricane season officially ended on November 30, 2015.[9]
Tropical cyclogenesis began early, with Ana developing on May8, over three weeks prior to the official beginning of the season and far ahead of the long-term climatological average of July9. The month of June featured one tropical cyclone, Bill, which formed on June16. Claudette, the only system in the month of July, developed on July13. The rate of tropical cyclogenesis increased in August, though no storms developed in the first half of the month. Danny, the season's first major hurricane, formed on August16, followed by Erika on August24, and Fred on August30. September, which is the climatological peak of hurricane season, featured five additional tropical cyclones – Grace, Henri, Tropical Depression Nine, Ida, and Joaquin. The most intense storm of the season was Joaquin, which peaked as a strong Category4 hurricane with maximum sustained winds of 155mph (250km/h), just short of Category5 on the Saffir–Simpson hurricane wind scale. Joaquin lasted into October, though no other systems developed that month. The season's final cyclone, Kate, developed on November8 and became extratropical on November11.[18] The season's activity was reflected with an Accumulated Cyclone Energy (ACE) rating of 62.7, which was well below the 1981–2010median of 92.[23][24]
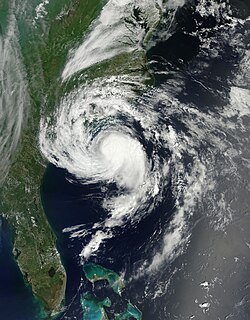
A low-pressure area of non-tropical origins developed into Subtropical Storm Ana at 00:00UTC on May8, while situated about 175 miles (282km) southeast of Myrtle Beach, South Carolina. The system was classified as subtropical due to its involvement with an upper trough, as well as its large wind field. Throughout the day, convection progressively increased as Ana moved north-northwestward across the warm sea surface temperatures associated with the Gulf Stream. At 00:00UTC on May9, the cyclone attained its peak intensity with maximum sustained winds of 60 miles per hour (97km/h) and a minimum barometric pressure of 998 millibars (29.5inHg). Six hours later, Ana transitioned into a fully tropical system. However, the storm soon began weakening after moving away from the warm waters of the Gulf Stream and increasing wind shear also contributed to the deterioration of Ana. Around 10:00UTC on May10, the system made landfall near North Myrtle Beach, South Carolina, with winds of 45mph (70km/h). Ana weakened to a tropical depression just eight hours later and transitioned into a remnant low near the Delmarva Peninsula at 00:00UTC on May12. The remnant low merged with a frontal system about 24hours later.[25]
Striking South Carolina on May10, Ana became the earliest U.S. landfalling system on record. In the state, a storm surge peaking at about 2.5 feet (0.76m) resulted in erosion and minor coastal flooding,[25] with roads washed out at North Myrtle Beach.[26] Inland, moderate rainfall caused a lake to rise above its bank, inundating some homes and streets.[27] One drowning death occurred in North Carolina after rip currents caused a man to remain underwater for more than 10minutes. Rainfall in the state peaked at 6.7 inches (170mm) southeast of Kinston, North Carolina, where minor street flooding took place. In Lenoir County, local firefighters rescued several stranded individuals by boat when rising floodwaters isolated about 10residences.[25] Tropical storm-force winds were confined to coastal areas, with a peak gust of 62mph (100km/h) observed near Southport.[28] An additional death occurred in North Carolina after a tree fell on a car in Richlands.[25] Damages totaled to $20,000.[29]
The National Hurricane Center (NHC) began monitoring an area disorganized convection across the northwestern Caribbean Sea in association with an upper-level trough on June12.[30] After interacting with a broad area of low pressure near the Yucatán Peninsula, an elongated area of low pressure formed in the vicinity on June13. The system moved northwestward into the Gulf of Mexico and developed a well-defined circulation early on June16. Because the system was already producing tropical storm force winds, it was immediately classified as Tropical Storm Bill while situated about 200mi (320km) from the US. Initially continuing northwestward, Bill re-curved west-northwestward later on June16. Around 12:00UTC, the storm peaked with winds of 60mph (95km/h) and a minimum pressure of 997mbar (29.4inHg). Just under five hours later, Bill made landfall near on Matagorda Island, Texas, at the same intensity. The cyclone weakened to a tropical depression and turned northward early on June17.[31] However, possibly due to the rare brown ocean effect,[32] Bill remained a tropical cyclone until late on June18, when it degenerated into a remnant low over eastern Oklahoma. The remnant low moved east-northeastward until dissipating over West Virginia on June21.[31]
The precursor to Bill produced widespread heavy rain in Central America. In Guatemala, flooding affected more than 100homes while a landslide killed two people.[33] Two others died in Honduras due to flooding with two more missing.[34] Heavy rains fell across parts of the Yucatán Peninsula, with accumulations peaking at 13in (330mm) in Cancún, the highest daily total seen in the city in nearly two years. One person died from electrocution in the city.[35] In Texas, flooding was exacerbated by record rainfall in some areas in May. A number of roads were inundated and several water rescues were required in Alice and San Antonio. Major traffic jams occurred in the Houston and Dallas areas. Coastal flooding left minor damage, mostly in Galveston and Matagorda counties.[31] One death occurred when a boy was swept into a culvert.[36] In Oklahoma, numerous roads were also inundated by water. Interstate 35 was closed near Turner Falls due to a rockslide and near Ardmore because of high water. There were two fatalities in Oklahoma, both from drowning. There was also flooding in several others states.[31] Across the United States, Bill was responsible for at least $100million in damage.[37][38][39]
In early July, a shortwave trough embedded in the westerlies crossed the United States. The system emerged over the Atlantic near the Outer Banks of North Carolina on July12; a surface low soon developed. Traversing the Gulf Stream, convection abruptly increased on July13 and it is estimated that a tropical depression formed by 06:00UTC that day, roughly 255mi (410km) east-northeast of Cape Hatteras. Six hours later, the depression intensified into a tropical storm and was assigned the nameClaudette. The sudden development of the cyclone was not well-forecast,[40] and Claudette was not operationally warned upon until it was already a tropical storm.[41] Embedded within southwesterly flow ahead of mid-latitude trough, the storm moved generally northeast. Claudette reached its peak intensity around 18:00UTC with winds of 50mph (80km/h) and a pressure of 1003 mbar (hPa; 29.62inHg). Increasing wind shear on July14 prompted weakening, displacing convection from the storm's center. It subsequently degenerated into a remnant low by 00:00UTC on July15. The remnants of Claudette were absorbed into a frontal boundary just south of Newfoundland later that day.[40]
Foggy and wet conditions associated with Claudette forced flight cancellations and travel delays across portions of eastern Newfoundland.[42]
A tropical wave emerged off the western coast of Africa in mid-August, acquiring sufficient organization to be declared a tropical depression by 06:00UTC on August18 while located about 765mi (1,231km) southwest of Cape Verde. The depression intensified into Tropical Storm Danny six hours later. Steered generally westward, the cyclone initially struggled to intensify quickly in the midst of abundant Saharan Air Layer, but it managed to attain hurricane intensity around 12:00UTC on August20. Thereafter, Danny began a period of rapid deepening, becoming a Category3 hurricane and attaining peak winds of 125mph (200km/h) early on August21. The negative effects of dry air and increased shear began to affect the cyclone after peak.[43]
Early on August22, the storm weakened to a Category2 and further to a Category1 hurricane several hours later. Danny then deteriorated to a tropical storm by 00:00UTC on August23. After about twelve hours, the cyclone weakened to a tropical depression as it moved through the Leeward Islands. Danny degenerated into an open wave at 18:00UTC on August24. The remnants of Danny continued to the west-northwest for another day and was last noted over Hispaniola. The hurricane prompted the issuance of several tropical storm warnings for the Lesser Antilles.[43] Leeward Islands Air Transport cancelled 40 flights and sandbags were distributed in the United States Virgin Islands.[44][45] Danny ultimately only brought light rain to the region, with its effects considered beneficial due to a severe drought.[43]
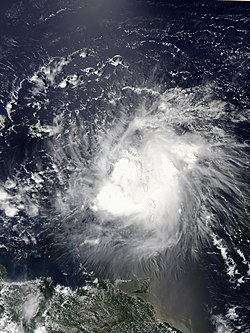
A westward-moving tropical wave developed into Tropical Storm Erika late on August24 while located about 1,035mi (1,666km) east of the Leeward Islands. Steered briskly westward by southerly flow associated with a subtropical ridge, the storm did not strengthen further despite initially favorable conditions. On August25, Erika encountered wind shear and dry mid-level air, causing the storm to weaken slightly and leaving the low-level circulation partially exposed. Contrary to predictions of a northwesterly recurvature, the cyclone persisted on a westerly course and passed through the Leeward Islands just north of Guadeloupe on August27. Unfavorable conditions in the Caribbean Sea prevented Erika from strengthening beyond 50mph (80km/h). Late on August28, the storm degenerated into a low-pressure area just south of the eastern tip of Hispaniola. Shortly thereafter, the remnants trekked across Hispaniola and later Cuba, before reaching the Gulf of Mexico on September1. After striking Florida on the following day, the remains of Erika became indistinguishable over Georgia on September3.[46]
Several Leeward Islands experienced heavy rainfall during the passage of Erika, especially Dominica. There, 15in (380mm) of precipitation fell at Canefield Airport,[47][48] causing catastrophic mudslides and flooding. A total of 890 homes were destroyed or left uninhabitable while 1,429 people were rendered homeless, and entire villages were flattened.[49] With a total of 30deaths, Erika was the deadliest natural disaster in Dominica since David in 1979.[50][51] Overall, there was up to $500million in damage and the island was set back approximately 20years in terms of development.[46][52] In Guadeloupe, heavy rainfall in the vicinity of Basse-Terre caused flooding and mudslides, forcing roads to temporarily close.[53] Approximately 200,000people in Puerto Rico were left without electricity.[54] The island experienced at least $17.4million in agricultural damage.[46] In the Dominican Republic, a weather station in Barahona measured 24.26in (616mm) of rain, including 8.8in (220mm) in a single hour.[55] A total of 823homes suffered damage and 7,345people were displaced.[56] Five people died in Haiti, four from a weather-related traffic accident and one from a landslide.[57]
A well-defined tropical wave developed into a tropical depression just offshore Africa about 190mi (305km) west-northwest of Conakry, Guinea, early on August30. About six hours later, the depression intensified into a tropical storm. The next day, Fred further grew to a Category1 hurricane and several hours later peaked with winds of 85mph (135km/h) and a minimum pressure of 986mbar (29.1inHg) while approaching Cape Verde. After passing Boa Vista and moving away from Santo Antão, it entered a phase of steady weakening, dropping below hurricane status by September1. Fred then turned to the west-northwest and endured increasingly hostile wind shear,[58] but maintained its status as a tropical cyclone despite repeated forecasts of dissipation.[59] It fluctuated between a minimal tropical storm and tropical depression through September 4–5 before curving sharply to the north. By September 6, Fred's circulation pattern had diminished considerably and the cyclone degenerated into a trough several hours later while located about 1,210mi (1,950km) southwest of the Azores. The remnants were soon absorbed by a frontal system.[58]
At the threat of the hurricane, all of Cape Verde was placed under a hurricane warning for the first time in history.[60] Gale-force winds battered much of the Barlavento region through August31, downing numerous trees and utility poles.[61] On the easternmost islands of Boa Vista and Sal, Fred leveled roofs and left several villages without power and phone services for several days. About 70percent of the houses in Povoação Velha were damaged to some degree.[62] Throughout the northern islands, rainstorms damaged homes and roads, and São Nicolau lost large amounts of its crop and livestock.[63] Monetary losses reached $2.5million across Cape Verde,[64] though the rain's overall impact on the agriculture was positive.[65] Swells from the hurricane produced violent seas along West African shores, destroying fishing villages and submerging large swaths of residential area in Senegal.[66] Overall, nine deaths were directly attributed to Fred.[58]
A tropical wave emerged off the western coast of Africa on September3. Initially disorganized with a broad area of low pressure, a burst of convection on September5 led to a more well-defined center, and a tropical depression developed around 06:00UTC that day while positioned about 175mi (280km) south of Cape Verde. The depression intensified into Tropical Storm Grace twelve hours later. Embedded within a generally favorable environment, Grace strengthened to attain peak winds of 60mph (95km/h) around 12:00UTC on September6, when a mid-level eye feature was evident on satellite. Thereafter, cooler waters and increased shear caused the cyclone to weaken to a tropical depression early on September8 and dissipate at 12:00UTC the next day while located within the central Atlantic.[67]
On September8, an upper-level trough spawned a tropical depression southeast of Bermuda; the next day it was upgraded to Tropical Storm Henri. The system's circulation was disorganized, with multiple vortices revolving around a mean center.[68] Struggling against strong westerly wind shear, Henri attained a peak intensity of 50mph (80km/h) and a minimum pressure of 1003 mbar (hPa), possibly due to baroclinity.[68] Thereafter, increasing interaction with the same upper-level trough to the west degraded Henri's circulation. It opened up into a trough on September11; the remnants were later absorbed into an extratropical cyclone over the North Atlantic several days later.[68]
On September10, a strong tropical wave emerged off the western coast of Africa. Passing south of Cape Verde, its interaction with a convectively coupled Kelvin wave resulted in increased convection and the formation of an area of low pressure. After further organization, the wave acquired sufficient organization to be declared a tropical depression by 12:00UTC on September16 while located within the central Atlantic. Unfavorable upper-level winds caused the appearance of the cyclone to become disheveled almost immediately after formation, and despite sporadic bursts of convection atop the storm's center, the depression dissipated at 18:00UTC on September19 without ever attaining tropical storm intensity.[69]
A tropical wave emerged into the Atlantic from the west coast of Africa on September13. The wave later interacted with a Kelvin wave, the latter of which contributed to the formation of Tropical Depression Nine. Moving westward with a large area of convection, the tropical wave and the Kelvin wave developed into a well-defined low-pressure area around midday on September15, according to satellite imagery. However, disorganization prevented its classification as a tropical depression until 06:00UTC on September18, while located about 750mi (1,210km) south of the southernmost Cape Verde Islands. The depression moved west-northwestward due to a subtropical ridge to the north and intensified into Tropical Storm Ida early the following day. Westerly wind shear exposed the storm's low-level circulation, causing Ida to strengthen only slightly.[70]
Wind shear briefly decreased, allowing the cyclone to peak with winds of 50mph (80km/h) and a minimum pressure of 1,001mbar (29.6inHg) at 12:00UTC on September21. However, shear increased later that day, causing slow weakening. Ida then decelerated and began moving in a general eastward direction on September22 after becoming embedded in the flow associated with a mid- to upper-level trough. Early on September24, the storm weakened to a tropical depression. During the following day, the trough was replaced with a subtropical ridge, causing Ida to turn northwestward and then west-northwestward on September26. After shear and dry air caused much of the convection to diminish, Ida degenerated into a remnant low around 12:00UTC on September27 while situated about 1,000mi (1,600km) east-northeast of Barbuda.[70]
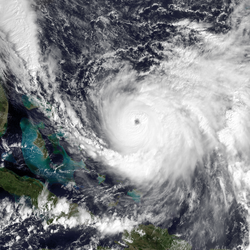
A non-tropical low developed into a tropical depression on September28 about 405mi (650km) southwest of Bermuda, based on the improved circulation on satellite imagery and deep convection forming near the center.[21][71] The storm initially moved slowly southwestward due to a blocking ridge of high pressure to the north. Although wind shear increased slightly, Joaquin tracked over ocean temperatures of 86°F (30°C),[21] allowing the cloud pattern to become better organized.[72] On September30, the storm intensified into a hurricane.[21] Joaquin then rapidly deepened, becoming a Category 4 hurricane late on October1. Joaquin later weakened as it passed through the Bahamas, but reintensified to a Category 4 hurricane while recurving northeastward. On October3, maximum sustained winds peaked at 155mph (250km/h) and a minimum barometric pressure of 931mbar (27.5inHg). Thereafter, Joaquin began to rapidly weaken as it approached Bermuda. The cyclone then turned eastward and maintained hurricane status until October 7. By the following day, Joaquin became extratropical about 445mi (715km) west-northwest of Corvo Island in the Azores. The remnants later struck Portugal, before dissipating over the Gulf of Cádiz on October15.[21]
Battering the Bahamas's southern islands for over two days, Joaquin caused extensive devastation, especially on Acklins, Crooked Island, Long Island, Rum Cay, and San Salvador Island.[21] Severe storm surge inundated many communities, trapping hundreds of people in their homes; flooding persisted for days after the hurricane's departure.[73][74] Prolonged, intense winds brought down trees and powerlines, and unroofed homes throughout the affected region.[21] As airstrips were submerged and heavily damaged, relief workers were limited in their ability to quickly help affected residents.[75] Damage in the Bahamas totaled about $200million.[76][77] Offshore, the American cargo ship El Faro and her 33crew members were lost to the hurricane. Coastal flooding also impacted the Turks and Caicos, washing out roadways, compromising seawalls, and damaging homes. Strong winds and heavy rainfall caused some property damage in eastern Cuba.[21] One fisherman died when heavy seas capsized a small boat along the coast of Haiti.[75] Storm tides resulted in severe flooding in several of Haiti's departments, forcing families from their homes and destroying crops.[78] Joaquin also posed a threat to parts of the East Coast of the United States. State of emergencies were declared in Maryland, New Jersey, North Carolina, South Carolina, and Virginia,[79] as well as a mandatory evacuation from Ocracoke, North Carolina.[80] Joaquin ultimately curved northeast and caused little direct impact in the United States, but another large storm system over the southeastern states drew tremendous moisture from the hurricane, resulting in catastrophic flooding in South Carolina.[21] The storm brought strong winds to Bermuda that cut power to 15,000customers.[81] Damage on Bermuda was minor.[82]
On October30, a poorly defined tropical wave and its associated small area of disturbed weather emerged into the Atlantic from the west coast of Africa. Strong wind shear prevented significant development or organization of deep convection for a few days. However, by November5, cloudiness and showers increased as the system was approaching the Lesser Antilles. Two days later, the system underwent a rapid increase in convection, and satellite imagery indicated development of a surface circulation. A tropical depression formed just to the north of the Turks and Caicos Islands around 18:00UTC on November8. The depression strengthened into Tropical Storm Kate early on November9. After initially moving northwestward, Kate briefly accelerated northward around the western periphery of a subtropical ridge over the central Atlantic. Thereafter, the cyclone accelerated further and curved northeastward due to the mid-latitude westerlies.[83]
After intensification and improvements to convective banding, Kate was upgraded to a Category1 hurricane at 00:00UTC on November11. Twelve hours later, the storm peaked with maximum sustained winds of 85mph (135km/h) and a minimum barometric pressure of 980mbar (29inHg). Due to very strong wind shear and decreasing sea surface temperatures, the storm began losing tropical characteristics shortly thereafter. Early on November12, the system became extratropical about 430mi (690km) south-southeast of Cape Race, Newfoundland. Late on November13, the remnants merged with a larger extratropical cyclone.[83] Between November15 and November16, the remnants of Kate affected the United Kingdom and Ireland.[84][85] Across Wales, high winds downed trees and heavy rain flooded roadways.[86]
The following list of names was used for named storms that formed in the North Atlantic in 2015.[87] This was the same list used in the 2009 season, as no names were retired following that season.[88] Even so, a storm was named Joaquin (which had replaced Juan in 2003) for the first and only time in 2015.[89]
On April25, 2016, at the 38th session of the RA IV hurricane committee, the World Meteorological Organization retired the names Erika and Joaquin from its rotating name lists due to the amount of damage and number of deaths each one caused, and they will not be used again in the North Atlantic basin. They were replaced with Elsa and Julian, respectively, when the list was used again for the 2021 season.[90][91]
Season effects
This is a table of all of the storms that formed in the 2015 Atlantic hurricane season. It includes their name, duration, peak classification and intensities, areas affected, damage, and death totals. Deaths in parentheses are additional and indirect (an example of an indirect death would be a traffic accident), but were still related to that storm. Damage and deaths include totals while the storm was extratropical, a wave, or a low, and all of the damage figures are in 2015 USD.
↑ All damage figures are in 2015 USD, unless otherwise noted
References
↑ Saffir–Simpson Hurricane Wind Scale. National Hurricane Center (Report). Miami, Florida: National Oceanic and Atmospheric Administration. May 23, 2013. Archived from the original on January 11, 2014. Retrieved April 18, 2014.
↑ Stacy R. Stewart (February 10, 2016). 2015 Atlantic Hurricane Season(PDF). National Hurricane Center (Report). Miami, Florida: National Oceanic and Atmospheric Administration. Archived(PDF) from the original on September 26, 2021. Retrieved September 29, 2021.
↑ Atlantic basin Comparison of Original and Revised HURDAT. Hurricane Research Division; Atlantic Oceanographic and Meteorological Laboratory (Report). Miami, Florida: National Oceanic and Atmospheric Administration. Archived from the original on March 29, 2014. Retrieved April 7, 2016.
1 2 Stacy R. Stewart (February 10, 2016). Annual Summary: 2015 Atlantic hurricane season(PDF). National Hurricane Center (Report). Miami, Florida: National Oceanic and Atmospheric Administration. Archived(PDF) from the original on March 11, 2016. Retrieved March 10, 2016.
↑ Stacy R. Stewart (September 15, 2015). Tropical Cyclone Report: Tropical Storm Ana(PDF). National Hurricane Center (Report). Miami, Florida: National Oceanic and Atmospheric Administration. Archived(PDF) from the original on November 24, 2015. Retrieved December 1, 2015.
""Carlos", otra vez ciclón". Diario de Yucatán (in Spanish). El Universal. June 16, 2015. Archived from the original on June 25, 2015. Retrieved June 16, 2015.
Storm Events Database. National Climatic Data Center (Report). Asheville, North Carolina: National Oceanic and Atmospheric Administration. 2015. Archived from the original on October 3, 2015. Retrieved September 18, 2015.
Robbie J. Berg (September 9, 2015). Tropical Cyclone Report: Tropical Storm Bill(PDF). National Hurricane Center (Report). Miami, Florida: National Oceanic and Atmospheric Administration. Archived(PDF) from the original on December 16, 2015. Retrieved December 2, 2015.
Richard J. Pasch; Andrew B. Penny (February 6, 2016). Tropical Cyclone Report: Tropical Storm Erika(PDF). National Hurricane Center (Report). Miami, Florida: National Oceanic and Atmospheric Administration. Archived(PDF) from the original on March 17, 2016. Retrieved February 12, 2016.
John L. Beven II (January 20, 2016). Tropical Cyclone Report: Hurricane Fred(PDF). National Hurricane Center (Report). Miami, Florida: National Oceanic and Atmospheric Administration. Archived(PDF) from the original on January 27, 2016. Retrieved February 12, 2016.
Robbie J. Berg (November 16, 2015). Tropical Cyclone Report: Hurricane Joaquin(PDF) (Report). Miami, Florida: National Hurricane Center. Archived(PDF) from the original on March 4, 2016. Retrieved March 8, 2016.
Government of the Bahamas (April 5, 2016). Review of the Past Hurricane Season. The Tribune (Report). Archived from the original on April 17, 2016. Retrieved April 6, 2016.
1 2 3 4 5 Stacy R. Stewart (September 15, 2015). Tropical Cyclone Report: Tropical Storm Ana(PDF). National Hurricane Center (Report). Miami, Florida: National Oceanic and Atmospheric Administration. Archived(PDF) from the original on November 24, 2015. Retrieved December 1, 2015.
↑ Public Information Statement. National Weather Service Office in Wilmington, North Carolina (Report). Wilmington, North Carolina: National Oceanic and Atmospheric Administration. May 10, 2015. Archived from the original on May 13, 2015. Retrieved May 10, 2015.
↑ Eric S. Blake; James L. Franklin (June 12, 2015). Tropical Weather Outlook valid 200 pm EDT Fri Jun 12 2015. National Hurricane Center (Report). Miami, Florida: National Oceanic and Atmospheric Administration. Archived from the original on March 3, 2016. Retrieved December 2, 2015.
1 2 3 4 5 Robbie J. Berg (September 9, 2015). Tropical Cyclone Report: Tropical Storm Bill(PDF). National Hurricane Center (Report). Miami, Florida: National Oceanic and Atmospheric Administration. Archived(PDF) from the original on December 16, 2015. Retrieved December 2, 2015.
1 2 Texas Event Report: Flash Flood. National Weather Service Office in Fort Worth, Texas (Report). National Climatic Data Center. 2015. Archived from the original on October 3, 2015. Retrieved December 2, 2015.
1 2 Lixion A. Avila (August 14, 2015). Tropical Storm Claudette(PDF) (Report). Tropical Cyclone Report. Miami, Florida: National Hurricane Center. Archived(PDF) from the original on October 2, 2015. Retrieved September 30, 2015.
1 2 3 Stacy R. Stewart (January 19, 2016). Tropical Cyclone Report: Hurricane Danny(PDF) (Report). Miami, Florida: National Hurricane Center. Archived(PDF) from the original on January 27, 2016. Retrieved January 22, 2016.
1 2 3 4 Richard J. Pasch; Andrew B. Penny (February 6, 2016). Tropical Cyclone Report: Tropical Storm Erika(PDF). National Hurricane Center (Report). Miami, Florida: National Oceanic and Atmospheric Administration. Archived(PDF) from the original on March 17, 2016. Retrieved February 12, 2016.
↑ Laurie-Anne Virassamy (August 27, 2015). "Erika perturbe la Martinique". France Télévisions (in French). Archived from the original on August 30, 2015. Retrieved August 30, 2015.
↑ Jeff Masters (August 29, 2015). "Erika Dissipates". Weather Underground. Archived from the original on September 29, 2021. Retrieved September 29, 2021.
1 2 3 4 John L. Beven II (January 20, 2016). Tropical Cyclone Report: Hurricane Fred(PDF). National Hurricane Center (Report). Miami, Florida: National Oceanic and Atmospheric Administration. Archived(PDF) from the original on January 27, 2016. Retrieved February 12, 2016.
↑ Nélio dos Santos (September 7, 2015). "Um verde que renasce do Furacão Fred" (in Portuguese). Bonn, Germany: Deutsche Welle. Archived from the original on November 28, 2015. Retrieved December 2, 2015.
↑ Eric S. Blake (November 21, 2015). Tropical Cyclone Report: Tropical Storm Grace(PDF) (Report). Miami, Florida: National Hurricane Center. Archived(PDF) from the original on December 8, 2015. Retrieved December 1, 2015.
1 2 3 Todd B. Kimberlain (October 21, 2015). Tropical Storm Henri(PDF) (Report). Tropical Cyclone Report. Miami, Florida: National Hurricane Center. Archived(PDF) from the original on November 24, 2015. Retrieved October 28, 2015.
1 2 John P. Cangialosi (November 16, 2015). Tropical Cyclone Report: Tropical Storm Ida(PDF) (Report). Miami, Florida: National Hurricane Center. Archived(PDF) from the original on December 8, 2015. Retrieved December 3, 2015.
1 2 Lixion A. Avila (January 4, 2016). Tropical Cyclone Report: Hurricane Kate(PDF) (Report). Miami, Florida: National Hurricane Center. Archived(PDF) from the original on March 4, 2016. Retrieved March 8, 2016.
↑ National Hurricane Operations Plan(PDF) (Report). Washington, D.C.: NOAA Office of the Federal Coordinator for Meteorological Services and Supporting Research. May 2021. p.3-8. Archived(PDF) from the original on September 3, 2023. Retrieved January 22, 2024.
This page is based on this Wikipedia article Text is available under the CC BY-SA 4.0 license; additional terms may apply. Images, videos and audio are available under their respective licenses.


